Monitor AWS Load Balancer metrics
Analyze ELB request count
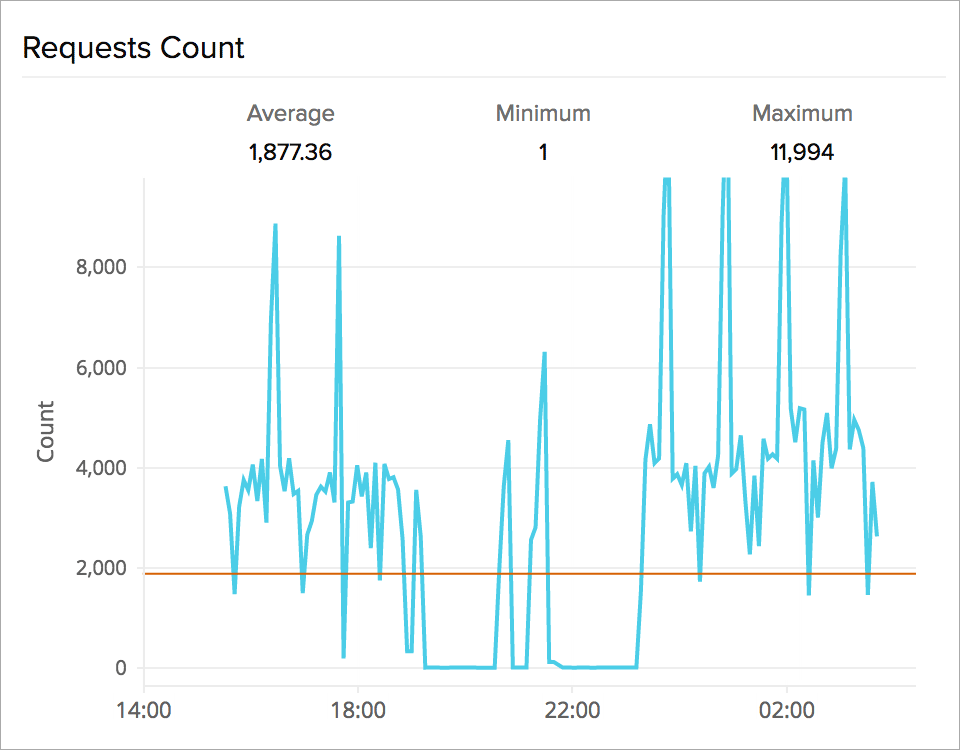
Track the number of client requests received and routed by the Elastic Load Balancer. Monitoring the average request rate will give you an idea about the traffic demand for your application. Analyzing trends will tell you whether you have to add instances or enable Auto Scaling.
Identify latency patterns
The latency or the target response time metric will give you an account of the time it took for the back-end instances to respond to the application request. Analyze resource utilization of EC2 instances or containers to correlate latency spikes with CPU or memory usage increase.

Avert request spillover
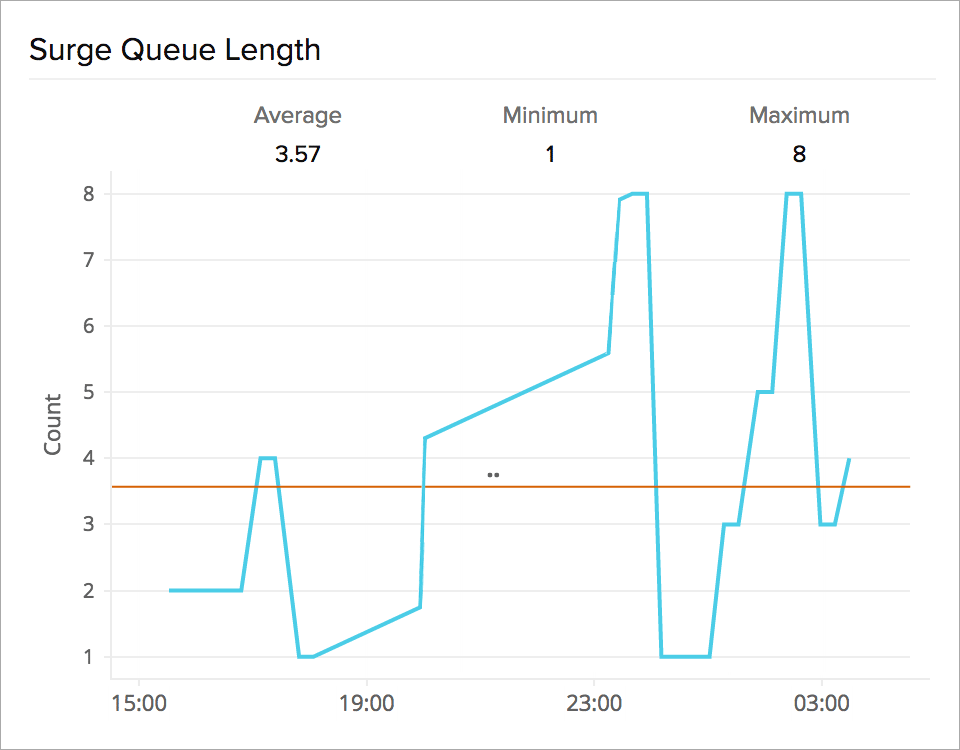
Increasing latency and system resource constraints can lead to requests getting queued up. Keep track of the average number of requests getting queued with the surge queue length metric. Configure thresholds and alerts to stay on top of surge queue length increase to prevent request spillover.
Troubleshoot ELB HTTP error response codes
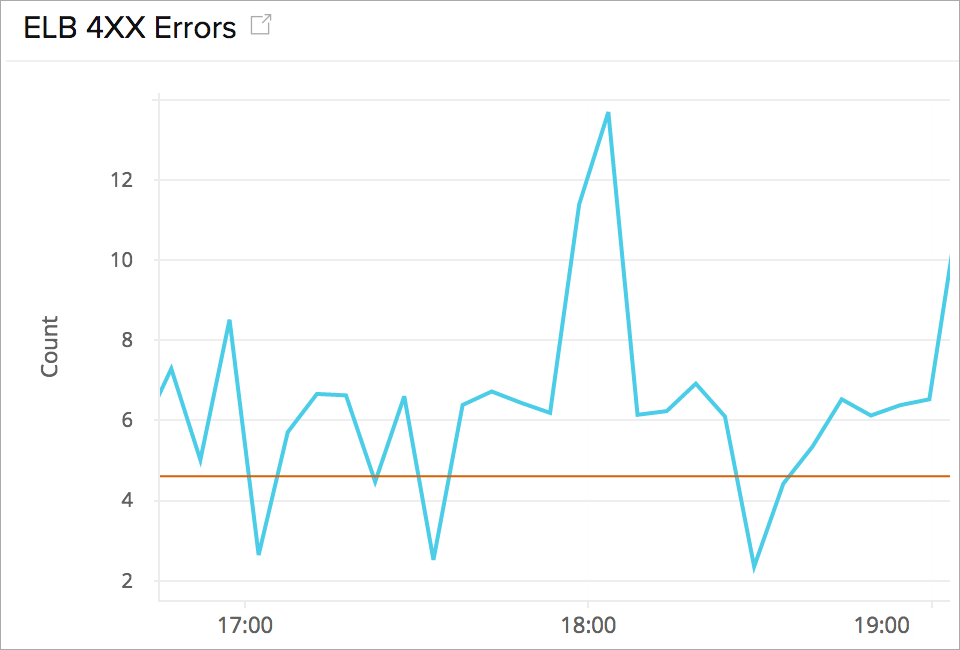
Gather statistics on the number of HTTP error response codes returned by the Elastic Load Balancer. These error codes can be both client related (4XX errors) or back-end instance related (5XX). Identify potential causes by analyzing the type of error code returned.
Monitor target HTTP error response codes
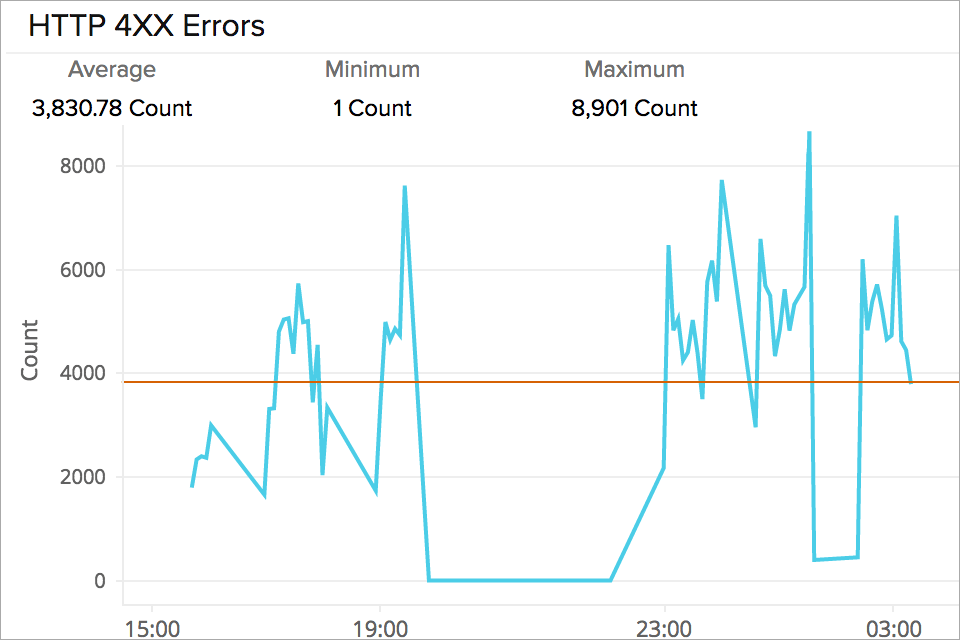
Get an aggregate of HTTP 4XX and 5XX error codes generated by the targets in your group. Monitoring and setting up alerts will let you know when your back-end servers are generating these errors. Review your application logs for the corresponding time to troubleshoot the problem.
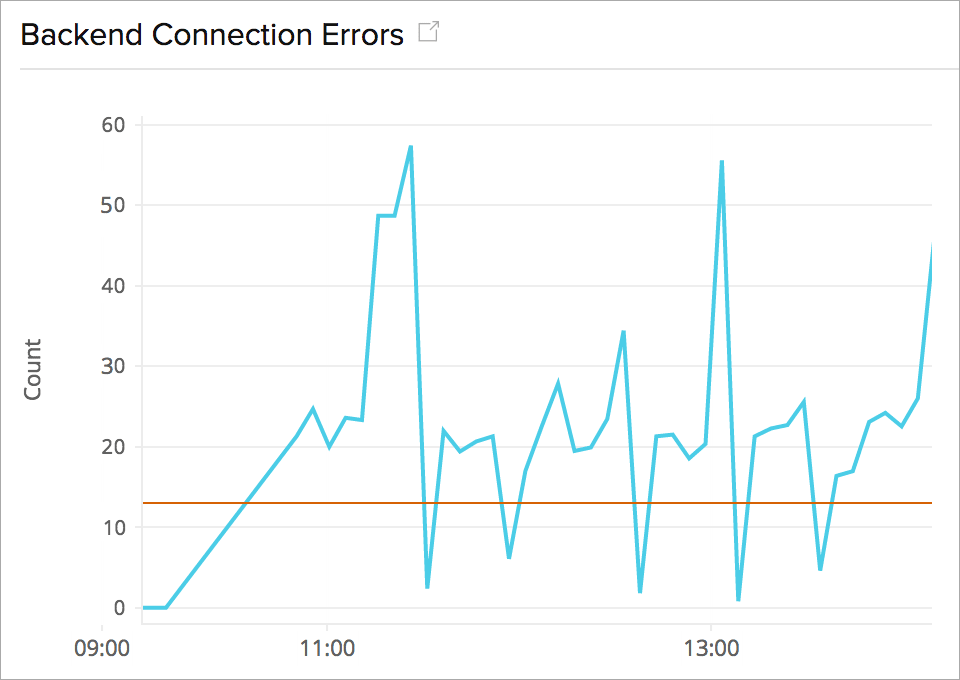
Fix back-end connection errors
Measure the number of connections that could not be successfully established between your load balancer and its registered instances. Drill down to identify whether a particular EC2 instance or an availability zone is the source of the issue.
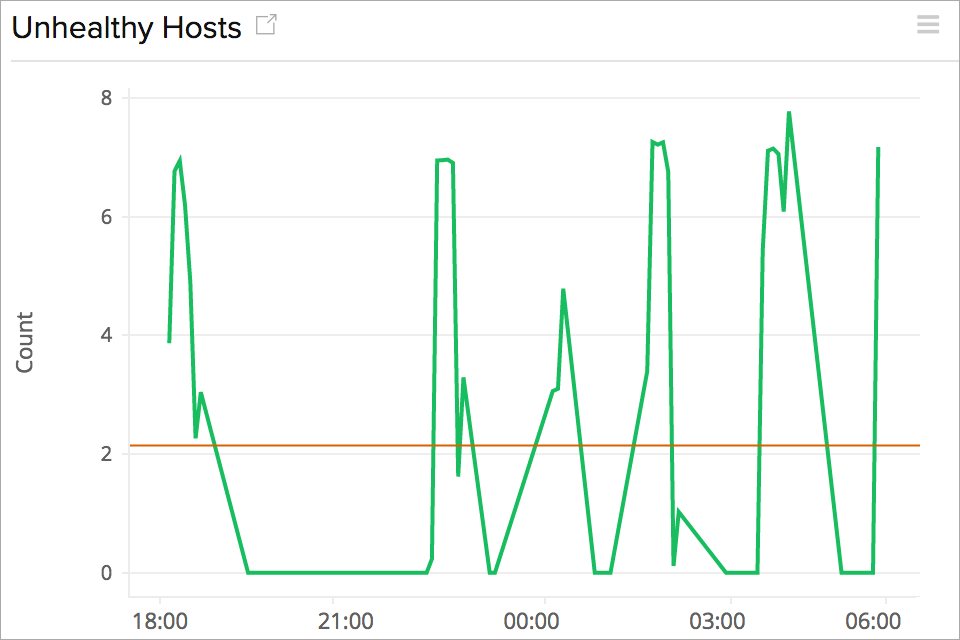
Track healthy and unhealthy host count
A reduced number of registered healthy hosts can increase latency in the long run. Monitor average number of healthy and unhealthy hosts in each availability zone, set up alerting triggers to make sure enough healthy instances are always behind your load balancer to service the incoming requests.
Check connection count statistics
Understand front-end and back-end connection statistics for your Application type Elastic Load Balancer. Track the number of new and active TCP connections established between the client, ELB, and the target. Understand the scalability of your ELB system, know how many active concurrent TCP socket connection can the load balancer handle before it starts rejecting them.

