Monitor your Remote Work Infrastructure
This tutorial aims at helping SMBs, enterprises to ensure the uptime and performance of their remote work infrastructure. Remote Monitoring plays a vital role as it helps IT teams to take care of their entire remote working infrastructure.
Remote Monitoring(RMON) helps monitor network operational activities of the remote work infrastructure by using probes called On-Premise Pollers. This helps users efficiently manage their network and infrastructure components.
This document will cover the following in detail:
III. Internal Network Monitoring
IV. VPN Monitoring
VI. PORT Monitoring
VII.How to add users and customize alert settings?
VIII. Threshold configurations (covered under each module)
I. AWS Workspaces
We shall initially start with VDIs, virtualize a desktop setup so that one centralized server, either on-premises or in the cloud, runs the operating system and applications. All resources are stored in the virtual desktops, and the users access them via physical machines.
Topics to be covered:
- Why should you monitor Amazon Workspaces?
- Policies and permissions
- Setup and configuration
- Polling frequency
- How to set up thresholds?
- Metrics Supported
Why should you monitor Amazon Workspaces?
You can centrally manage your desktop deployments from Amazon Workspace, however to centrally monitor these desktops and get notified if they go Down, you would have to monitor Amazon Workspaces on a whole.
You can monitor the connection attempt, active session and users connected via your VDIs from one single console and get notified by setting a threshold for each attribute with Site24x7.
Setup and configuration
- If you haven't done so already, enable access to your AWS resources between your AWS account and Site24x7's AWS account by either:
- Creating Site24x7 as an IAM user, or
- Creating a cross account IAM role. Learn more.
- On the Integrate AWS Account page, check the box next to the WorkSpaces. Learn more.
Policies and permissions
The following permissions are required by Site24x7 to discover Workspaces and collect configuration information.
- "workspace:Describe*" - Retrieves a list that describes the available WorkSpaces bundles.
- "ds:Describe*" - Retrieves information about the directories that belong to this account.
Polling frequency
Site24x7 queries AWS to collect WorkSpaces performance metrics according to the configured poll frequency. The minimum poll interval supported is one minute, and the maximum is 24 hours. Learn more.
Supported metrics
| Attribute | Description | Statistic | Data Type |
| Available | The number available requests sent to the WorkSpace. | Sum | Status |
| Unhealthy | The number of available requests rejected by the WorkSpace. | Sum | Status |
| Maintenance | The number of times the WorkSpace was under maintenance. | Sum | Status |
| Connection Attempt | The number of connection attempts. | Sum | Count |
| Connection Success | The number of successful connections. | Sum | Count |
| Connection Failure | The number of failed connections. | Sum | Count |
| Session Launch Time | The amount of time it takes to initiate a WorkSpaces session. | Average | Seconds |
| In Session Latency | The round trip time between the WorkSpaces client and the WorkSpace. | Average | Milliseconds |
| Session Disconnect | The number of connections that were closed, including user-initiated and failed connections. | Sum | Count |
| Users Connected | The number of time a user connected to the WorkSpace. | Sum | Count |
| Stopped | The number of times the WorkSpace has been stopped. | Sum | Count |
II. On-Premise Poller
On-Premise Poller helps to monitor your internal network and resources like URLs and network devices behind a firewall or virtual private network (VPN). This software requires near zero maintenance and is firewall friendly and can be considered as a private monitoring station complementing Site24x7's global 100 locations. Site24x7 On-Premise Poller can be installed on Windows and Linux machines in both 32-bit and 64-bit versions and can be installed in virtual machines as well.
Follow these links to download the On-Premise Poller:
Network devices:
When adding network devices for monitoring, you'll be prompted to choose an active On-Premise Poller. The poller should be installed in the same network as that of the devices to monitored. The poller discovers these devices and adds them for monitoring.
- Routers
- Switches
- Firewalls
- Load balancers
- Wireless devices
- WAN accelerators
- Printers
- UPSs
- Storage devices
Add On-Premise Poller for Windows | Add On-Premise Poller for Linux | More on On-Premise Poller architecture | Troubleshooting tips
III.Internal Network Monitoring
Network monitoring is an IT process that tracks and monitors the health and performance of network components, endpoints, and links for their faults, and helps to diagnose, optimize, and manage various network resources.
Pre-requisites for network monitoring
Site24x7 Network Monitoring requires an On-Premise Poller to be installed in the network that is monitored. Both Windows and Linux flavours are supported.
Supported device types
- Wireless
- Load Balancers
- WAN Accelerators
- Printers
- UPS
- Storage and any device with SNMP support
Supported SNMP versions
Site24x7's Network Monitoring uses SNMP. SNMP mode is used to communicate with the remote devices and collect performance metrics. All the versions such as SNMP v1, SNMP v2, and SNMP v3 are supported.
Custom SNMP monitoring
Monitor any device from any vendor using our custom SNMP monitoring. Use device templates to add any device and monitor any metric using custom performance counters. Tabular OIDs can also be monitored using tabular performance counters.
SNMP trap processing
Stay on top your network and hardware issues, and take quick corrective actions by processing SNMP traps received from your network devices. Site24x7 instantly processes these traps and notifies you of the anomalies.
Performance metrics
You can view the device performance snapshot under monitor details page. Inside the Site24x7 web client's home page, click on the respective network device to access the monitor details page.
Setting thresholds for network attributes
Threshold and Availability Profile for a network device helps you decide if a specific resource has to be declared UP, TROUBLE, or DOWN. Thresholds can also be configured for child attributes like network interfaces and performance counters.
Reports
Gather performance data of resources monitored and generate numerous reports. The following are the different types of reports that are available for Network Devices.
Troubleshooting tips
- Network devices are being discovered as unknown
- Network module does not start properly
- Check the SNMP reachability using MIB browser
IV. VPN Monitoring
VPNs play an important role in business continuity for the employees to work from home in order to connect to their corporate environment. Site24x7 with its device templates and performance counters provides comprehensive monitoring to stay on top of your VPN, while you WFH.
In this doc, we'll cover:
Pre-requisites
- Site24x7 VPN Monitoring requires an On-Premise Poller to be installed in the network that is monitored. Both Windows and Linux flavours are supported.
- The device should be SNMP supported.
Refer to out VPN tutorials for more details.
V. PING Monitoring
Ping monitor allows you to monitor the gateway of your routers to check its availability and packet loss. Three ICMP packets are sent per poll, based on which the monitor will be considered as UP if atleast a single packet is received. However, if no packs are received, the monitor will be deemed as DOWN. Receive instant alerts when the response time crosses the threshold configured.
Add a Ping Monitor
- Login to Site24x7.
- Click Admin > Inventory > Monitors > Add Monitor.
- Select Ping from Add Monitor screen.
- Specify the host information to test the round trip latency to any host:
- Display name: Provide an appropriate name to the Ping monitor for identification purpose.
- Host: Specify the host name.
- Check frequency: Choose the required polling frequency. The frequency can be set from 1 minute to 1 day.
- Echo timeout: The host must respond with an Echo Reply message within this duration.
- Prefer IPv6: If you want to monitor the round-trip latency to your host over IPv6 enabled locations, simply move the rocker button to "YES" when creating or editing a monitor form.
Note- Site24x7 lets you monitor your dual-stacked IPv4/IPv6 based infrastructure as per you need. IPv4 will be enabled as the default protocol. You'll be able to monitor your IPv6 infrastructure, once you enable the rocker button to IPv6. If the connectivity over IPv6 fails, it will not fall back to IPv4 automatically. Read more.
- Enabling IPv6 in the monitoring form doesn't make it compatible to monitor IPv4, by default. If you want to monitor a resource, which is compatible with both IPv4 and IPv6–you'll have to set up two separate monitor checks for this.
- Monitoring locations: Select a location profile from the drop down list from where the ping service can be polled from the selected location. You can select an IPv4/IPv6 enabled monitoring location.
To know more, refer Location Profile.
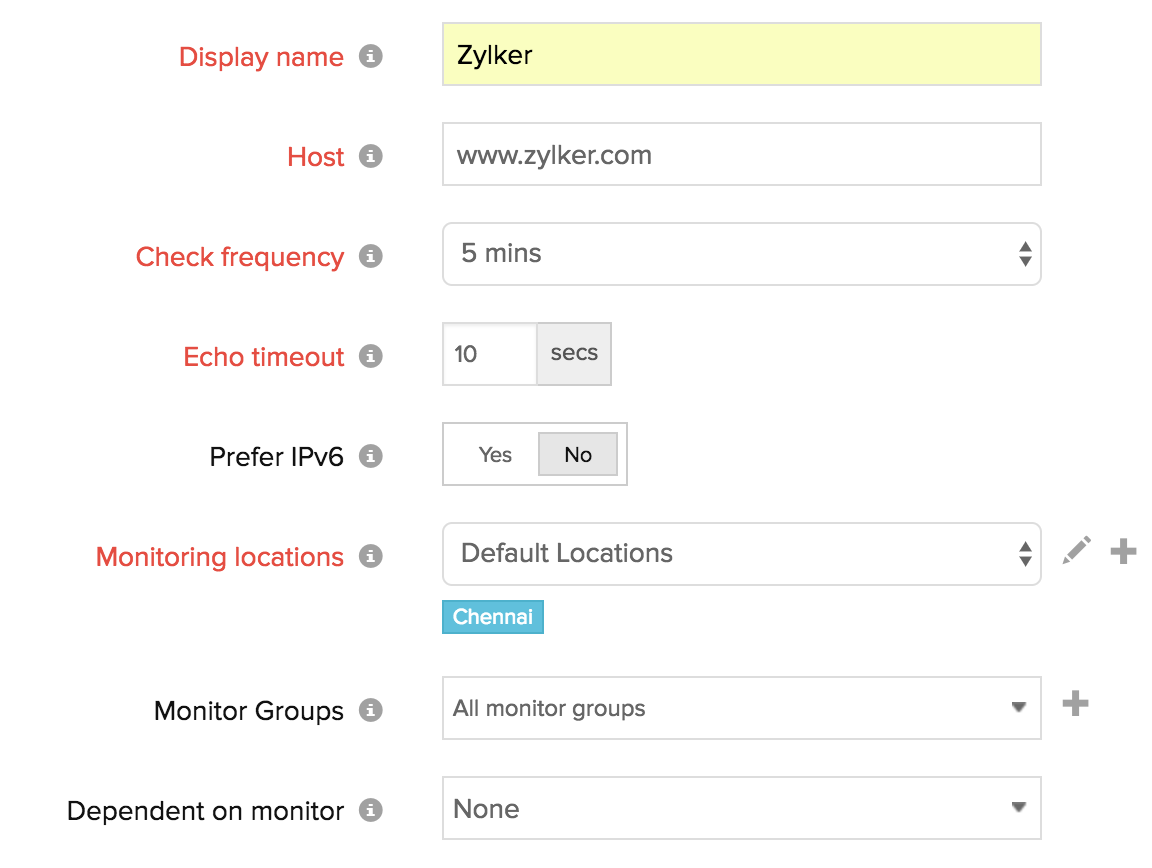
- Monitor Groups: You can associate your monitor with multiple monitor groups by selecting the relevant monitor groups from the drop down list. This allows in logical grouping of your monitors.
To learn how to create a monitor group for your monitors, refer Monitor Groups. - Dependent on monitor: Select a monitor from the drop-down list to choose it as your dependent resource. Alerts to your monitor will be suppressed based on the DOWN status of your dependent resource.
NoteConfiguring a dependent resource and suppressing alerts based on the dependent resource's status is part of providing you with better false alerts protection. Learn more about alert suppression at monitor level.
NoteIf you select "None" in the dependent resource field, alerting will progress as per your normal configuration settings. No alerts will be suppressed in this case as the monitor doesn't have any dependent resource.
NoteMultiple monitor group support for monitors allow a monitor to be associated with multiple dependent resources in different monitor groups. If during a normal monitor status check, any one of these dependent resources' status is identified as DOWN, the alert for the monitor will be automatically suppressed. However, the dependency configuration at monitor level is always given the higher priority over any other monitor group level dependency configuration for suppressing alerts.
- Specify the following details for Configuration Profiles:
- Threshold and Availability: Select a threshold from the drop down list or choose the default threshold set available and get notified when the resources cross the configured threshold and availability.
To create a customized threshold and availability profile, refer Threshold and Availability.NoteRefer here to know how to set the ping monitor to not show as down unless it is down globally
- Notification Profile: Choose a notification profile from the drop down list or select the default profile available. Notification profile helps to configure when and who needs to be notified in case of downtime.
Refer Notification Profile to create a customized notification profile. - User Alert Group: Select the user group that need to be alerted during a outage.
To add multiple users in a group, see User Groups. - Tags: Associate your monitor with predefined Tag(s) to help organize and manage your monitors creatively. Learn how to add Tags.
- IT Automation: Select an automation to be executed when the website is down/trouble/up/any status change/any attribute change. The defined action gets executed when there is a state change and selected user groups are alerted.
To automate corrective actions on failure, refer IT Automation.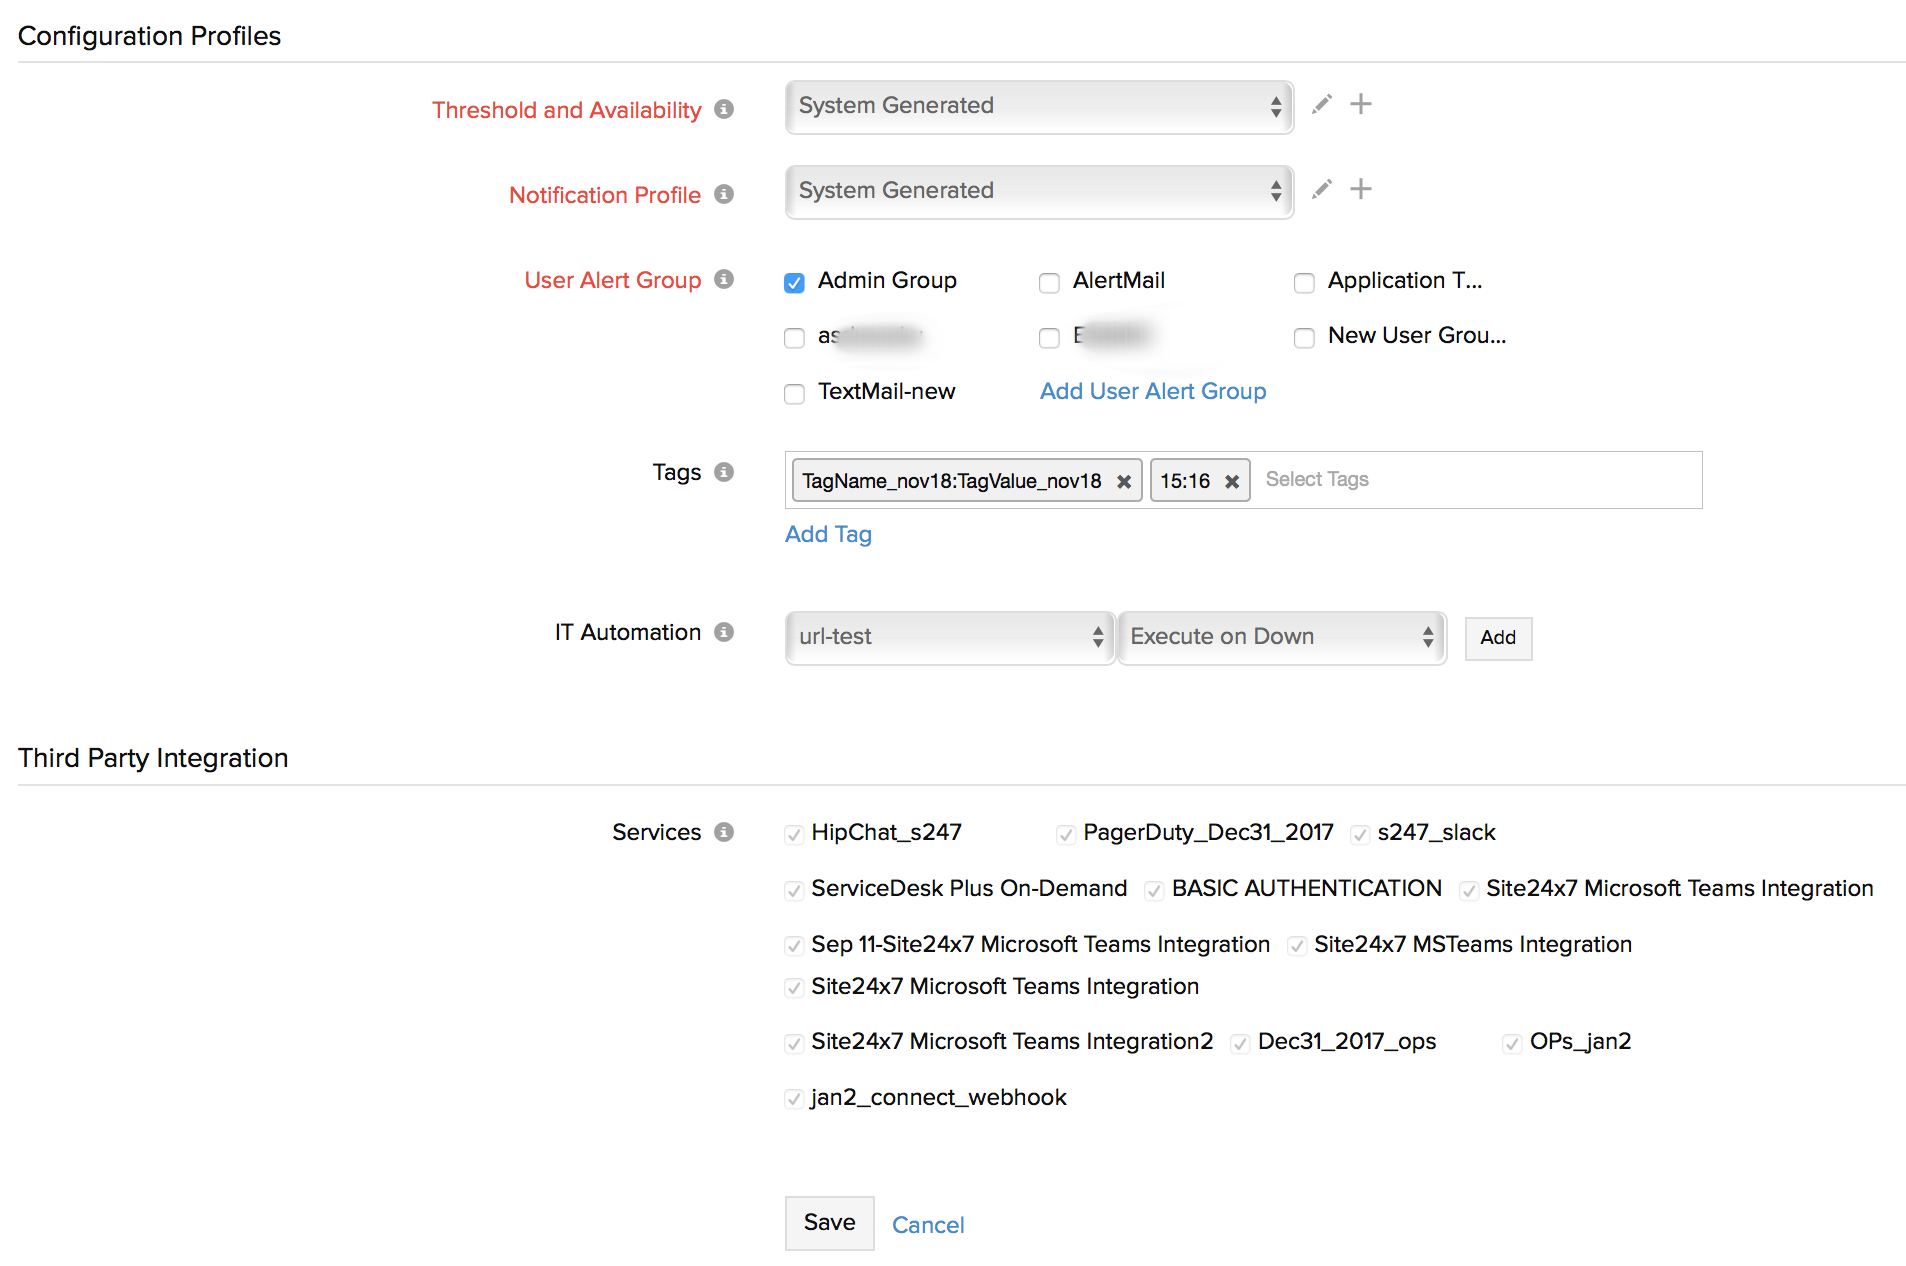
- Threshold and Availability: Select a threshold from the drop down list or choose the default threshold set available and get notified when the resources cross the configured threshold and availability.
- Third Party Integrations: Associate your monitor with a pre-configured third-party service. It lets you push your monitor alarms to selected services and facilitate improved incident management.
NoteIf you haven't setup any integrations yet, navigate across to ”Admin > Third Party Integration” to create one. Tell me more.
- Click Save.
VI. PORT Monitoring
Working VPN can be monitored by checking the connection to CPNHost:port. PORT monitoring helps you to monitor the accessibility of the VPN service from remote servers.
Add a Port (Custom Protocol) Monitor
- Login to Site24x7.
- Click Admin > Inventory > Monitors > Add Monitor.
- Select Port (Custom Protocol) in Add Monitors page.
- Specify the following details to add the Port (Custom Protocol) monitor:
- Display name: Provide a appropriate name for the Port (Custom Protocol) monitor.
- Host: Specify a name for TCP/IP host.
- Port (TCP): Specify the port the host is listening to.
- Use Secure Connection (SSL): Use the toggle button to enable or disable a secure SSL connection.
- Check frequency: Choose the required polling frequency. The frequency can be set from 1 minute to 1 day.
- Connection timeout: Specify time in seconds the connection need to establish with the target server.
- Command: Configure a command that can be executed through the port. You can configure commands based on the application service listening on the port.
- Prefer IPv6: If you want to connect to a Port over IPv6 enabled locations, simply move the rocker button to "YES" when creating or editing a monitor form.
Note- Site24x7 lets you monitor your dual-stacked IPv4/IPv6 based infrastructure as per you need. IPv4 will be enabled as the default protocol. You'll be able to monitor your IPv6 infrastructure, once you enable the rocker button to IPv6. If the connectivity over IPv6 fails, it will not fall back to IPv4 automatically. Read more.
- Enabling IPv6 in the monitoring form doesn't make it compatible to monitor IPv4, by default. If you want to monitor a resource, which is compatible with both IPv4 and IPv6–you'll have to set up two separate monitor checks for this.
- Monitoring locations: Select a location profile from the drop down list from where the TCP/IP Ports can be polled from the selected location.
To know more, refer Location Profile.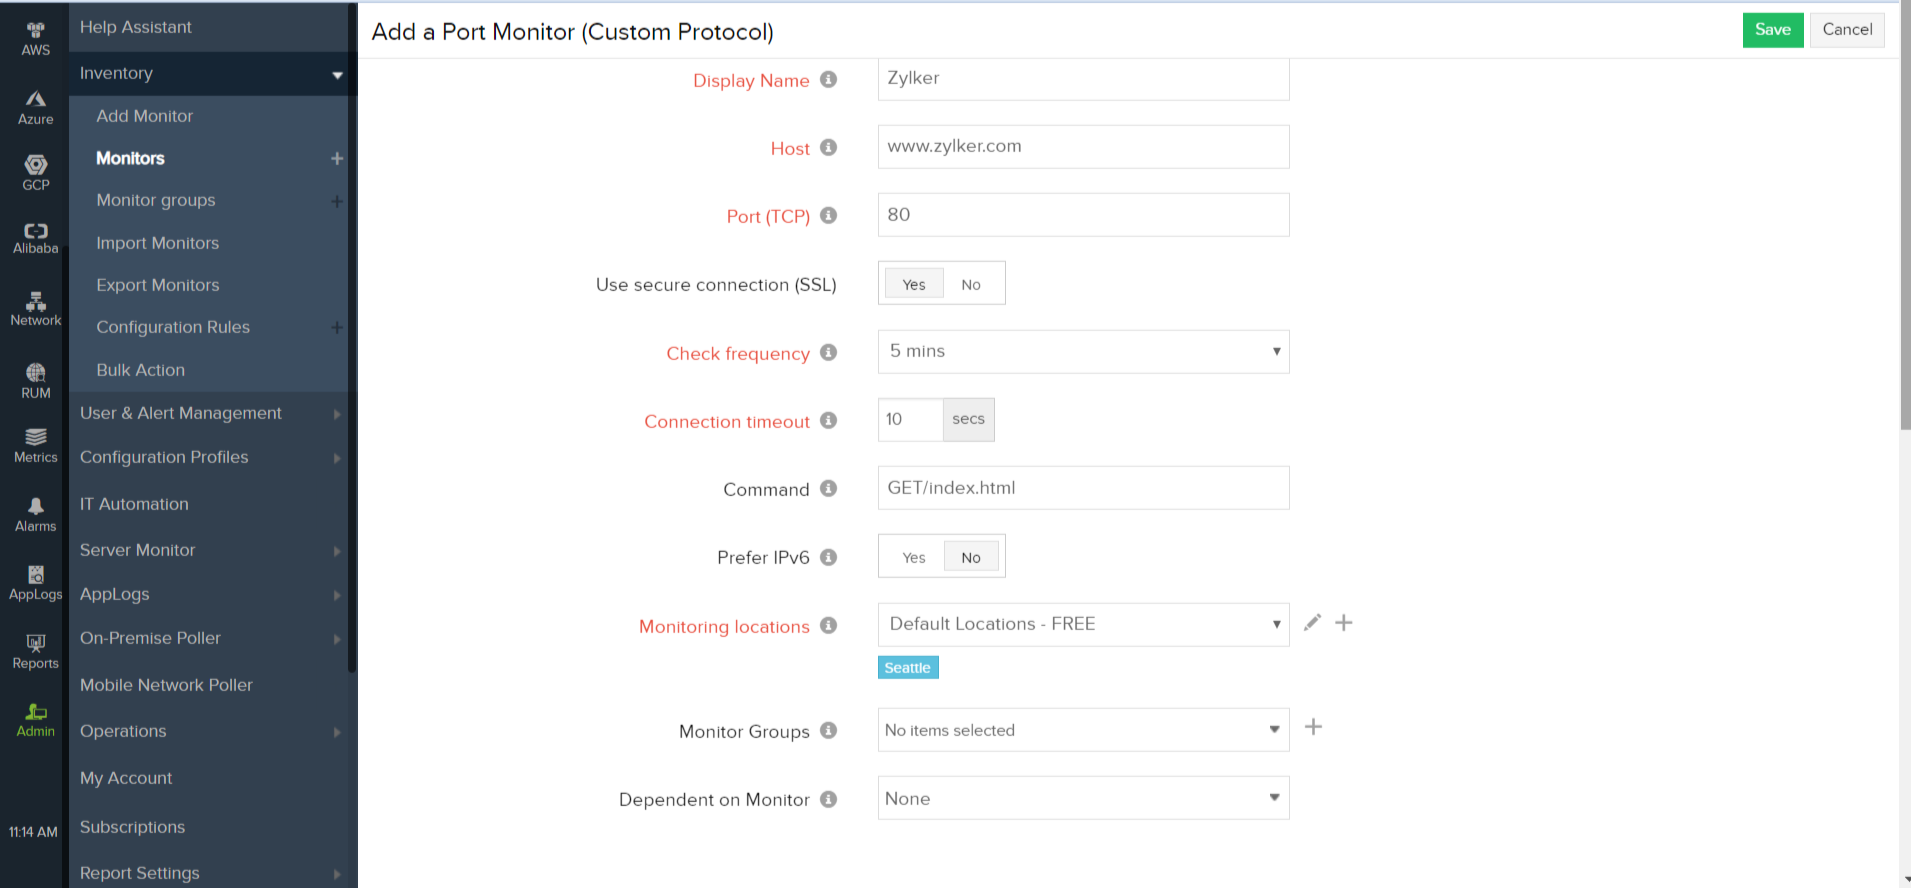
- Monitor Groups: You can associate your monitor with multiple monitor groups by selecting the relevant monitor groups from the drop down list. This allows in logical grouping of your monitors.
To learn how to create a monitor group for your monitors, refer Monitor Groups. - Dependent on monitor: Select a monitor from the drop-down list to choose it as your dependent resource. Alerts to your monitor will be suppressed based on the DOWN status of your dependent resource.
NoteConfiguring a dependent resource and suppressing alerts based on the dependent resource's status is part of providing you with better false alerts protection. Learn more about alert suppression at monitor level.
NoteIf you select "None" in the dependent resource field, alerting will progress as per your normal configuration settings. No alerts will be suppressed in this case as the monitor doesn't have any dependent resource.
NoteMultiple monitor group support for monitors allow a monitor to be associated with multiple dependent resources in different monitor groups. If during a normal monitor status check, any one of these dependent resources' status is identified as DOWN, the alert for the monitor will be automatically suppressed. However, the dependency configuration at monitor level is always given the higher priority over any other monitor group level dependency configuration for suppressing alerts.
- Specify the following details for Content Checks:
- Should contain string(s): Get alerted when the specified keywords are not found by the monitoring servers. Mention the keywords in the check box and use the slider button to trigger the required alert.
- Should not contain string(s): Get alerted when the specified keywords which should not be present are found by monitoring servers. Mention the keywords in the check box and use the slider button to trigger the required alert.
NoteYou must adhere to the following conditions while adding keywords in the given field:
- A single string or keyword can be configured with/without any double quotes (ex: HTML).
- If there are two strings, which comprise a single keyword–add a space in between the two strings and enclose it with double quotes. (ex: "HTML response").
- In case you have more than a couple of individual keywords configured, you will have to separate them with a space and also use double quotes for each of them. ("monitor" "HTML").
- Learn more about Content Checks.

- Specify the following details for Configuration Profiles:
- Threshold and Availability: Select a threshold profile from the drop down list or choose the default threshold set available and get notified when the resources cross the configured threshold and availability.
To create a customized profile, refer Threshold and Availability. - Notification Profile: Choose a notification profile from the drop down or select the default profile available. Notification profile helps to configure when and who needs to be alerted in case of downtime.
Refer Notification Profile to create a customized notification profile. - User Alert Group: Select the user group that need to be alerted during a outage.
To add multiple users in a group, see User Alert Group. - Tags: Associate your monitor with predefined Tag(s) to help organize and manage your monitors creatively. Learn how to add Tags.
- IT Automation: Select an automation to be executed when the website is down/trouble/up/any status change/any attribute change. The defined action gets executed when there is a state change and selected user groups are alerted.
To automate corrective actions on failure, refer IT Automation.
- Threshold and Availability: Select a threshold profile from the drop down list or choose the default threshold set available and get notified when the resources cross the configured threshold and availability.
- Third Party Integrations: Associate your monitor with a pre-configured third-party service. It lets you push your monitor alarms to selected services and facilitate improved incident management.
NoteIf you haven't setup any integrations yet, navigate across to ”Admin > Third Party Integration” to create one. Tell me more.
- Click Save.
Learn more about the various performance metrics of a Port (Custom Protocol) Monitor.
VII. Add users/contact and customize alert settings
- Log in to Site24x7 web client.
- Click Admin > User and Alert Management > Users and Alerts. Click Add User in Users screen.
- Specify the following details to Add User/Contact and Customize Alert Settings:
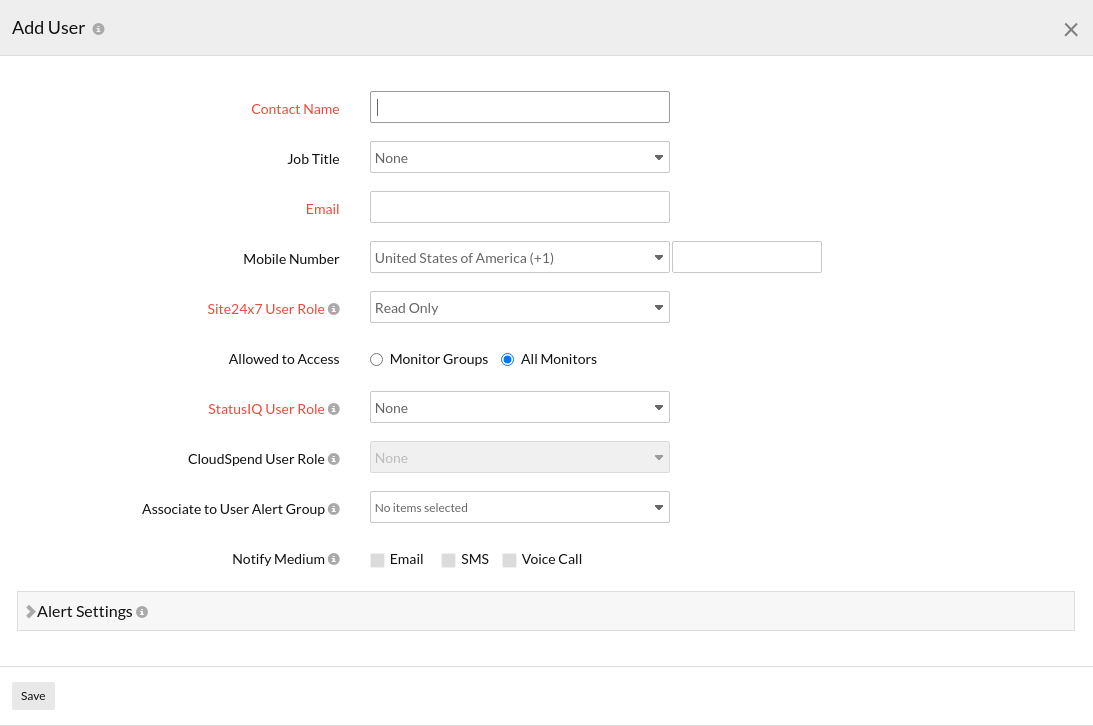
- Contact Name: Enter the name of the user.
- Job Title: Specify your job title, based on which monitoring recommendations would be populated and listed in Site24x7 Advisor. Learn more.
- Email: Specify the email address of the contact. You must verify your email address to be able to receive Site24x7 alerts and reports on your alert contact email.
NoteEven if you've a Super Admin role in your Site24x7 account, you'll still not be able to add a user to your Site24x7 account, until you have the Organization Account Admin rights. Learn more about User Roles and Privileges.
NoteIf you're an Org Admin with Site24x7 super admin rights, you can add users (with the same email domain as yours) to your account.
- Receive Voice Call and SMS Alerts:
- Mobile Number: Choose the country code from the drop down list and enter the phone number of the contact. Alerts will be sent to this phone number via voice calls or SMSs.
Note
The phone number should be set up and verified to receive any alerts. To receive the verification SMS, you've to choose a required SMS or Voice Call provider from the available list of providers. After a number is verified, you'll be able to send Test SMSs and Voice Calls to that number. If you've shared your mobile number while signing up to Site24x7, you won't receive any alerts until you verify the mobile number. After verification, this number will be automatically treated as your primary number.
NoteBased on the alert configuration, user will receive SMSs via providers like BulkSMS, Clickatell, and Twilio. Voice Call based services are handled via Twilio. As part of our GDPR compliance, we've got into specific agreements with our sub-processors (all supported SMS and voice providers) to ensure they address the pressing needs of the current security and privacy trends.
- User Role: Select the desired role from the drop down list and provide the appropriate access permission for this contact.
Note- Admin user has access permissions to all monitors.
- To add a sub user to your account, you should have the organization admin privilege or the new user should be in the same organization.
- Learn more about different user roles and their corresponding access permissions.
- Associate to User Groups: Associate the user created to one of the user groups from the drop down list. If user group has not been created, see User Group.
- Notify Medium: Mention the medium through which your contact wishes to receive the alerts. The different medium available for notifying are Email, SMS, and Phone.

- Alert Settings- Specify the following details to configure Alert Settings:
- Down, Critical, Trouble, Up: Configure the preferred mode of alerting for Down, Critical, Trouble, and Up alerts. Choose from different alerting mechanism viz Email, SMS, and Phone.
- Click Save.
