Availability Summary Report
Our availability summary report offers exhaustive detail into the overall availability, outage and downtime of your configured monitors, for any chosen period of time. In a real-time business scenario, availability summary report gives a bird's-eye view of the overall availability of your configured monitors. You can generate the Availability Summary Report based on the Monitor or the Tags.
Generate Availability Summary Report
- Login to Site24x7.
- Navigate to Reports > Monitor Type > Availability Summary Report.
Note
You can either generate a availability summary report for a selected monitor or a consolidated report for all the monitors.
- Select required monitor from the header drop-down and change the listed parameters to view a customized report.
- Monitors/Tags: Select the desired monitor from the drop down list. You can also pick a Tag from the drop-down list. On selecting a specific tag, the report will be generated for all the monitors (of that specific monitor type).
- Time Period: Choose the required time period.
Note
You can generate reports for time periods ranging from last 1, 6, 12, 24 hours or even upto a year back. Furthermore, you can also obtain reports for custom time periods.
- Business Hours: Select the time period that is most critical to your business.
- Locations: Choose the desired geographical location or poller from the list of available locations.
Note
Locations drop-down is not present in agent monitors such as Server, MS Exchange, IIS, SQL, Docker, and Network device monitors.
- Maintenance time for uptime calculation: You can include / exclude maintenance time from the monitor's uptime calculation.
- Once the report is generated, click "Share This" button on the top right corner.
- Publish Report: Click publish report and populate the form. This creates a permalink that would make the report accessible to customers without a login.
- Email: Share the report via an email. Email can be sent to only those verified users who have agreed to receive emails from Site24x7.
- Export CSV: Export the report as a CSV file.
- Export PDF: Export the report as a PDF file.
- Schedule Report: Populate the schedule report form, to create a report task that would trigger availability summary report mails to the customer.
Interpret Availability Summary Report
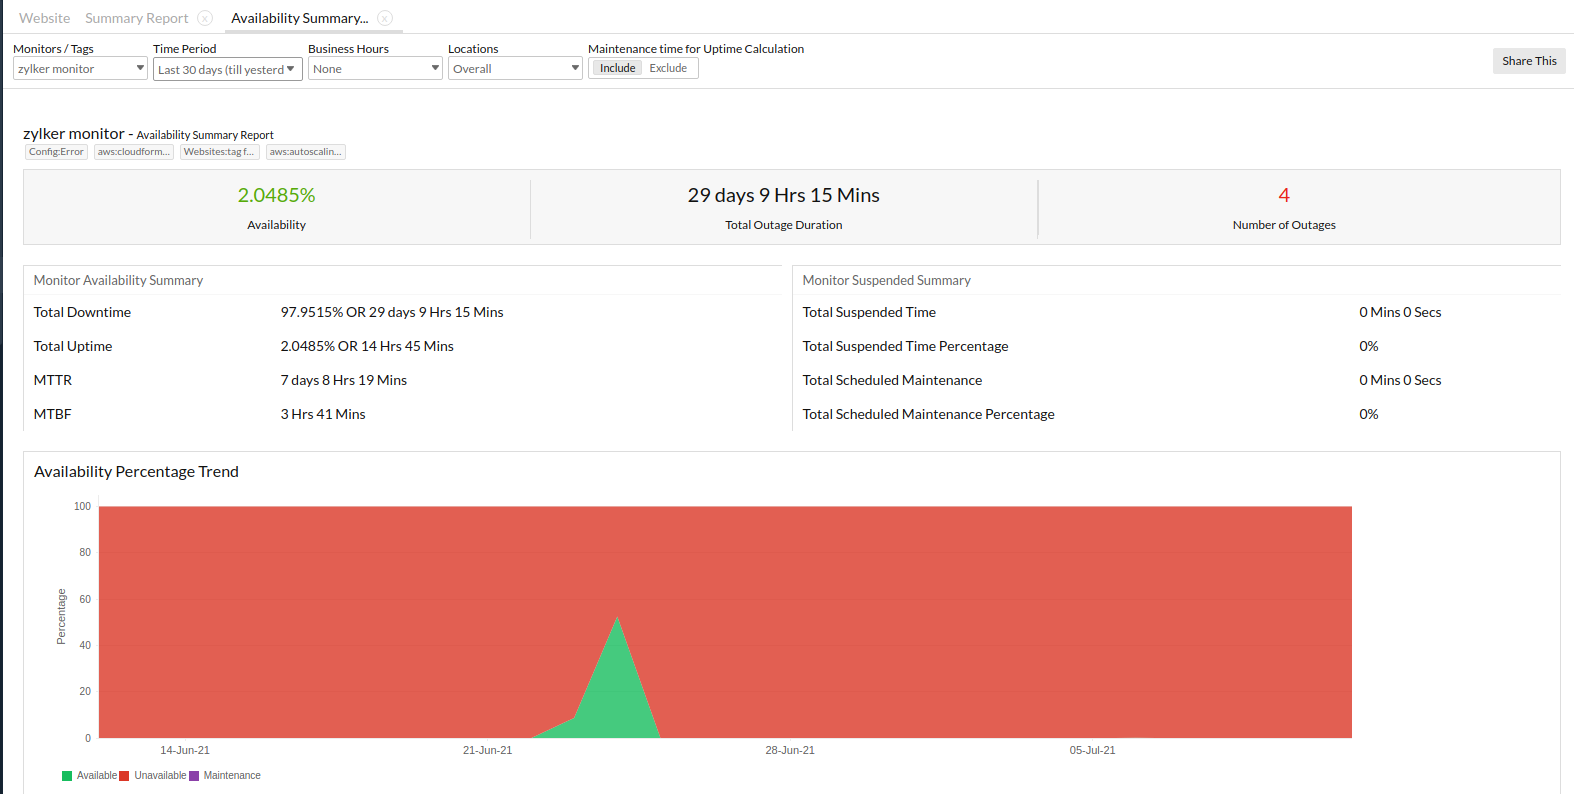
The top band provides insight into the cumulative availability percentage, total outage duration and the outages count of the selected monitor group, for the chosen time period.

Monitor Availability Summary
Detailed summary of downtime/uptime is presented in a tabular format. The detailed parameters are described here. Read this article to know more about all the variables and calculations involved.
- Total Downtime: The monitor's cumulative downtime for the selected time period is represented in terms of percentage or time.
- Total Uptime: The monitor's cumulative uptime for the selected time period is depicted in terms of percentage or time.
- Mean Time to Repair (MTTR) - The average time to repair a device or a system back to acceptable operating conditions. The term can also mean, the time spent to restore a machine to operating condition after failure. This must be as low as possible.
- Mean Time between Failures (MTBF) - The average time that a device or a system worked without failure. The term can also mean the length of time a user may reasonably expect a device or system to work before an incapacitating fault occurs. This must be as high as possible.

Monitor Suspended Summary
Unavoidable monitor suspensions and pre-planned scheduled maintenance activities consume a chunk of downtime activity. This data is segregated from downtime and presented in a tabular format for better clarity.
- Total Suspended Time: Any downtime captured due to unscheduled suspension of the monitor.
- Total Suspended Time Percentage: The cumulative downtime percentage due to the unscheduled suspension of your monitor.
- Total Scheduled Maintenance: The cumulative time consumed by all the pre-planned maintenance activity during the monitoring period.
- Total Scheduled Maintenance Percentage: The total percentage of cumulative scheduled maintenance activity carried out during the specified monitoring period.
Availability Percentage Trend
The availability percentage trend graph for the configured monitor plots the actual availability, downtime and the overall maintenance activity against a specified time period. You can also view actual availability, downtime, and marked maintenance percentage for a specified time by hovering the cursor over the designated area in the graph.

To drill down and measure the availability trend for a defined period, click and drag the cursor within the specified time slot on the graph. Click Reset Zoom on the top right corner of the graph to draw back to the default view.

Availability trend graphs have colored check boxes acting as legends for each parameter. These legends help you to visualize the groups inside the chart. Furthermore, the legends act as quick filters and enable you to isolate the parameters in the graph based on your requirement.
Downtime Report
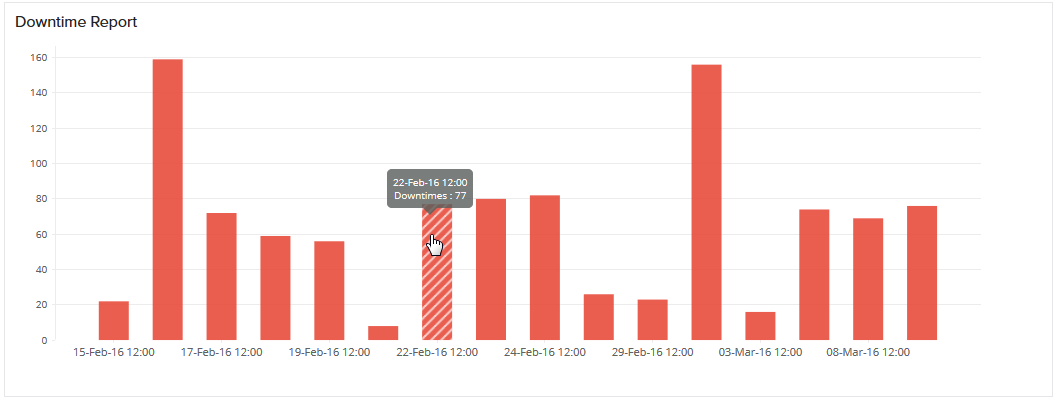
Downtime graph is mapped by counting the number of down times and plotting it against a selected time period. If the selected time period is within 24 hours, hour wise data will be plotted against X-axis. If the selected time range is outside 24 hours period, day wise data will be depicted against the X-axis.

Overall Outage Details
Overall Outage Details provide a detailed interpretation of the outages incurred by the relevant monitor. The user gets to know the exact time frame and duration of outage. For instance, a configured Real Browser Monitor would let you know the exact time span and duration when the monitor was down. Furthermore, you can find the exact cause behind the outage through comments.

Location-wise Outage Details
Get location based availability report of your configured monitor. Detailed insights into their Down duration, Availability percentage, and Downtime counts are provided to the end user.

Monitor-wise Outage Details
If you've generated the Monitor Summary Report for a pre-selected Tag, you'll be able to view the Monitor-wise outage details for all the Monitors (of that monitor Type) grouped under that Tag. You can separately view the Down Duration, Maintenance Duration, Availability percentage and the number of downtimes.

Configured Profiles
Obtain in-depth understanding about your preset configured profiles like location, threshold, availability profiles, and threshold details of your various monitors.

Metrics in an Availability Summary report
Site24x7's Availability Summary report provides information on the overall availability, outage, and downtime of your configured monitors, monitor groups, and tags for any chosen period. The various metrics that can be obtained from the Availability Summary report are:
- Availability Percentage
- Total Outage Duration
- Number of Outages
- Total Uptime
- MTTR
- MTBF
- Total Suspended Time
- Total Suspended Time Percentage
- Total Scheduled Maintenance
- Total Scheduled Maintenance Percentage
Total monitoring period
All the above mentioned metrics will be calculated based on the total monitoring period. The total monitoring period for a single monitor will be the period selected by you.
If the selected period is Last month (30 days), then the total monitoring period will be: 30 days in milliseconds, which is 2592000000 ms
The total monitoring period for individual monitors is the time period you've chosen, and that for monitor groups is obtained by multiplying the number of monitors with the time period you've chosen.
Total monitoring period for a monitor=Time period chosen
Total monitoring period for monitor groups = Monitor count * Days selected in milliseconds
For 10 monitors, if the selected period is Last month (30 days), then the total monitoring period will be: 10 * 2592000000 = 25920000000 ms
Sample Availability Summary Reports:
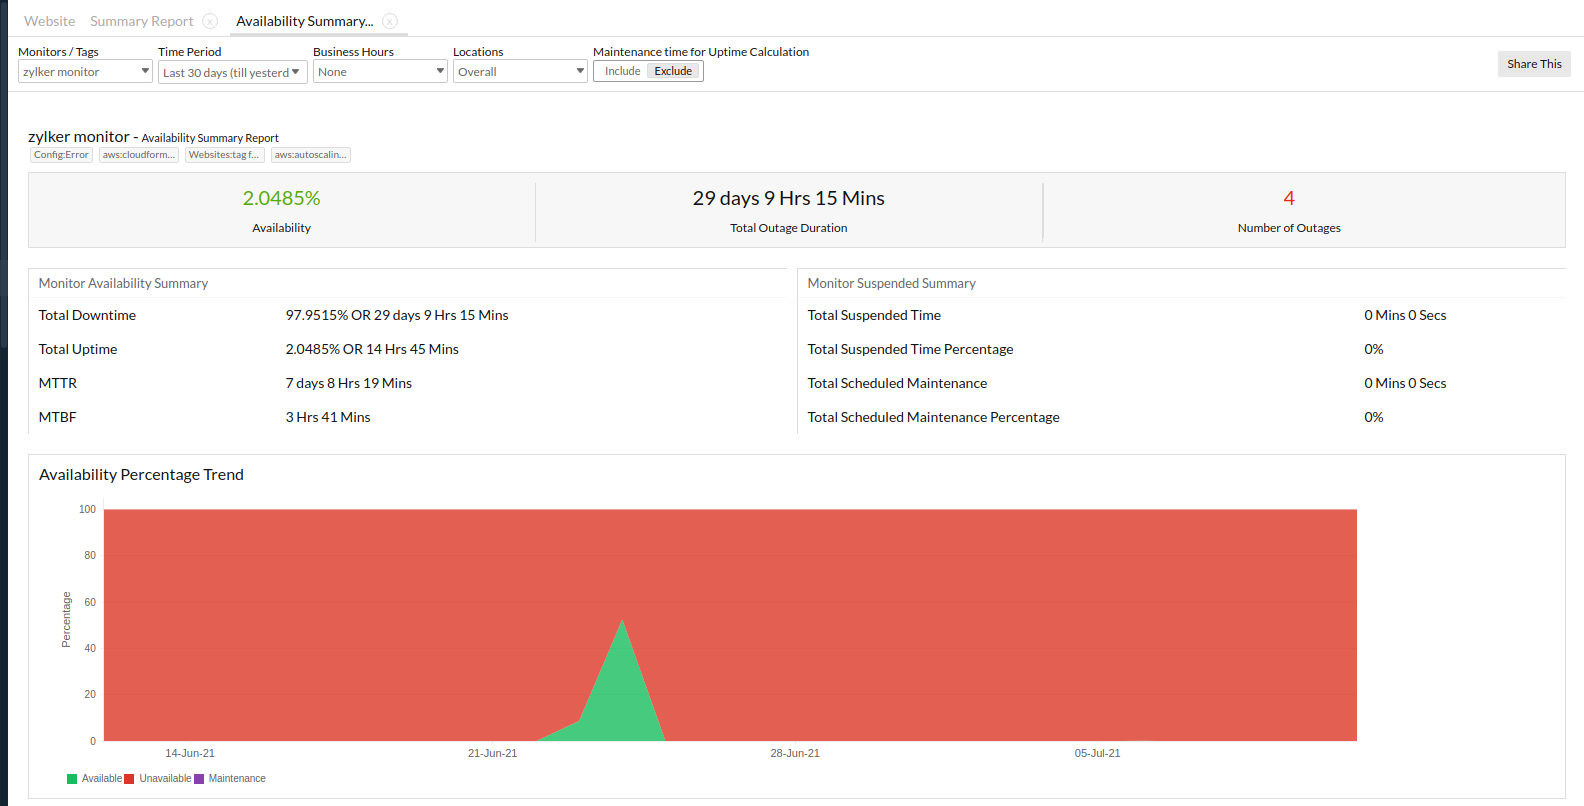
Availability Summary Report when you exclude maintenance,

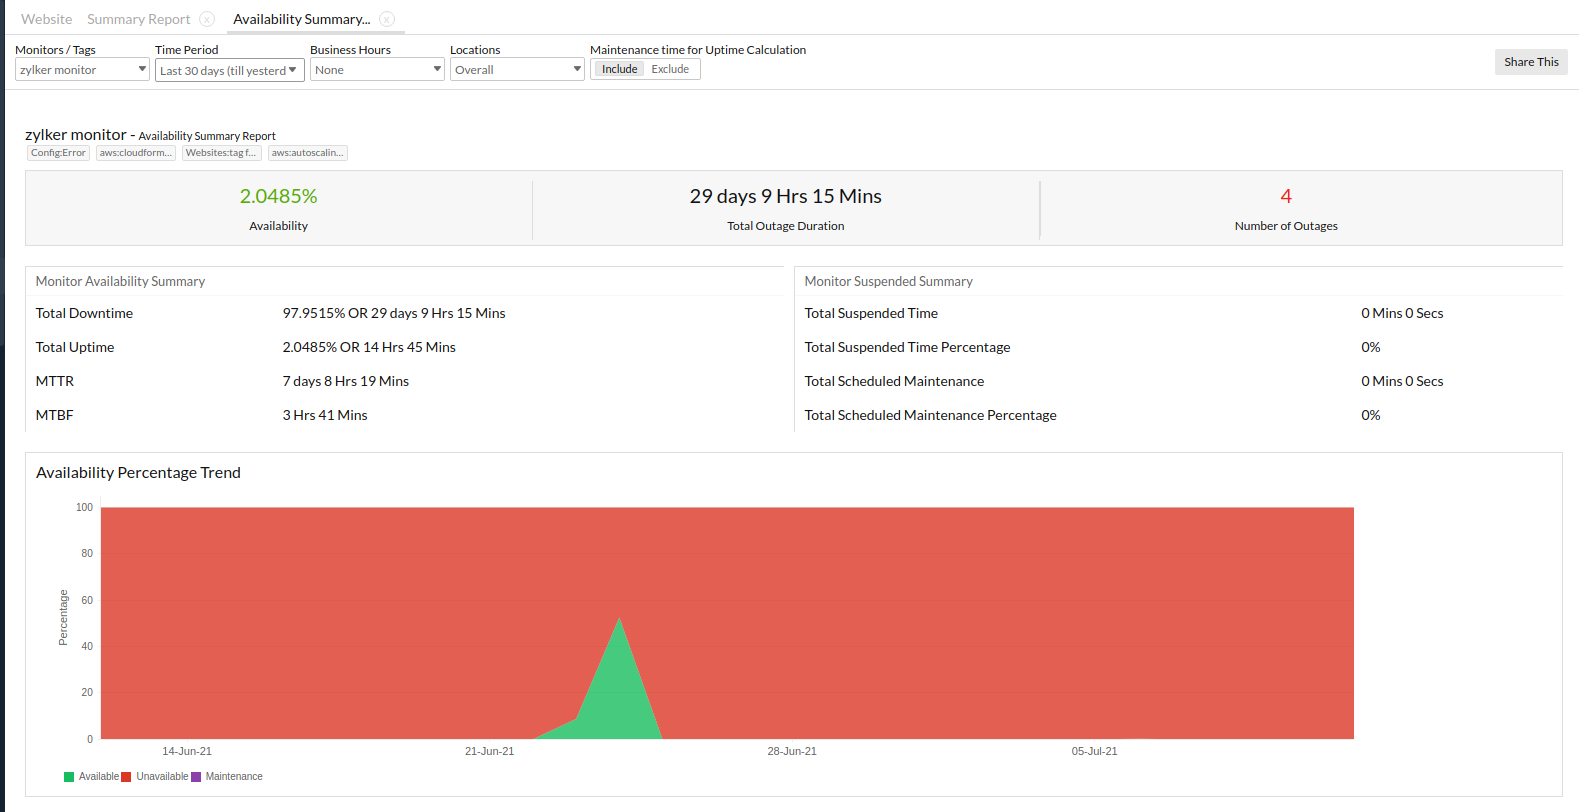
Availability Summary Report when you include Maintenance,

1. Availability Percentage:
Availability percentage is the percentage of uptime for a given period. It provides an approximation of the total time the website has been available for the end user.
How to calculate Availability Percentage:
(Uptime/Total monitoring period)* 100
Availability Percentage for a monitor:
The amount of time (in days, hours, and minutes) the monitor has been running (Up).
For instance, the time period chosen for the availability report on July 1st is Last 30 days in milliseconds, which is 2592000000 ms, or 720 hrs. The time period June 1st to June 30th will be considered for the calculation. Downtime of one day is observed, which is 86400000 ms.
Therefore, total monitoring period = 1 * 2592000000 = 2592000000 ms
Uptime = 2592000000 - 86400000 = 2505600000ms (29 days)
Availability Percentage = (2505600000 / 2592000000) * 100 = 96.67%
Availability Percentage for monitor groups:
The amount of time (in days, hours, and minutes) the selected monitors have been running (Up).
Example 1:
For instance, the time period chosen for the availability report on July 1st is Last 30 days, i.e. 2592000000 ms (720 hours).The number of monitors selected from the monitor group is 10.
Consider that each monitor had a downtime of one day, and the total downtime is the sum of all downtimes. Hence, the total downtime is 10 days, which is 864000000 ms.
Total monitoring period = Monitor count * Days selected in milliseconds
Therefore, total monitoring period = 10 * 2592000000 = 25920000000 ms (300 days)
When the maintenance period is included, uptime will be:
Uptime = 25920000000 - 864000000 = 25056000000 ms (290 days)
Availability Percentage = (25056000000 / 25920000000) * 100 = 96.67%
When maintenance period is not included, uptime will be: Consider the maintenance period for this monitor to be one day, which is 86400000 ms.
In this case, Uptime = 25920000000 - (864000000 + 86400000) = 24969600000 ms (289 days)
Availability Percentage = (24969600000 / 25920000000) * 100 = 93.34%
Since the total monitoring period is high, when comparing the outage period, there won't be much difference between single monitors and monitor groups in our example. Reducing the monitoring period, or an increase in outage, will show a significant difference in the Availability Percentage.
Example 2:
For instance, the time period chosen for the availability report on July 1st is 30 days, i.e. 2592000000 ms (720 hours). The time period June 1st to June 30th will be taken for calculation. The number of monitors selected from the monitor group is 10. Consider that one monitor had a downtime of one day, and the total downtime is the sum of all downtimes. Hence, the total downtime is one day, which is 86400000 ms.
Total monitoring period = 10 * 2592000000 = 25920000000 ms (300 days)
When the maintenance period is included, uptime will be:
Uptime = 25920000000 - 86400000 = 25833600000 ms (299 days)
Availability Percentage = (25833600000 / 25920000000) * 100 = 99.67%
When the maintenance period is not included, uptime will be: Consider the maintenance period here is one hour, which is 3600000 ms
Uptime = 25920000000 - (86400000 + 3600000) = 25830000000 ms (298.96 days)
Availability Percentage = (25830000000 / 25920000000) * 100 = 99.65%
Example 3:
For instance, the time period chosen for the availability report on July 1st is Last 30 days in milliseconds, which is 2592000000 ms, or 720 hrs. The time period June 1st to June 30th will be considered for the calculation. The number of monitors selected from the monitor group is 10.
Consider that one monitor had a downtime of one day, and the Total Downtime is the sum of all downtimes. Hence, the Total Downtime is one day, which is 86400000 ms.
Additionally, let's consider that the monitor has a suspension period of 2 days, which is which is 172800000 ms. Now, the total suspended time will have to be deducted from the total monitoring period.
Total monitoring period = Monitoring period*Number of monitors selected from the monitor group - Total Suspended Time
Therefore, total monitoring period = 10 * 2592000000 = 25920000000 ms (300 days) - 172800000 ms (2 days) = 25747200000 ms (298 days)
Total Uptime = Total monitoring period - Total Downtime
Total Uptime = 25747200000 - 86400000 = 25660800000 (297 days)
Availability percentage = (Uptime/total monitoring period)*100
Availability percentage = (25660800000/25747200000)*100 = 99.66%
2. Total Outage Duration/Total Downtime:
The amount of time (in days, hours, and minutes) for the monitor has been unavailable for a given period of time.
For individual monitors:
The downtime of the monitor during the total monitoring period will be the total outage duration for that monitor.
For instance, consider that the monitor had two outages for the given period of 10 hours and 14 hours respectively. So the total outage duration will be one day.
Monitor Groups:
The sum of downtimes of all the selected monitors during the total monitoring period will be the total outage duration for that monitor group.
For instance, consider that in the monitor group there are 10 monitors. Each monitor had two outages for the given period of 10 hours and 8 hours respectively. The total outage duration for each monitor is 18 hours. Hence, the total outage duration for this Monitor Group in the report will be 180 hours (7 days, 12 hours).
3. Number of Outages:
The number of times the monitor became unavailable (Down) from an available status (Up).
For individual monitor:
The number of times the monitor became unavailable (Down) from an available status (Up/Trouble/Critical). For instance, consider that the monitor had two outages for the given period of 10 hours and 14 hours respectively. So the total number of outages will be two.
For Monitor Groups:
The sum of the number of times the monitors became unavailable (Down) from an available status, either Up/Trouble/Critical. For instance, consider that in a monitor group there are 10 monitors. Each monitor had two outages for the given period of 10 hours and 8 hours respectively. The number of outages for each monitor is two. Hence the total number of outages for the monitor group in this report will be 20.
4. Total Uptime:
Uptime is the time for which the monitor is available (Up) for the use of the end user. When maintenance period is included, uptime will be:
Uptime = Total monitoring period - Total Downtime.
When maintenance period is not included, uptime will be: Uptime = Total monitoring period - (Total Downtime + Maintenance period)
5. Mean Time To Repair (MTTR):
MTTR is the average time to repair a device or a system to acceptable operating conditions. The term can also refer to the time spent to restore a machine to operating condition after failure. This should be as low as possible.
MTTR = Actual Downtime / Number of Outages
6. Mean Time Between Failures (MTBF):
The average time for which a device or a system worked without any failure. The term can also mean the length of time a user can reasonably expect a device or system to work before facing an incapacitating fault. Ideally, this should be as high as possible.
MTBF = Actual Uptime / Number of Outages
For individual monitor:
For instance, the number of outage is one and the actual downtime is one day (86400000 ms).
Mean Time To Repair / MTTR = (86400000 / 1) = 86400000 ms (1 day)
Mean Time Between Failures / MTBF
When maintenance period is included: Actual Uptime is 29 days.(2505600000 ms)
MTBF = (2505600000 / 1) = 2505600000 ms (29 days)
When maintenance period is not included: Actual Uptime is 28 days. (2419200000 ms)
MTBF = (2419200000 / 1) = 2419200000 ms (28 days)
For Monitor Groups:
For instance, consider that there are 10 monitors in the group, each monitor has 10 outages each, so the total number of outages is 100. The total downtime is 10 days
(864000000 ms)
Mean Time To Repair / MTTR = (864000000 / 100) = 8640000 ms (2 hours, 24 minutes)
Mean Time Between Failures / MTBF
When maintenance period is included: Actual Uptime is 290 days (25056000000 ms)
MTBF = (25056000000 / 100) = 250560000ms (2 days, 21 hours, 36 minutes)
When maintenance period is not included: Consider maintenance period as 10 days. Actual Uptime is 280 days (24192000000 ms)
MTBF = (24192000000 / 100) = 241920000 ms (2 days, 19 hours, 12 minutes)
7. Total Suspended Time:
For individual monitor:
It is the sum of the individual time stamps when the monitor was suspended in a given time duration. For instance, if the monitor has been suspended twice for a duration of 30 minutes and 40 minutes each, then the total suspended time will be one hour, 10 minutes.
For Monitor Groups:
It is the sum of the total suspended time of individual monitors in the monitor group for a given time duration. For instance, consider that there are 10 monitors in the group, each monitor has been suspended twice for 30 minutes and 40 minutes each. Then, for each monitor, the total suspended time will be one hour, 10 minutes. For the monitor groups, it will be the sum of the suspended time of all the 10 monitors suspended time, which is 11 hours, 40 minutes.
8. Total Suspended Time Percentage:
It is the percentage of Total Suspended Time for a given period of time.
Total Suspended Time Percentage = (Total Suspended Time / Total Monitoring Period) * 100
For individual monitor:
For instance, if the total suspended time is 86400000 ms and the total monitoring period is 2592000000 ms, then
Total Suspended Time Percentage = (86400000 / 2592000000) * 100 = 3.33%
For Monitor Groups:
For instance, consider there are 10 monitors in a monitor group. Each monitor has a total suspended time of 86400000 ms. So, the total suspended time for the group is the sum of them, which is 864000000 ms, and the total monitoring period is 2592000000 ms.
Total Suspended Time Percentage = (864000000 / 2592000000) * 100 = 33.33%
9. Total Scheduled Maintenance:
For individual monitor:
It is a sum of the time period (in days, hours, and minutes) for which server, network, or website monitors were in maintenance state. For instance, if the monitor has been scheduled for maintenance twice for a duration of 30 minutes and 40 minutes each, then the total scheduled maintenance will be one hour, 10 minutes.
For Monitor Groups:
It is the sum of the individual monitor's total scheduled maintenance in the monitor group in a given time duration. For instance, consider there are 10 monitors in the group, each monitor has been scheduled for maintenance twice for 30 minutes and 40 minutes each. Then, for each monitor, the total Scheduled Maintenance time will be one hour, 10 minutes. For the monitor groups it will be summation of all 10 monitors scheduled maintenance time, which is 11 hours, 40 minutes.
10. Total Scheduled Maintenance Percentage:
Percentage of Total Scheduled Maintenance for a given period of time.
Total Scheduled Time Percentage = (Total Scheduled Maintenance Time / Total monitoring period) * 100
For individual monitor:
For instance, if the Total Scheduled Maintenance Time is 86400000 and the total monitoring period is 2592000000, then
Total Scheduled Maintenance Percentage = (86400000 / 2592000000) * 100 = 3.33%
For Monitor Groups:
For instance, consider that there are 10 monitors in the group, each monitor has a Total Scheduled Maintenance Time of 86400000 ms, so Total Scheduled Maintenance time for the group is sum of them which is 864000000 ms, and the total monitoring period is 2592000000, then
Total Scheduled Maintenance Percentage = (864000000 / 2592000000) * 100 = 33.33%
View related reports
Related video
-
On this page
- Generate Availability Summary Report
- Interpret Availability Summary Report
- Monitor Availability Summary
- Monitor Suspended Summary
- Availability Percentage Trend
- Downtime Report
- Overall Outage Details
- Location-wise Outage Details
- Monitor-wise Outage Details
- Configured Profiles
- Metrics in an Availability Summary report
- View related reports
- Related video
