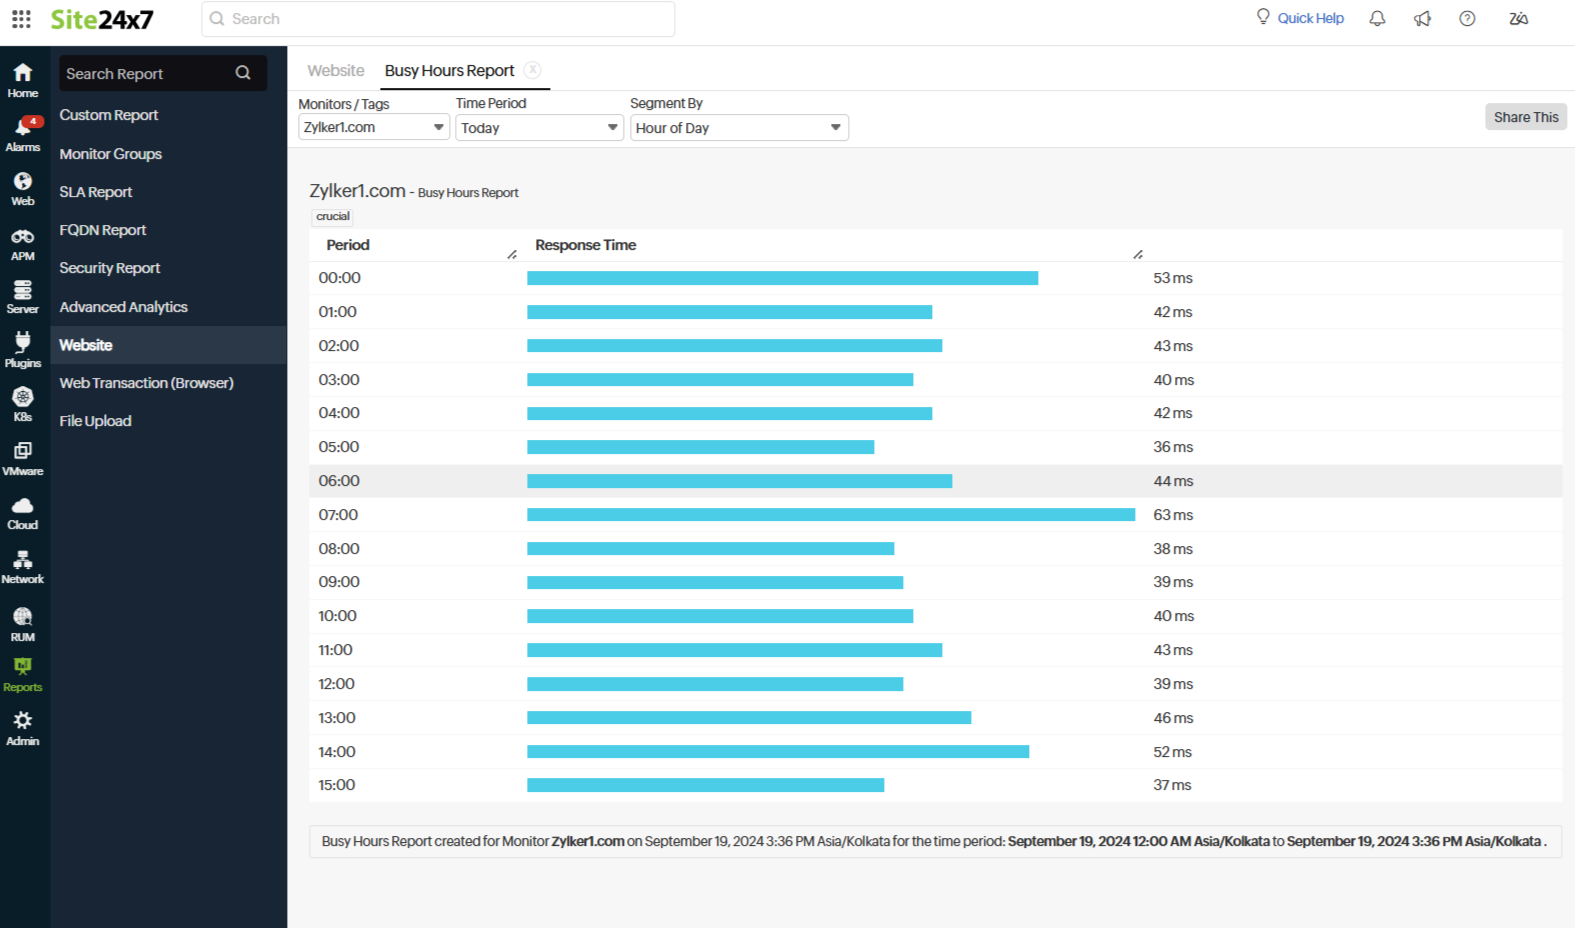
Busy Hours Report
Project the overall summary of the key performance indicators of multiple monitored resources using the Busy Hours Report. Track the busy hours either on an hourly or daily basis. Visualize a few vital metrics like the average response time, buffer cache hit ratio percentage of the SQL server, network traffic load, and CPU utilization with the Busy Hours Report.
These metrics provide insights into the timeline when the responses were slow due to network traffic during the busy hours. Meticulously track data by selecting a specific period and backtrack up to the previous month. The Busy Hours Report is vital for predictive analysis of resource availability.
Use cases
Gain different insights for different monitors to enhance productivity using the Busy Hours Report.
- For a configured SQL server monitor, an organization can track down the percentage of pages in the buffer pool that were not read from the disk using the Busy Hours Report. This way, the organization can enhance the efficacy of the database design and the queries.
- A website monitor's Busy Hours Report for an e-commerce website sheds light on the peak traffic hours, allowing the company to launch targeted promotions during these times to maximize visibility and engagement.
- An organization can analyze the tendency of network traffic with a server monitor's Busy Hours Report to optimize its IIS server.
- CPU performance is a critical parameter that can be tracked for all the configured monitors of servers, VMware devices, Amazon Relational Database Service, and Amazon Elastic Compute Cloud for a desired set of tasks for a specific time.
How to generate a Busy Hours Report
- Log in to Site24x7.
- From the left navigation menu, click Reports, select a monitor type from the list, and click Busy Hours Report.
- On the page that appears, fill out the following details:
- Monitors/Tags: Select any monitor or tag associated with the resource for which you need the Busy Hours Report.
- Time Period: Choose the time frame for the Busy Hours Report. You can choose the last 24 hours, today, last week, or up to last month, depending on your preference.
- Segment By: Narrow down the time frame to find the exact busy hour. You have two options to track the peak hour: by the time of the day or the day of the week.

How to share the report
Once the required report is generated, share it by clicking Share This. From the drop-down list that appears, select any of the following options:
- Publish Report: Create a permalink for the public to view without needing to log in.
- Export CSV: Export your report as a CSV file.
- Export PDF: Export your report as a PDF file.
- Email: Send the generated report via email to approved users who opted to receive emails from Site24x7.
- Schedule Report: Schedule the report to be sent to the necessary recipients periodically as a CSV or PDF file.
Related Documents
