Performance Report
By generating a Performance Report, it is easier to drill deep into the performance of your configured monitors from various monitoring locations. It can also help identify monitors with poor response time and take corrective measures whenever necessary. The average time taken by the monitors to respond to Site24x7 servers, over a specific time period is also captured in the report. Percentiles in Site24x7 can also be used to find outliers. The 95th percentile is the value which is greater than or equal to 95% of the observed values of your polled data during the selected time range. In other words, 95% of the responses were faster than this value. This option will be available when you've chosen All Monitors or Tag(s).
Generate Performance Report
- Log in to Site24x7.
- Navigate to Reports > Monitor Type > Performance Report.
Note
You can either generate a performance report for a selected monitor or a consolidated report for all the monitors.
- Select required Monitor/Tag from the header drop-down and change the listed parameters to view a customized report.
- Monitors/Tags: Select the desired monitor from the drop down list. You can also pick a Tag from the drop-down list. On selecting a specific tag, the report will be generated for all the monitors (of that specific monitor type).
- Time Period: Choose the required time period.
Note
You can generate reports for time periods ranging from last 1, 6, 12, 24 hours or upto a year back. Furthermore, you can also obtain reports for custom time periods.
- Unit of Time: Choose different unit of time for different time period.
Note
Learn more about granularity supported for each time period.
- Business Hours: Select the time period that is most critical to your business.
- Locations: Choose the relevant location or poller agent from the drop down list.
- Metric Aggregation: This option will only be shown when you've selected All Monitors or chosen a Tag(s).
- Once the report is generated, click "Share This" button on the top right corner.
- Publish Report: Click publish report and populate the form. This creates a permalink that would make the report accessible to customers without a login.
- Email: Share the report via an email. Email can be sent to only those verified users who have agreed to receive emails from Site24x7.
- Export CSV: Export the report as a CSV file.
- Export PDF: Export the report as a PDF file.
- Schedule Report: Populate the schedule report form, to create a report task that would trigger performance report mails to the customer.
Interpreting the Performance Report
Based on the type of monitor or tag selected, you can view and analyze the various performance trends of these selected monitors.
For an internet service monitor, like website, web page speed (browser), REST API, DNS, PORT, POP, mail server RTT, SMTP, PING, and FTP service and SOAP, a performance report can be generated for a pre-specified period. The information will be displayed in both graphical and tabular views.
In addition to the location-based response time data, you can also view the minimum, maximum, average, and 95th percentile response time values in the graphical view from a single dashboard and use it to optimize your resource performance. Now, let's take a look at the out-of-the-box metrics captured by Site24x7.
Synthetic monitors
When you choose to view the metrics of synthetic transaction monitors, like Webpage Speed (Browser), Web Transaction (Browser), and Synthetic Mobile Application, you can view the time taken to complete a transaction for each of your recorded steps in addition to the location-based response time and the average or 95th percentile response time metrics.
Attribute-level reports
Attributes are the components or basic units of a metric.
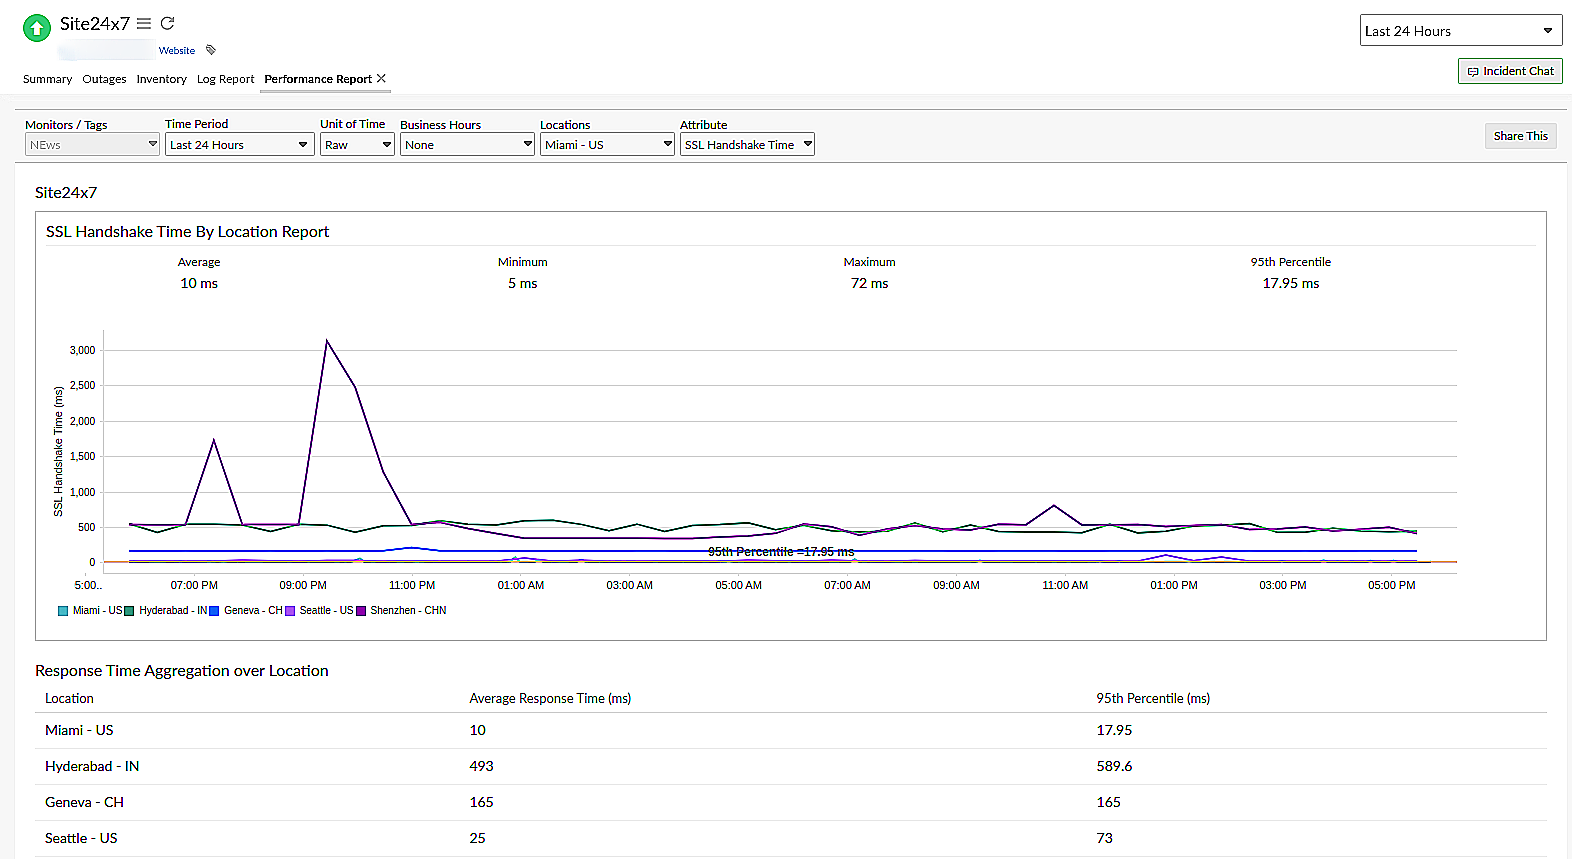 Figure 1: Attribute level report
- Website monitor
For a website monitor, the attributes will include:- DNS Time: Time taken by a domain name server to receive the request to obtain the IP address for a domain name, process it, and return the IP address to the browser.
- Connection Time: The time taken to raise the HTTP request and to receive the HTTP response.
- SSL Handshake Time: A secure sockets layer (SSL) handshake time is the time it takes for creating a safe and secure encrypted communication between the client and the server.
- First Byte Time: The time it takes for a browser to receive the first byte of response after raising a request to the server.
- Download Time: The difference between the last byte time and the first byte time.
- Web Page Speed (Browser) monitor
For this monitor type, the attributes will include:- Start Render: The time taken by a website or web app to load completely for the user to interact with the page.
- Page Load Time: The average amount of time it takes for a page to load on the screen fully.
- Document Complete: The time for the page to finish loading the entire content.
- Web Transaction (Browser) monitor
For this monitor type, the attributes will include:- Page Load Time: The average amount of time it takes for a page to load on the screen fully.
- Transaction Time: The response time of the entire transaction.
- Synthetic Mobile Application monitor
For this monitor type, the attributes will include:- Transaction Time: The total time taken to complete all the steps in a synthetic transaction from start to end of a transaction.
- Transaction Time By Location: The total duration taken to complete a transaction from each monitoring location.
- Average Transaction Time By Location: The mean time taken to complete transactions from each monitoring location over a selected time period.
Interpreting graphs
- Response Time graph
You can obtain detailed information on the response time of your configured monitor by hovering the cursor over the designated area in the graph. You can also view details including the DNS time, connection time, first byte time, and last byte time of your configured monitor by hovering the cursor over the designated area in the response time graph. To drill down and measure the metrics for a defined period, click and drag the cursor within the specified time slot on the graph. The response time graph has colored check boxes acting as indicators of each parameter. These indicators help you visualize the groups inside the chart. Furthermore, the indicators also act as quick filters and enable you to select the parameters in the graph based on your requirement. - Transaction Time graph
The Transaction Time graph gives you the time required to complete a transaction for your recorded steps. The graph is calculated by plotting the time period against the transaction time and allows you to zoom in and obtain more insights. Additionally, you can get metrics like location-based transaction time and average transaction time.
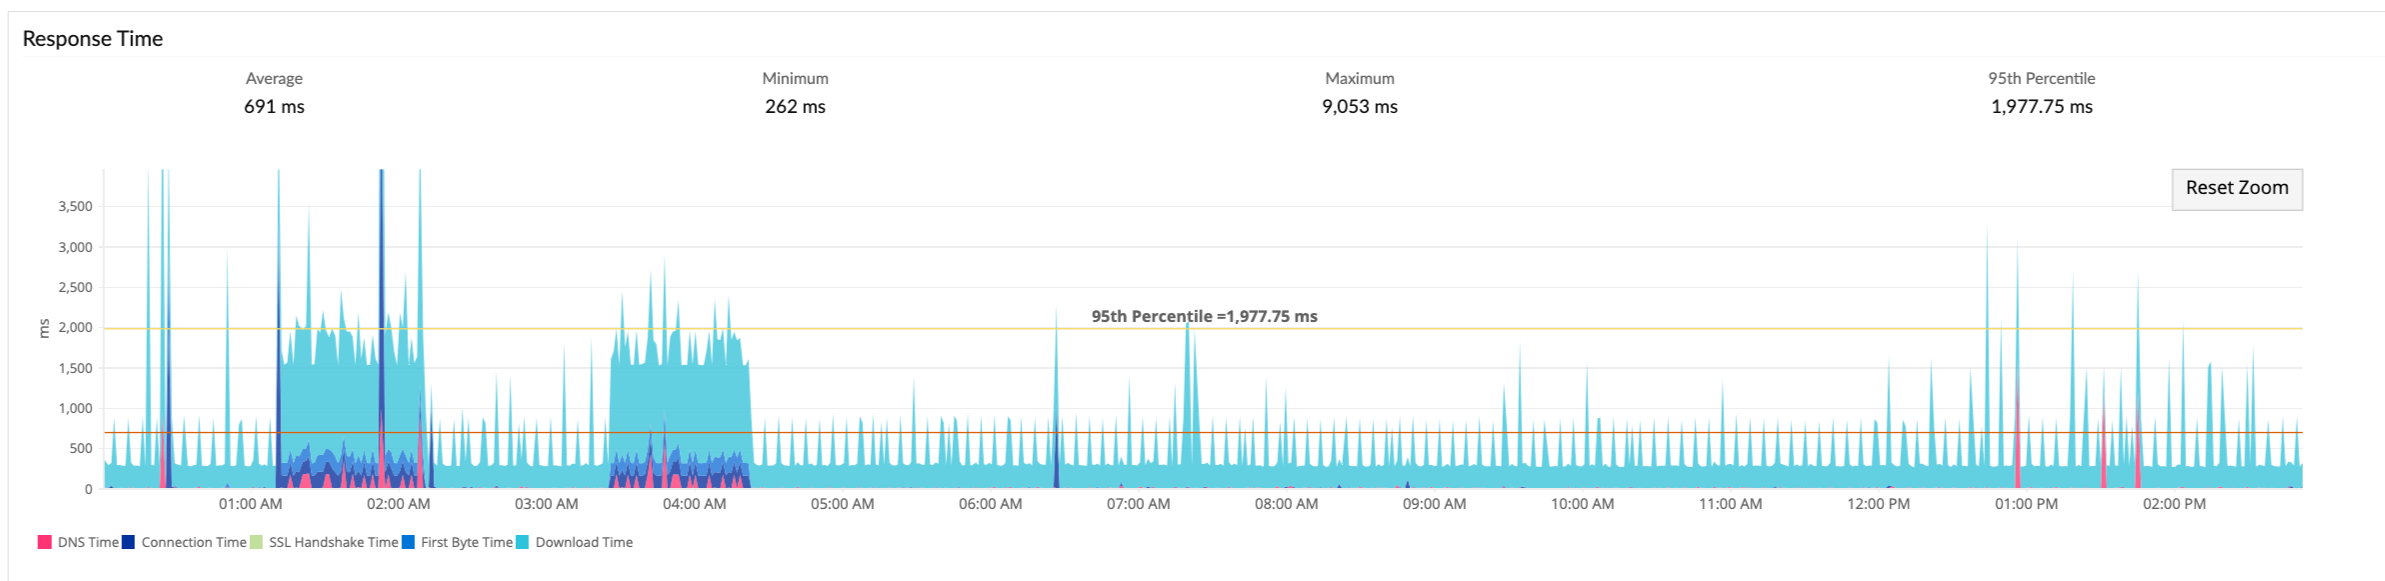 Figure 2: Response time graph
| Parameter | Description |
| Monitor Name - Server Monitor | |
| CPU Utilization (%) | The percentage of CPU used by the server |
| Memory Utilization (%) | The percentage of memory used by the server |
| Disk Utilization (%) | The percentage of disk space utilized by the server |
| Average CPU Usage (%) | The average percentage of CPU space used by the server |
| Monitor Name - MS Exchange Monitor | |
| RPC Response Time to Client Access | Time taken by the RPC (protocol) to contact Client Access Server |
| RPC Response time to Unified Messaging and Hub Transport | Shows the time taken by Mailbox server to contact Unified Messaging server and Hub Transport server |
| SMTP In/Out bound | Shows data related to the inbound and outbound SMTP messages |
| Outlook Web Access and Active Sync Response Time | Shows data related to HTTP access (Outlook Web Access) as well as time taken for the request |
| Access Failure | Messages failed while accessed by client access |
| Monitor Name - IIS Server | |
| Network Statistics (Kb/sec) | Tells us about the network traffic and bandwidth used by the IIS server |
| Average Traffic (Kb/sec) | The average traffic caused by the IIS server |
| Monitor Name - SQL Server | |
| Active connections | Number of active update connections for the database |
| Batch requests | Number of SQL batch requests received by server |
| Memory Utilization | Total amount of dynamic memory the server is currently consuming |
| Buffer Cache hit ratio | Percentage of pages that were found in the buffer pool without having to incur a read from disk |
| Plan cache hit ratio | Plan cache reads that were satisfied from the plan cache |
| Average cache hit (%) | Ratio between cache hits and lookups |
| Monitor Name - VMware ESX/ESXi and VMware VM | |
| CPU Usage (%) | The total CPU utilization across the system along with the average value in percentage |
| Average CPU Usage (%) | The average CPU utilization across the system along with the average value in percentage |
| Memory | The total memory utilized across the system along with the average value in percentage |
| Disk Usage | Disk usage of ESX/ESXi server along with the average value in kilobytes per second |
| Network | Network usage of ESX/ESXi server along with the average value in (kilobytes per second) |
| Monitor Name - Network Device Monitor | |
| Response Time (ms) | Shows the current response time of the network device |
| Packet loss (%) | Shows the packet loss percentage for the device on that day |
| Ping monitor - Packet Loss by Location | |
| Response Time (ms) | Shows the response time of the Ping monitor based on the selected location. |
| Response Time By Location (ms) | Shows the response time of the Ping monitor for all locations. |
| Packet Loss By Location (%) | Shows the packet loss percentage for the Ping monitor across all locations. |
| Response Time Aggregation over Location (ms) | Presents a tabular format showing each location's average response time and the 95th percentile. |
| Response Time | Shows the average response time based on the selected period. |
 Figure 3: Ping monitor - Packet Loss by Location
View related reports