Help VPN Monitoring

VPN Monitoring

VPN monitoring is the process of tracking different connections, paths, and tunnels using various performance metrics to ensure that your private network is safe from intruders. Proper monitoring ensures that the data transferred through your network is encrypted and the rate of transmission and receipt is optimal. Monitoring an ISP bandwidth usage to ensure VPN connectivity is also important. Site24x7 with its device templates and performance counters provides comprehensive monitoring to stay on top of your VPN.

In this doc, we'll cover:

Pre-requisites 

  • Site24x7 VPN Monitoring requires an On-Premise Poller to be installed in the network that is monitored. Both Windows and Linux flavours are supported.
  • The device should be SNMP supported.

System requirements

Number of devices/interfaces Processor RAM Hard disk
Upto 100 devices/1000 interfaces 4 processors 8GB 60GB or higher       
100-500 devices/1000 to 2500 interfaces        8 processors       16GB     

Different vendors support out-of-the-box

By default, Site24x7 supports common network security appliances like ZyXEL ZyWALL 35 and the Cisco ASA 5500 series. This includes vendors like:

  • Palo Alto Networks
  • Cisco
  • ZyXEL
  • Barracuda
  • TopSec
  • NetScreen Technologies
  • Check Point
  • Fortinet
  • Juniper Networks
  • Huawei

You can monitor the performance of any SNMP device from any vendor effectively using custom performance counters.

Setting up monitoring—Add your VPN device for monitoring

Follow the steps below to add a network device for monitoring:

  1. Log in to your Site24x7 account.
  2. Go to AdminInventoryAdd Monitor
  3. In the Add Monitor page, click Add VPN under Network.
  4. On-Premise Poller: The first step in adding a network device is to choose an On-Premise Poller. You can choose an On-Premise Poller from the list or install a new one. Click Next.
    Network module should be enabled in the On-Premise Poller that you choose. If not, enable it.
  5. Credentials:Credentials help Site24x7 communicate via SNMP and fetch data for monitoring. Choose proper credentials according to your SNMP version or add new credentials and choose them. Click Next.
  6. Details: Enter the following details and click Next.
    • Display name: Enter a display name to identify your device.
    • Device name/IP address: List your device's host name or IP address.
  7. Interface filters:Create a network discovery rule(while adding a device for the first time) or choose from the existing list of network discovery rules.
    • Name: A unique name to identify the rule with.
    • Interface type: Choose the type of interfaces from the drop down list.
    • Admin state: Define the admin state of the interfaces that are to be added for monitoring.
    • Operational state: Select the operational state of the interface for it should be added for monitoring.
    • Description: Define the nature of the discovery rule.
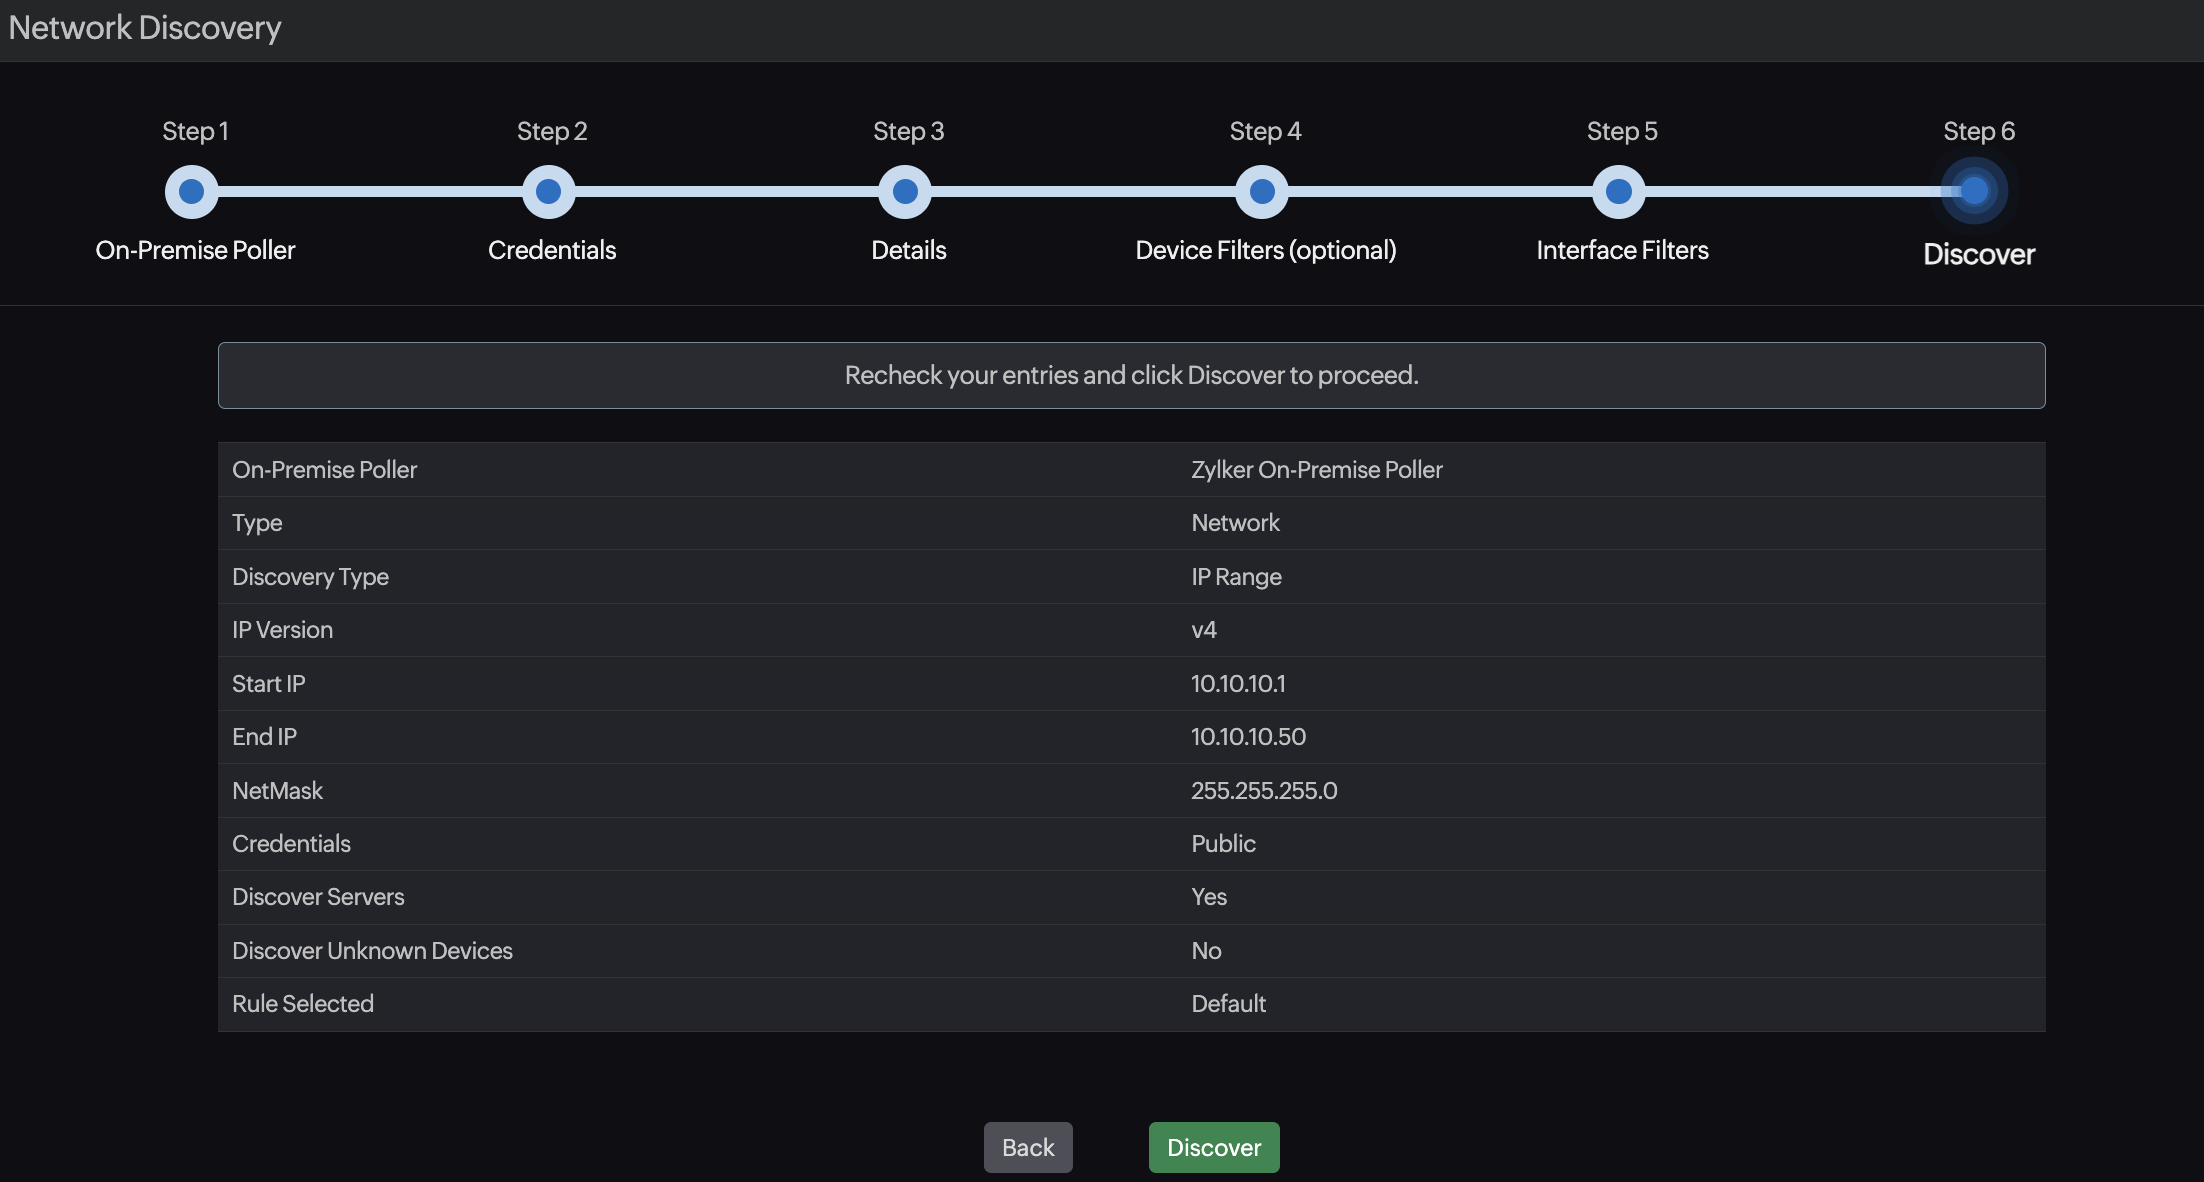
  8. Recheck your entries and click Discover.
Add the whole VPN for monitoring

Follow the steps below to add a network for monitoring:

  1. Follow the steps 1-5 above.
  2. Details: Enter the following details and click Next.
    • Discovery Mode: Add Network will automatically be selected.  
    • Discovery Type: Choose Use IP Range or Use CIDR.
    • Enter the following details to discover a network using an IP range:
      • IP type: Choose either IPv4 or IPv6.
      • Start IP: Enter the start IP.
      • End IP: Enter the end IP.
      • NetMask: Enter the NetMask. 
    • Enter the following details to discover a network using CIDR:
      • IP type: Choose either IPv4 or IPv6.
      • Start IP: Enter the start IP.
      • Mask Bit: Enter the Mask Bit.
  3. Filter Devices: Add filters to your discovery and click Next.
    • Discover Unknown: Toggle Yes to discover and monitor devices that do not respond to your SNMP credentials.
    • Discovery Action: Choose Add from the drop-down menu to include devices for discovery and choose Ignore to exclude them from discovery.
    • Type: Choose the type of filter from the drop-down menu. The type can be one of these—IP range, IP address, category, device type, or device name. 
    • Condition: Set the condition as equals or contains and enter corresponding values based on the type of filter you choose.
    • Click Add to add more filters.
  4. Follow step 7 given above to add interface filters
  5. Recheck your entries and click Discover.Network discovery
Network discovery usually takes around five minutes, but that figure depends on the size of the network. If the monitor isn't listed after completing these steps, follow these troubleshooting steps

Network devices tab

You can also add a network or a network device from the Network tab by clicking the Add icon icon near Network Devices.

Adding custom device templates

If default templates do not match your device requirements, you can create a custom template for your device based on your need. Navigate to Network > Device Templates. In the Device Templates screen, click Add Device Template, located at the top right corner of the screen and enter the following:

  1. Device Template: Provide a name to identify the template.
  2. Global Template: Toggle Yes if you wish to share your custom template across Site24x7 users.
  3. Vendor: Pick a vendor from the drop-down menu or add one by clicking '+'.
  4. Category: Choose the category to which the device belongs to.
  5. Device Identifier: Enter the System Object Identifier (SysOID).
  6. Performance Counters: To add custom performance counters, click the button. The performance counters can be either scalar, tabular, or you can also view them as a table.
    • Scalar Performance Counters: Add scalar performance counters by entering the values for SNMP OID, name, description, unit, type, and format value. You can either enter them manually or use the in-built MIB browser to do the same.
    • Tabular Performance Counters: Add tabular performance counters by entering the values for SNMP OID, name, description, unit, type, and format value. You can either enter them manually or use the in-built MIB browser to do the same. By selecting a table on the MIB, you can directly create a Table View which includes all the corresponding tabular performance counters.
    • Table View: A table view displays selected performance counters as a table. Provide a name, and choose the tabular performance counters that have to be displayed as individual columns in a table. You can also choose a table directly from the MIB and view it, here. Note that a table can contain at the maximum of nine columns while the rest will be added as individual tabular performance counters.
    • Show in Monitor Summary Page: Toggle yes to choose if the performance counter has to be displayed on the monitor summary page.
    • Click Add.

      VPN Custom performance counters

  7. Table View: View a consolidated table of tabular performance counters that you added to the table (while adding custom performance counters). You can create an all-new Table View from here if you haven't created one yet.
  8. Show in Monitor Summary Page: Double check your entries from the Add Performance Counters tab. You can also add more to your desired performance counters and tables, and view them on the monitor summary page.
  9. Click Save to save the custom template. Click Save and Associate to associate the template to a set of network devices.
You can also create custom device templates by editing default templates.

Adding custom performance counters

You can add custom performance counters while adding a device template or by editing a device template

You can also do this by navigating to the device's dashboard. To do this:

  1. Go to NetworkNetwork Devices.
  2. Click the name of the device.
  3. Go to the Performance Counters tab.
  4. Click Add Performance Counters.
  5. In the Add Performance Counters pop-up, click Add Custom Performance Counters in the bottom-right corner.
  6. This will direct you to the Edit Device Templates window.
  7. You can add your custom performance counters here by entering the SNMP OID, name, description, and unit.
  8. Save your changes. Click Save and Associate if you wish to associate this device template containing new performance counters, to a set of network devices.

Edit device template

Here is a video to demonstrate performance counters:


How to perform an ICMP Ping check to check the VPN availability

  1. Go to Network > Network Devices.
  2. Click the Hamburger icon icon next to a network device.
  3. Click Ping.

Setting threshold limits

Add thresholds to your devices to be immediately notified when any device goes down. The monitor’s status changes to ”Trouble or Critical” when the condition applied to any of the below threshold strategies hold true.

  1. Click Admin > Configuration Profiles > Threshold and Availability
  2. Click Add Threshold and Availability in Threshold and Availability screen
  3. Specify the following details for adding threshold and availability for a network device:
    • Monitor Type: Select Network Device from the drop down list
    • Display Name: Provide a label for identification purpose
  4. Device level attributes:
    • Mark the device as Trouble when an interface is Down / Trouble: Enable the toggle button to mark the device as Trouble when any one of the interfaces is Down / Trouble
    • Response Time: Get notified when the response time (in milliseconds) from the device crosses (>, <, =, >=, or <=) the configured threshold
    • Packet Loss: Get notified when the percentage of packets lost in communicating to the device crosses (>, <, =, >=, or <=) the configured threshold
  5. Interface level attributes: 
    • In Traffic: Get notified when the in traffic (in bps, Kbps, Mbps, Gbps, or Tbps) is <, <=, =, >, or >= the thresholds set.
    • Rx Utilization: Get notified when the receiving bandwidth utilization (in %) is <, <=, =, >, or >= the thresholds set.
    • Out Traffic: Get notified when the out traffic (in bps, Kbps, Mbps, Gbps, or Tbps) is <, <=, =, >, or >= the thresholds set.
    • Tx Utilization: Get notified when the transmitting bandwidth utilization (in %) is <, <=, =, >, or >= the thresholds set.
    • Error Rate: Get notified when the error rate (in %) is <, <=, =, >, or >= the thresholds set.
    • Discard Rate: Get notified when the discard rate (in %) is <, <=, =, >, or >= the thresholds set.
  6. Click Save.

Setting thresholds for interfaces and performance counters

You can also set thresholds and receive alerts for interfaces and performance counters.

  1. Go to Network > Network Devices
  2. Click on the respective device name
  3. Navigate to the Interfaces tab in the device dashboard
  4. Click on the hamburger icon corresponding to the interface for which the threshold configuration has to be set
    Interface thresholds
  5. Click Edit Threshold Profile
  6. Fill the following fields in the pop up. You can set the condition as Critical or Trouble based on which you'll receive alerts for these thresholds.
    • Ignore Alert: By default, this is set No. You can select 'Yes' if you wish to ignore the alerts
    • In Traffic: Get notified when the in traffic (in bps, Kbps, Mbps, Gbps, or Tbps) is <, <=, =, >, or >= the set threshold
    • Rx Utilization: Get notified when the receiving bandwidth utilization (in %) is <, <=, =, >, or >= the set threshold
    • Out Traffic: Get notified when the out traffic (in bps, Kbps, Mbps, Gbps, or Tbps) is <, <=, >, or >= the set threshold
    • Tx Utilization: Get notified when the transmitting bandwidth utilization (in %) is <, <=, =, >,or >= the set threshold
    • Error Rate: Get notified when the error rate (in %) is <, <=, =, >, or >= the set threshold
    • Discard Rate: Get notified when the discard rate (in %) is <, <=, =, >, or >= the set threshold
    • Mark the device as Trouble when the interface is Down/Trouble: By default, this is set No. You can select 'Yes' if you wish to change the device status as trouble

      Edit interface thresholds
  7. Click Save.

SNMP traps

SNMP devices can be configured to send traps to Site24x7. This is the best way to monitor the VPN tunnel flaps. When configured, the devices send traps to Site24x7, and Site24x7 instantly processes and sends messages to network admins so they can take instant corrective measures.

Configuring SNMP traps

Site24x7 On-Premise Poller listens to traps from network devices via port UDP 162.

Please follow the below steps to configure your device to send SNMP traps to Site24x7 On-Premise Poller. This can be done in your device either by using a GUI or CLI.

  1. Ensure that SNMP is enabled and then enable traps in your network device.
  2. Set the trap destination host address as the IP address or the host name of the respective On-Premise Poller.
  3. Set the trap destination port to be 162.
  4. Specify Community. You can specify any value for Community as Site24x7 On-Premise Poller doesn't validate traps.
  5. Save the configuration.

Now your network device should start sending traps to Site24x7 On-Premise Poller. You can also test if your On-Premise Poller is receiving these traps.

Click Network on the left panel, and select Trap Processors.
Here, you can view the list of natively supported traps as well as add new, edit, and delete traps.

Adding trap processors

You can create and configure trap processors from the Trap Processors view.

  1. Log in to Site24x7.
  2. Navigate to NetworkTrap Processors.
  3. Click Add Trap Processor(outlined in red in Figure 1 above) and enter the following:
    • Name: Enter a name to identify your trap.
    • Description: Enter a description to define your trap.
    • SNMP version: Select your device's SNMP version (v1 or v2c/v3).
    • Generic type/trap OID: For SNMP v1, enter the generic type. These are generic trap types generated by SNMP v1 agents and defined by SNMP. If your SNMP version is v2c/v3, then enter your trap OID. Trap OIDs are object identifiers that identify which type of trap is being received. 
    • Specific type: When you choose enterpriseSpecific(6) as the generic type, you can enter the specific type.
    • Source: Enter the IP from which Site24x7 should receive traps. It can either be the source IP of the device or the agent that generates traps. This option is useful if the trap is forwarded from another source.
    • Severity: Select one of the following options from the drop-down list—ClearDown, or Trouble. You need to specify the threshold and rearm criteria when you select Down or Trouble
    • Daily limit: Choose from the drop-down menu the total number of traps that Site24x7 should process per day.
  4. Click Save.

Add trap processor

Added trap processors can be viewed in the SNMP Traps view, along with their current statuses.

Threshold and rearm criteria

You can set multiple conditions for threshold and rearm criteria when you select Down or Trouble for the severity.

Threshold criteria:
Set the threshold criteria and receive a notification when that threshold is breached.

Rearm criteria:
Rearm criteria is the value that determines whether the monitor has been restored to normal condition. Rearm criteria corresponds to the value beyond which you can revert the Trouble/Down statuses to Clear.

Here is a video to demonstrate Site24x7's SNMP Trap Processing:

Trap alert mechanisms

You can configure trap alerts to notify you through email, SMS, phone call, or push notifications. You can also receive these notifications through integrated applications, including ManageEngine's Alarms One and ServiceDesk Plus, as well as third-party applications like Zapier, Slack, PagerDuty, and Microsoft Teams.

Follow the steps below to configufre alerts:

  1. Go to the Network tab and click on the desired device name. 
  2. Go to Traps tab. All your device-wise traps will be listed here. 
  3. Click on the hamburger icon under Actions and click Edit Threshold Profile
  4. Toggle Yes against Mark the device as Trouble when the trap's status is Trouble/Down.
  5. Click Save.

Trap alerts

How to automate incident remediation

Stay ahead of potential problems by creating an automation profile in advance to act on a known response triggered from your devices. You can configure incident remediation based on the thresholds set and automate them using different templates.

Your automation template can be a server script, server command, and more.

Creating custom dashboards

Obtain a clear picture of your VPN with all key and necessary metrics organized in a single view. Custom dashboards can help you to view all your key performance metrics as widgets in a dashboard. You can create a custom dashboard follwing the steps below.

  1. From the Site24x7 menu bar, go to Home > Dashboards > + Create New beside the title Custom Dashboards.
  2. Type the dashboard's title, or keep the default name. Add a brief description to communicate the purpose of the dashboard.
  3. Now build a chart or data widget by specifying the widget category, attributes and time parameters. The widget category, monitor configuration, and time period works together to determine what appears in your chart or data widget view.

    VPN Monitoring dashboard

Creating topology maps

Obtain a holistic view of your network with all devices arranged hierarchically. Choose a predefined map as the background or upload images of your choice and view your devices, their connections, and statuses at once.

  1. Navigate to NetworkTopologyMapsCreateNew.
  2. This opens the Map Editor view. Site24x7 aggregates and shows all the configured network devices in your Site24x7 account on the left pane of the editor screen. You can also search for a monitor using the search bar.
  3. You can change the background by clicking Change Background. There are multiple background templates to choose from, such as World MapsContinental MapsCountry Maps, and Gridlines. There is an additional option to import a custom background image by clicking Upload your image.
  4. Once you've set your background image, drag and drop the selected network device from the left pane onto the canvas. You can resize your monitor icon by selecting Large icons or Small icons from the drop-down list.
  5. Once you've added multiple monitors to the canvas, you can create interlinks by drawing lines between the mini-circles attached to every monitor icon.
  6. Provide a suitable Link name. Select which among the two devices' interfaces should be the link, and select an interface from the drop-down list. 
  7. Once you've drawn your topology map over the background image, click Done Customizing. Your map is now created and will be listed.
    Create topology maps

Here is a video to demonstrate network mapping with Site24x7:

Other types of VPN monitoring

Apart from adding a VPN for monitoring and adding a VPN device as a network device, you can also provides the flexibility to monitor using other types for non-SNMP devices.

Creating custom reports

Custom reports let you create personalized comparison reports for your business needs. You can compile precise metrics of your VPN monitor for specified time periods to generate a single easy-to-comprehend report. All required metrics are listed here for quick analysis and troubleshooting.

  1. Log in to Site24x7.
  2. Navigate to Reports > Custom Report.
  3. Click Create New Custom Report.
    Alternatively, you can also access the Create Custom Report button under any Monitor, Monitor Group, or SLA Reports tab.
  4. Provide the details below to customize your report:
    • Custom Report Name: Provide a name for the report.
    • Add Description: Add a brief description to summarize the comparison in the report. This will be useful to quickly identify the context of the report while sharing it with other users.
    • Monitor Types: Specify the types of monitors that you want to compare during a performance analysis. You can pick multiple or all monitor types that are configured in your account.
    • Attributes: Specify all the performance attributes relevant to your selected monitor types that you wish to compare during a trend analysis. The performance attribute is listed based on the monitor type that you've selected.
      For the Monitor Types: Website, REST API, and SOAP Web Service alone, you'll have an option to select the attributes, such as DNS Time, Connection Time, SSL Handshake Time, First Byte Time, and Download Time.
      Generate VPN reports
    • Monitors: Pick specific or all configured monitors to execute a quick performance comparison.
    • Bulk Period Selector: You can pick your desired time periods to generate the performance comparison report.
      You can bulk select up to five time periods. You can select time ranges that's hourly-based or even upto a year back. Additionally, you can specify custom period range by selecting date and time using a calendar view.
  5. Once all the parameters are inserted, click the Generate Report button to create the ad-hoc report in a tabular view.
    Generate custom report

Add users/contact and customize alert settings

Setup other users who can login to Site24x7, individually customize the way each contact interact with Site24x7 account and receive notifications about outages.

  1. Log in to Site24x7 web client.
  2. Click Admin > User and Alert Management > Users and Alerts. Click Add User in Users screen. 
  3. Specify the following details to Add User/Contact and Customize Alert Settings:
    • Contact Name: Enter the name of the user.
    • Job Title: Specify your job title, based on which monitoring recommendations would be populated and listed in Site24x7 Advisor. 
    • Email: Specify the email address of the contact. You must verify your email address to be able to receive Site24x7 alerts and reports on your alert contact email. 
      Even if you've a Super Admin role in your Site24x7 account, you'll still not be able to add a user to your Site24x7 account, until you have the Organization Account Admin rights. Learn more about User Roles and Privileges.

      If you're an Org Admin with Site24x7 super admin rights, you can add users (with the same email domain as yours) to your account.

      User management
    • Receive Voice Call and SMS Alerts:
    • Mobile Number: Choose the country code from the drop down list and enter the phone number of the contact. Alerts will be sent to this phone number via voice calls or SMSs.
      The phone number should be set up and verified to receive any alerts. To receive the verification SMS, you've to choose a required SMS or Voice Call provider from the available list of providers. After a number is verified, you'll be able to send Test SMSs and Voice Calls to that number. If you've shared your mobile number while signing up to Site24x7, you won't receive any alerts until you verify the mobile number. After verification, this number will be automatically treated as your primary number.

      Based on the alert configuration, user will receive SMSs via providers like BulkSMS, Clickatell, and Twilio. Voice Call based services are handled via Twilio. As part of our GDPR compliance, we've got into specific agreements with our sub-processors (all supported SMS and voice providers) to ensure they address the pressing needs of the current security and privacy trends.
    • Instant Message (IM): Configure your UP, Down or Trouble alerts using Google Hangouts. To register your Google IM with Site24x7, provide the following:
      • Click Configure IM Account to register and add an account.
      • Enter the IM ID in the IM Account field name.
        For example: zylker.admin@gmail.com
        User management
    • User Role: Select the desired role from the drop down list and provide the appropriate access permission for this contact.
      • Once the contact (outside Site24x7 organization) is added, he/she will receive an invitation from noreply@zohoaccounts.com to join the Site24x7 organization. The sub user needs to follow the instructions in the email to create an account.
      • A user having an account with another organization under Zoho, must delete his/her account from that organization first, to be able to accept the invitation from Site24x7 organization. Contact Site24x7 support for the same.
      • For each role, you can choose to allow the access permissions to all monitors or specific monitor groups.
      • Admin user has access permissions to all monitors.
      • To add a sub user to your account, you should have the organization admin privilege or the new user should be in the same organization.
      • Learn more about different user roles and their corresponding access permissions.
    • Associate to User Groups: Associate the user created to one of the user groups from the drop down list. If user group has not been created, see User Group.
    • Notify Medium: Mention the medium through which your contact wishes to receive the alerts. The different medium available for notifying are Email, SMS, Phone, and IM.
      User role and notification
  4. Alert Settings- Specify the following details to configure Alert Settings:
    • Down, Critical, Trouble, Up: Configure the preferred mode of alerting for Down, Critical, Trouble and Up alerts. Choose from different alerting mechanism viz Email, SMS, Phone, and IM.
      There is a cap of 500 alert emails per day to prevent your mailbox from flooding with alerts. However, this restriction is only for one day; it would be reset to the default value at midnight and you would start receiving the alert emails until it overshoots the set threshold of 500 emails the next day.

      You can always customize your notification mode of alerting by clicking on the preferred notification mode boxes. Incase you wish to learn more about the common "Alerts" related queries and solutions, read our Kbase articles on this topic.
    • AppLogs: Similarly, you can choose different modes like Email, SMS, Voice call, and IM to receive your AppLogs alerts.
    • Anomaly: Choose different modes like Email, SMS, Voice call, and IM to receive your anomaly alerts.
    • Alerting Period: You can move the slider to choose the time window for receiving SMS/Voice alerts. The option is not applicable for email or IM based alerts.
    • Don't Alert Me: Define the days of the week when you wouldn't want to receive SMS/Voice alerts. It is not applicable to email or IM based alerts.
      Although you'll not receive any SMS/Voice alerts during this period, you will still be able to view the performance log details in the web client.
    • Email Format: Choose the format of the alert email which you want to receive from Site24x7.

      User management alerts
  5. Click Save. The new user added will be automatically listed in Users screen along with other users already created.

How to analyze device alerts mails

A device down/or critical alert mail will be triggered with the device name and status as the subject, along with the location. The body of the mail contains the device IP, the primary reason for failure. With the details of the last poll, the alert mail conveys all that is required for a network admin to basically understand what has happened to a particular device and when.

This mail also provides charts on the performance report for the past 24 hours along with the availability summary report for the last three days. This is to understand, if that particular device was down or with some issue in the recent past.

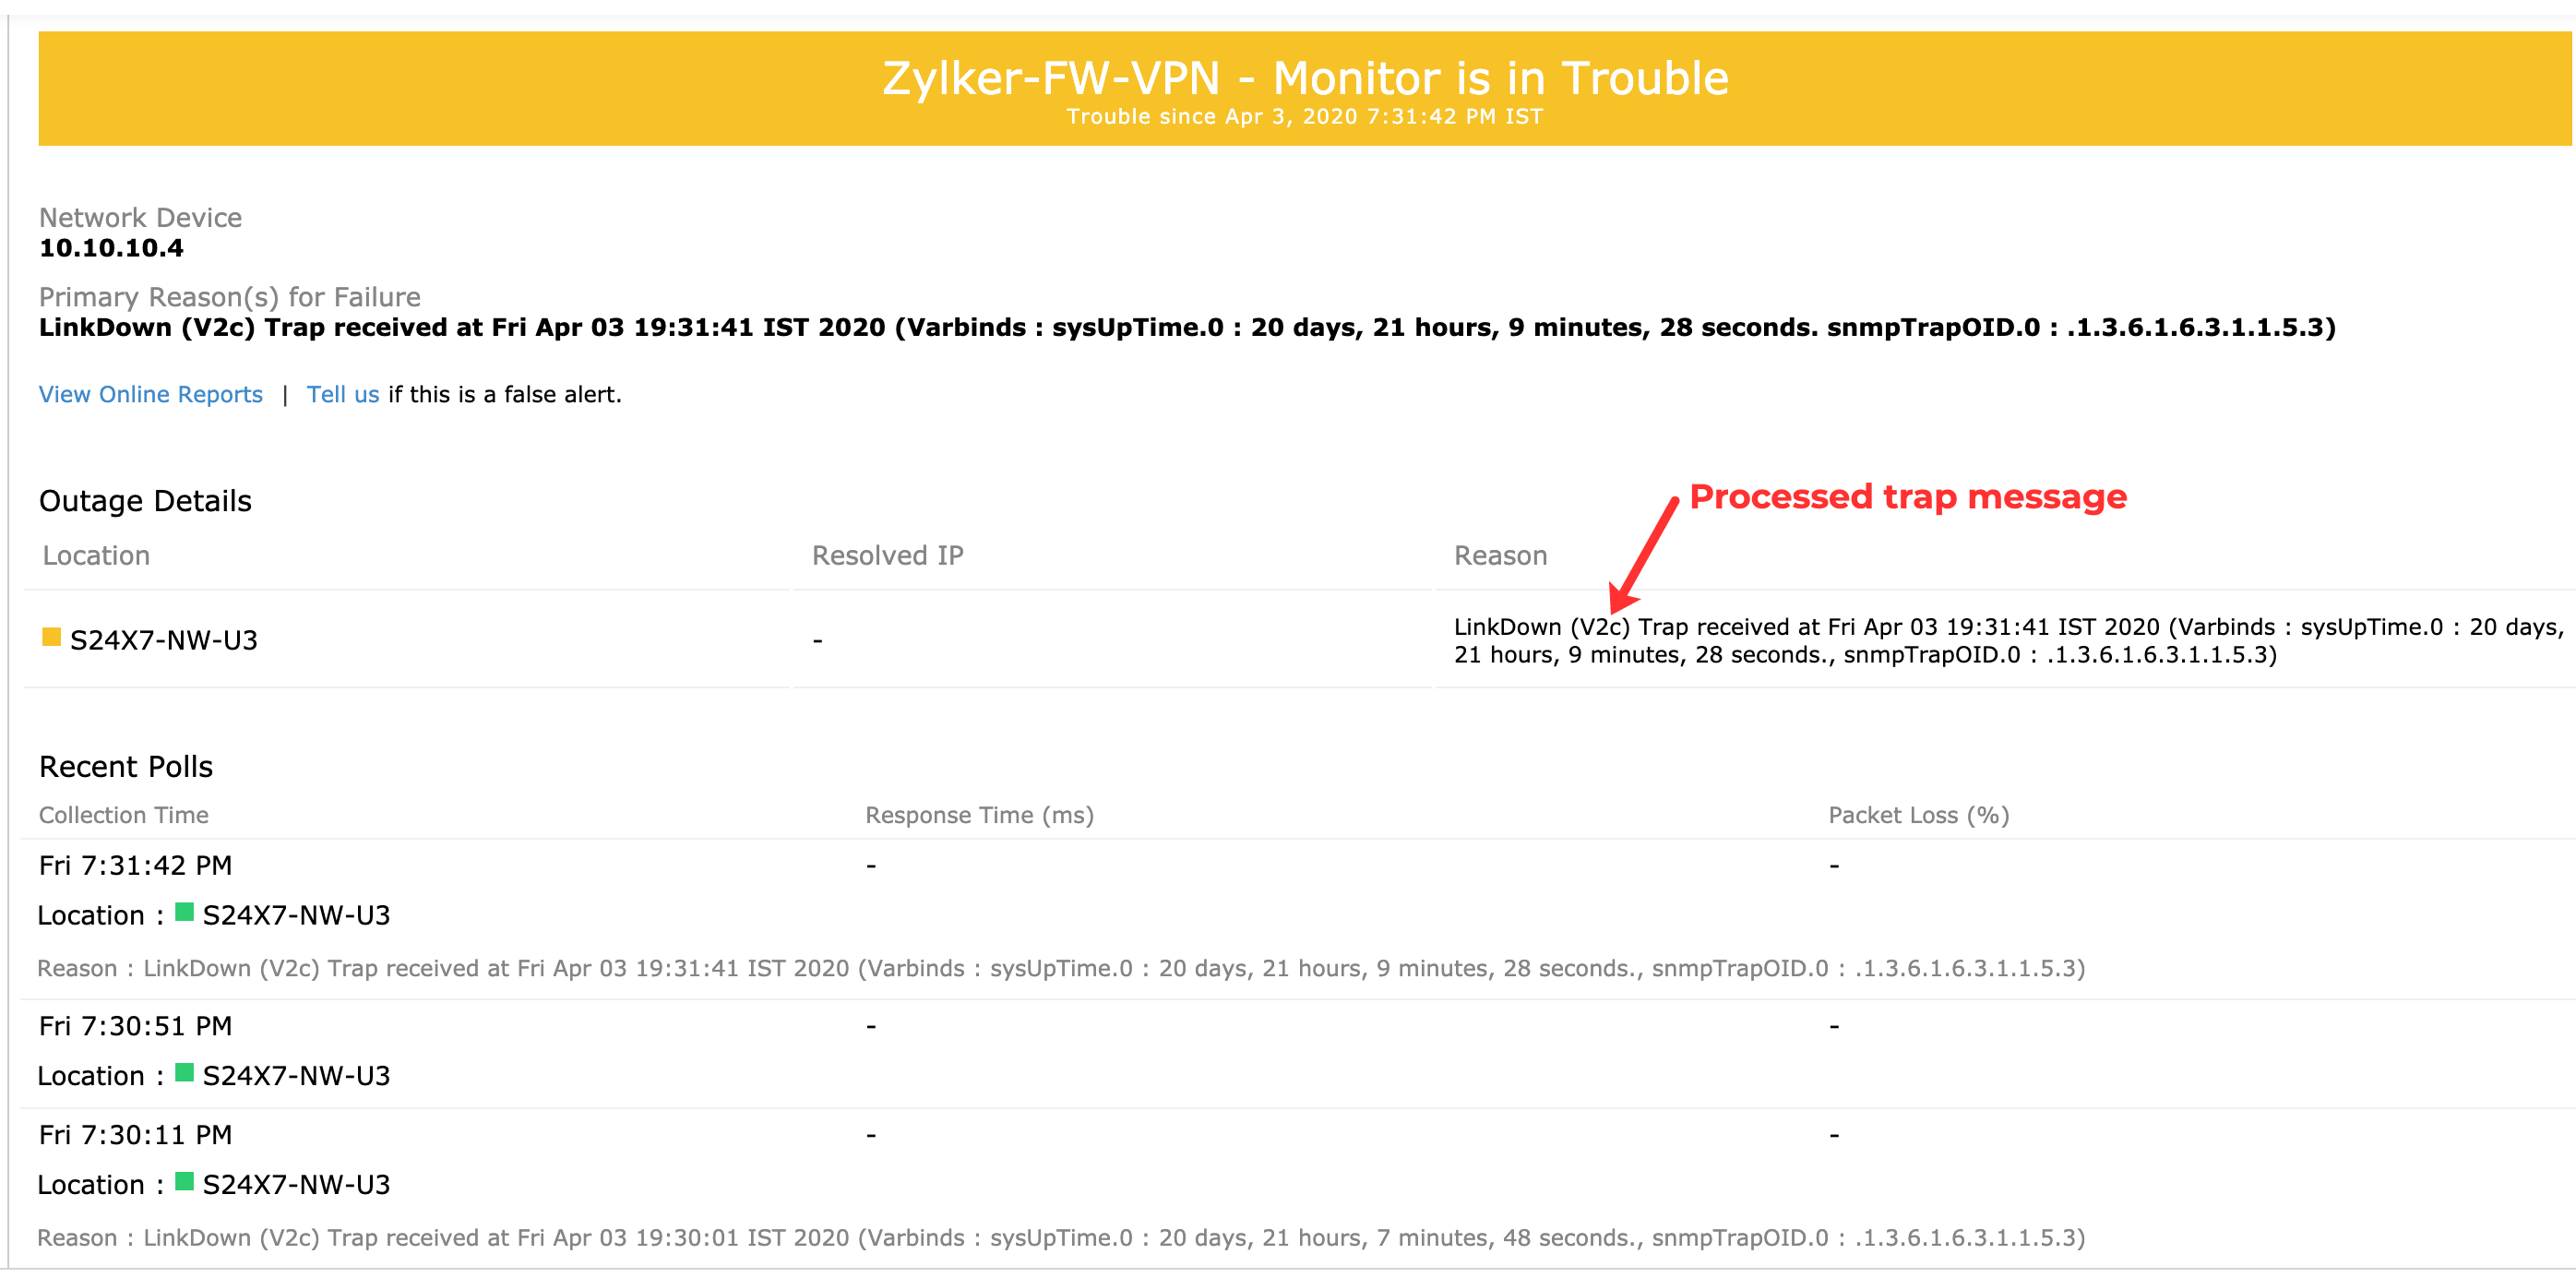
How to analyze trap alert mails

Trap notification mail

These are similar to device alert mails wherein the status—down or critical is decided based on the thresholds configured. This will also show the primary reason for failure with the processed trap message in the place existing threshold failure. Network admins can also analyze the availability summary report for the past three days.

One special aspect about these trap alert mails is that they also provide the recent five processed trap messages along for analysis and understanding.

Interpret custom reports

The custom report illustrates and renders the compared data in a tabular format. All the pre-selected performance attributes of your specified monitors will be listed in individual rows. You can view all the individual attribute values for selected time ranges listed under multiple columns against the monitor's & attribute's name. You can also add more monitor specific metrics for comparison. If you wish to share the report with a peer or customer, you can always generate a PDF of the report and share it with them. Click the Export PDF button to generate the PDF report. To delete the report altogether, just click Delete Report button listed on the top right corner.
Interpret report

Delete  a specific column icon can be used to delete a specific column or row from the report. 

  • Row deletion removes the attribute associated with the monitor
  • Column deletion removes the time period for all the monitors.

Click the Select bulk period icon on the top right corner, to modify your existing time selection or add more time period ranges to the report. Again, a maximum of five time periods can only be accommodated in the view.

In addition to the existing set of time span selections in Site24x7, an all new set of time periods have been introduced for the Custom Report. They range from:

  • Last 6 Hours (If time is currently 7 PM, it will return data from 1-7 PM)
  • Last 12 Hours
  • Last Hour
  • 2 Hours Ago (If time is currently 7 PM, it will return data for 4-5 PM)
  • 6 Hours Ago
  • 12 Hours Ago

You can also generate the reports for custom time ranges using Calendar View. You can select both the dates in a single shot along with time, i.e, select both start date with time and end date with time (Example - Apr-2-2017 11 AM - Apr-11-2017 10 PM can be selected.)
Custom calendar

Mobile app

Site24x7 mobile app is made to monitor resources on the go. The app provides real-time alerts on your mobile device when a performance problem occurs on your technology stack.

Download the iOS | Android apps to receive real-time alerts and push notifications, right on your device.

Troubleshooting tips

Was this document helpful?
Thanks for taking the time to share your feedback. We’ll use your feedback to improve our online help resources.

Help VPN Monitoring