SNMP Trap Processing
SNMP traps are generated when any event occurs within a device, including network and hardware issues. Site24x7 processes SNMP trap messages to detect issues quickly and send notifications to admins for faster troubleshooting and resolution.
What are SNMP traps?
An SNMP trap is an event message sent by a network device to a network management system (NMS) whenever a change of state or an anomaly is detected. An NMS like Site24x7 receives the event messages, or traps, generated by these devices. Site24x7 processes these traps, displays them in a listed view, and instantly sends you a notification based on the thresholds configured for different traps.
SNMP v1 traps
Basic SNMP v1 traps generally fall into two broad categories: generic and enterprise traps.
There are six types of generic traps:
- coldStart: The sending entity has been reinitialized and has a configuration change. In simple terms, the SNMP device has powered on.
- warmStart: Similar to coldStart, but the configuration remains unaltered because the device is already on. In simple terms, the SNMP device has reloaded the software.
- linkUp: One of the connected interfaces has changed states from down to up.
- linkDown: One of the connected interfaces has changed states from up to down.
- authenticationFailure: An SNMP agent received a request from an unrecognized community name.
- egpNeighborloss: The agent cannot communicate with its Exterior Gateway Protocol (EGP) peer.
- enterpriseSpecific: The agent sends vendor-specific error conditions or codes that only apply to the device or manufacturer.
SNMP v2c/v3 traps
SNMP v2c/v3 traps are classified based on the trap object identifiers (OID), as defined in the vendor's management information base (MIB). Trap OIDs are object identifiers that identify which type of trap is being received.
Configuring SNMP traps
You have to configure your device to send SNMP traps to Site24x7. Specify the IP and port for traps to be received via the User Datagram Protocol (UDP) port 162. You must ensure that this port is free and remains unblocked in your firewall settings at both the device and organization levels.
Enter the IP address of the On-Premise Poller used to monitor the desired device.
Viewing SNMP traps
To view all the received traps:
- Log in to your Site24x7 account.
- Navigate to Network > SNMP Traps.
Trap Processors view
Trap processors process the raw SNMP traps sent by network devices and display them as simple, understandable messages. You can view the list of natively supported traps in the Trap Processors view. You can also add new traps and edit or delete existing traps.
To navigate to the Trap Processors view:
- Log in to your Site24x7 account.
- Navigate to Network > SNMP Traps >Trap Processors.

Figure 1. The Trap Processors view. - Click a Trap Processor to view details like the Trap Processor Name, Description, SNMP Version, Trap OID, Generic Type (visible only for SNMP version v1 traps), Source, Severity, Failure Component, and Daily Limit.

Figure 2. After clicking a Trap Processor. - Click the pencil icon
 in the Action column to edit a Trap Processor. Here, you can edit the values for the following fields: Description, Trap OID, Generic Type (visible only for SNMP version v1 traps), Source, Severity, Failure Component, Custom Trap Message, Replace Monitor Alert Reason, Associate with All Devices, Threshold Criteria, Rearm Criteria, and Daily Limit.

Figure 3. Editing a Trap Processor.NoteView device-specific traps by clicking on a device name. You can access this from Network > Network Devices.
- Click the associate icon
 to associate the trap processor with devices and perform bulk actions like Activate, Suspend, Add, and Delete.

Figure 4. Associating a Trap Processor. - Click the trash icon
 to delete the Trap Processor.
Adding Trap Processors
You can create and configure Trap Processors from the Trap Processors view.
- Navigate to Network > SNMP Traps > Trap Processors.
- Click Add Trap Processor (Fig. 1) and enter the following:
- Trap Processor Name: Enter a name to identify your trap.
- Description: Enter a description to define your trap.
- SNMP Version: Select your device's SNMP version (v1 or v2c/v3).
- Trap OID: The OID for the selected trap will be displayed here. You can also edit it if required. If you select the SNMP Version as v2c/v3, then you have the option to add multiple trap OIDs in a single trap processor for viewing related traps. To do so, click the plus icon +.
- Generic Type: For SNMP v1, enter the generic type. These are generic trap types generated by SNMP v1 agents and defined by SNMP. If your SNMP version is v2c/v3, then enter your trap OID.
- Specific Type: When you choose enterpriseSpecific(6) as the generic type, you can enter your device manufacturer's custom trap type.
- Source: This option is useful if the trap is forwarded from another source. Since it is the IP from which Site24x7 receives traps, this option can either be the source IP of the device or the agent that generates traps. Choose $Source when the trap is directly sent to On-Premise Poller, and choose $Agent when it is forwarded.
- Severity: Select one of the options from the drop-down list: Clear, Trouble, Critical, or Down. If you select Trouble, Critical, or Down, you need to specify the threshold and rearm criteria.
- Failure Component: This option is useful if a single trap OID has multiple failure components. Variable bindings, or VarBinds, are alert data included in SNMP traps that will have information on the failed components (entities like CPU, Temperature, etc.). You can match the entity by appending the VarBind number in this field to generate separate alarms for the failed components. For instance, $Source_trapName_trap_$v5.
- Custom Trap Message: This option enables you to override the default trap message with custom content. You can include specific trap details by using placeholders such as @0 and @1 for VarBind keys and $0 and $1 for their corresponding values. For example, @2 is $2 will display as sensorName is 75°C.
- Replace Monitor Alert Reason: Enable this to update the monitor's alert reason with the custom trap message whenever this trap is triggered.
- Associate with All Devices: Select to associate the trap processor with all monitored devices, including those that will be added as a monitor in the future.
- Daily Limit: Site24x7 can process up to 500 traps per day. If you need to update the limit, contact our support team at support@site24x7.com.
- You can also directly import the traps from an MIB browser.
- Generic MIBs: These are available by default in Site24x7. Select the Vendor and MIB from the drop-down.

Figure 5. Adding Trap Processors with generic MIBs. - Custom MIBs: You can upload MIBs from your system and use them to add custom performance counters.
- On-Premise Poller: Selecting an On-Premise Poller will list all the MIBs inside the Poller-home/NetworkPlus/mibs folder. Select the On-Premise Poller that stores the MIB files you uploaded. If you select Recently Viewed, you'll see all the MIBs that were uploaded or recently used.
- MIB: Select an already uploaded MIB from the drop-down menu or click the plus icon + to select an option from the left pane and edit the values to add it as a new one.
In the Upload MIB screen, select a file and upload it from your computer. Next, select an On-Premise Poller where the MIB file will be saved. After this, click the checkbox to authorize Site24x7 to store the MIB in the On-Premise Poller. Make sure the MIB file size is less than 1MB. Then, click Upload.

Figure 6. Upload MIB screen.
- Generic MIBs: These are available by default in Site24x7. Select the Vendor and MIB from the drop-down.
- Click Save.
You can view added Trap Processors in the SNMP Traps view along with their current statuses.
Threshold and rearm criteria
You can set multiple conditions for threshold and rearm criteria when you select Down or Trouble for the severity.
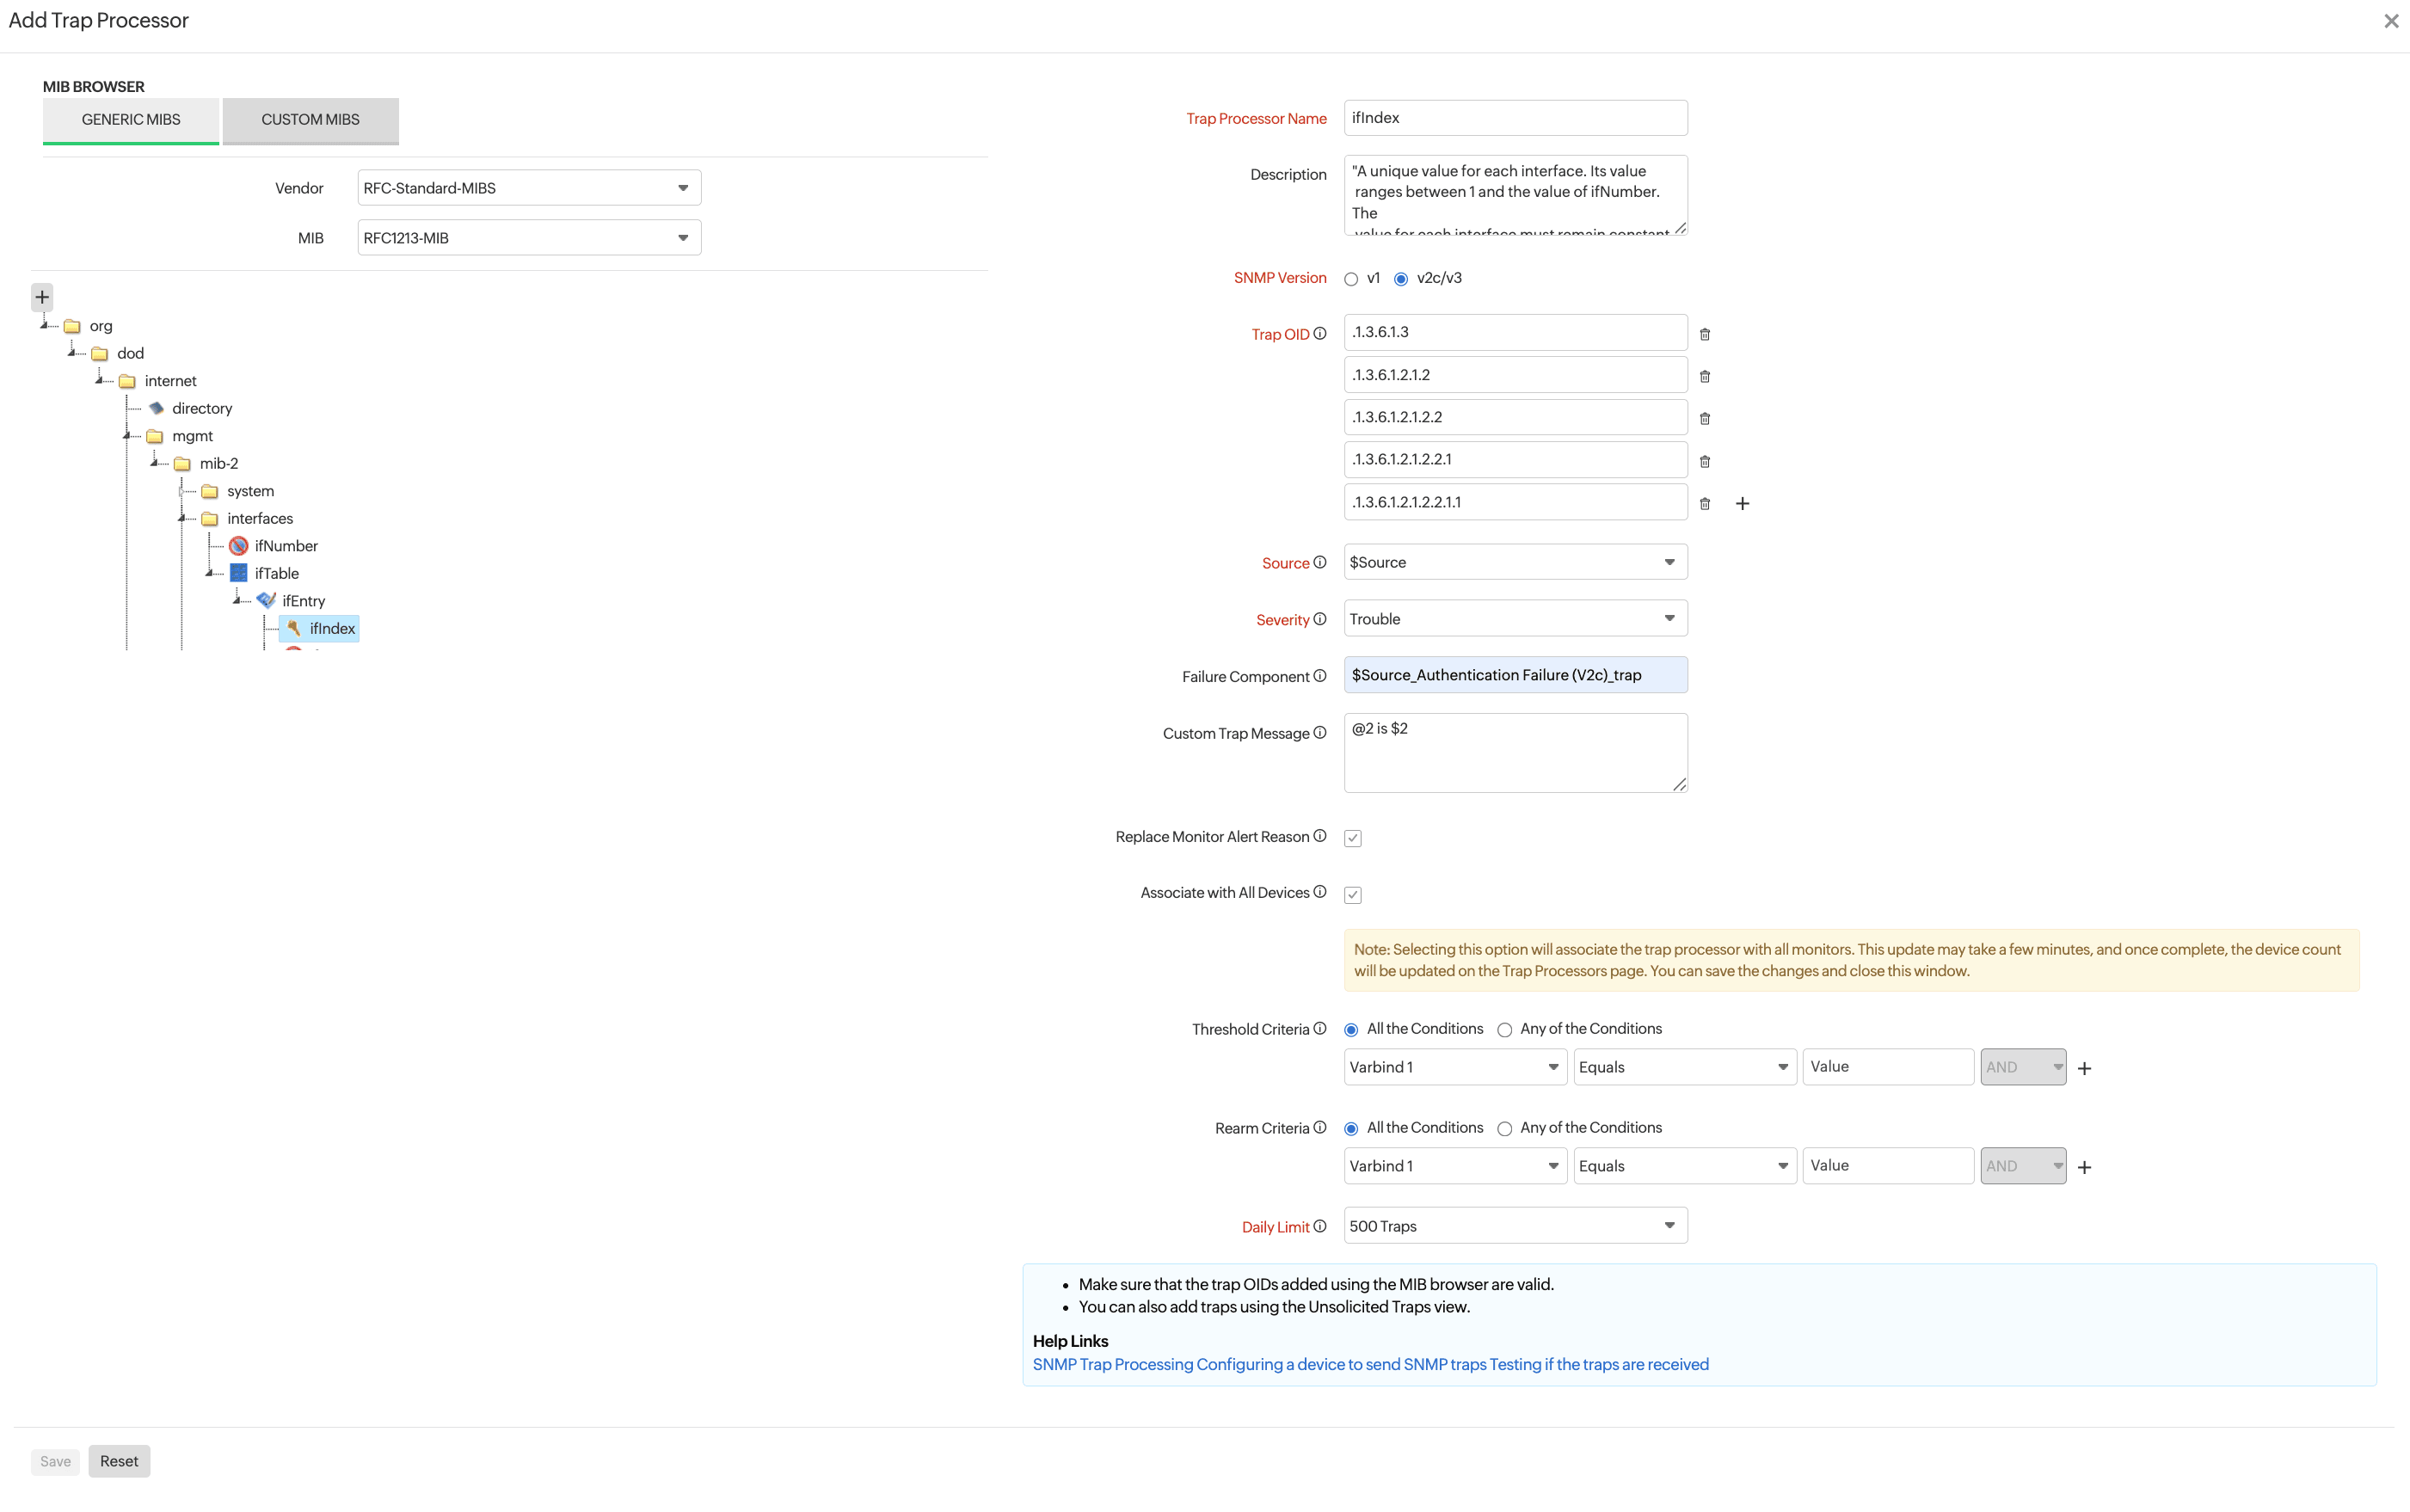
Figure 7. Setting threshold criteria and rearm criteria while adding Trap Processors.
Threshold criteria:
Set the threshold criteria and receive a notification when a threshold is breached.
Rearm criteria:
Rearm criteria is the value that determines whether the monitor has been restored to normal condition. When a condition's value crosses the Rearm value, Trouble or Down statuses change to Clear.
Example: Suppose the trouble threshold condition for a monitor is >65. If this value reaches 70, you'll receive an alert, and the monitor status will change to Trouble. Subsequently, when the value falls below the threshold—62, for instance—you'll receive an alert about the monitor returning to its normal state. For any subsequent threshold breaches or reverts, you'll keep receiving alerts.
To avoid all these alerts, you can enter a rearm value. By entering a rearm value (e.g., 50), you'll receive an alert only if the threshold reaches a value below the rearm value, as the monitor status will change to Clear if this condition is satisfied.
You can set multiple threshold conditions and select whether they're triggered by:
- All the conditions.
- Any of the conditions.
Each threshold condition is usually defined as VarBind, Condition, and Value (multiple conditions can be added with AND/OR options), with the following attributes:
- Varbind: Select a necessary VarBind. VarBinds denote the number of packets included in an SNMP packet of a received trap message. Each VarBind is identified by its OID, type, and value.
- Condition: Select any of the following conditions from the drop-down list: Equals, Not equals, Starts with, Contains, Doesn't contain, >, or << /strong>. You can also select Regular Expression to provide your own condition. Make sure you choose the appropriate numeric or string conditions based on the VarBind.
- Value: Enter the appropriate numeric or string value.
The SNMP Traps view
The configured and added Trap Processors are listed in the SNMP Traps view based on their current statuses: Down, Critical, Trouble, or Up. In this view, you can quickly see the count of total and active Trap Processors, as well as the number of Trap Processors remaining as per your license.
To view SNMP Traps:
- Navigate to Network > SNMP Traps.
- Select a trap to view details like the time of receipt and message.
- Click the thumbs up icon
 to acknowledge the trap.
For instance, in Figure 7, the LinkDown(v2c) trap is in trouble, which will affect the device's status. This trap is unlikely to occur after logging in to a device. Since there is no option to auto-resolve the alarm created by this trap, you can resolve it manually by acknowledging this trap. Once acknowledged, the device status will change to green if this was the only trap that was causing trouble.
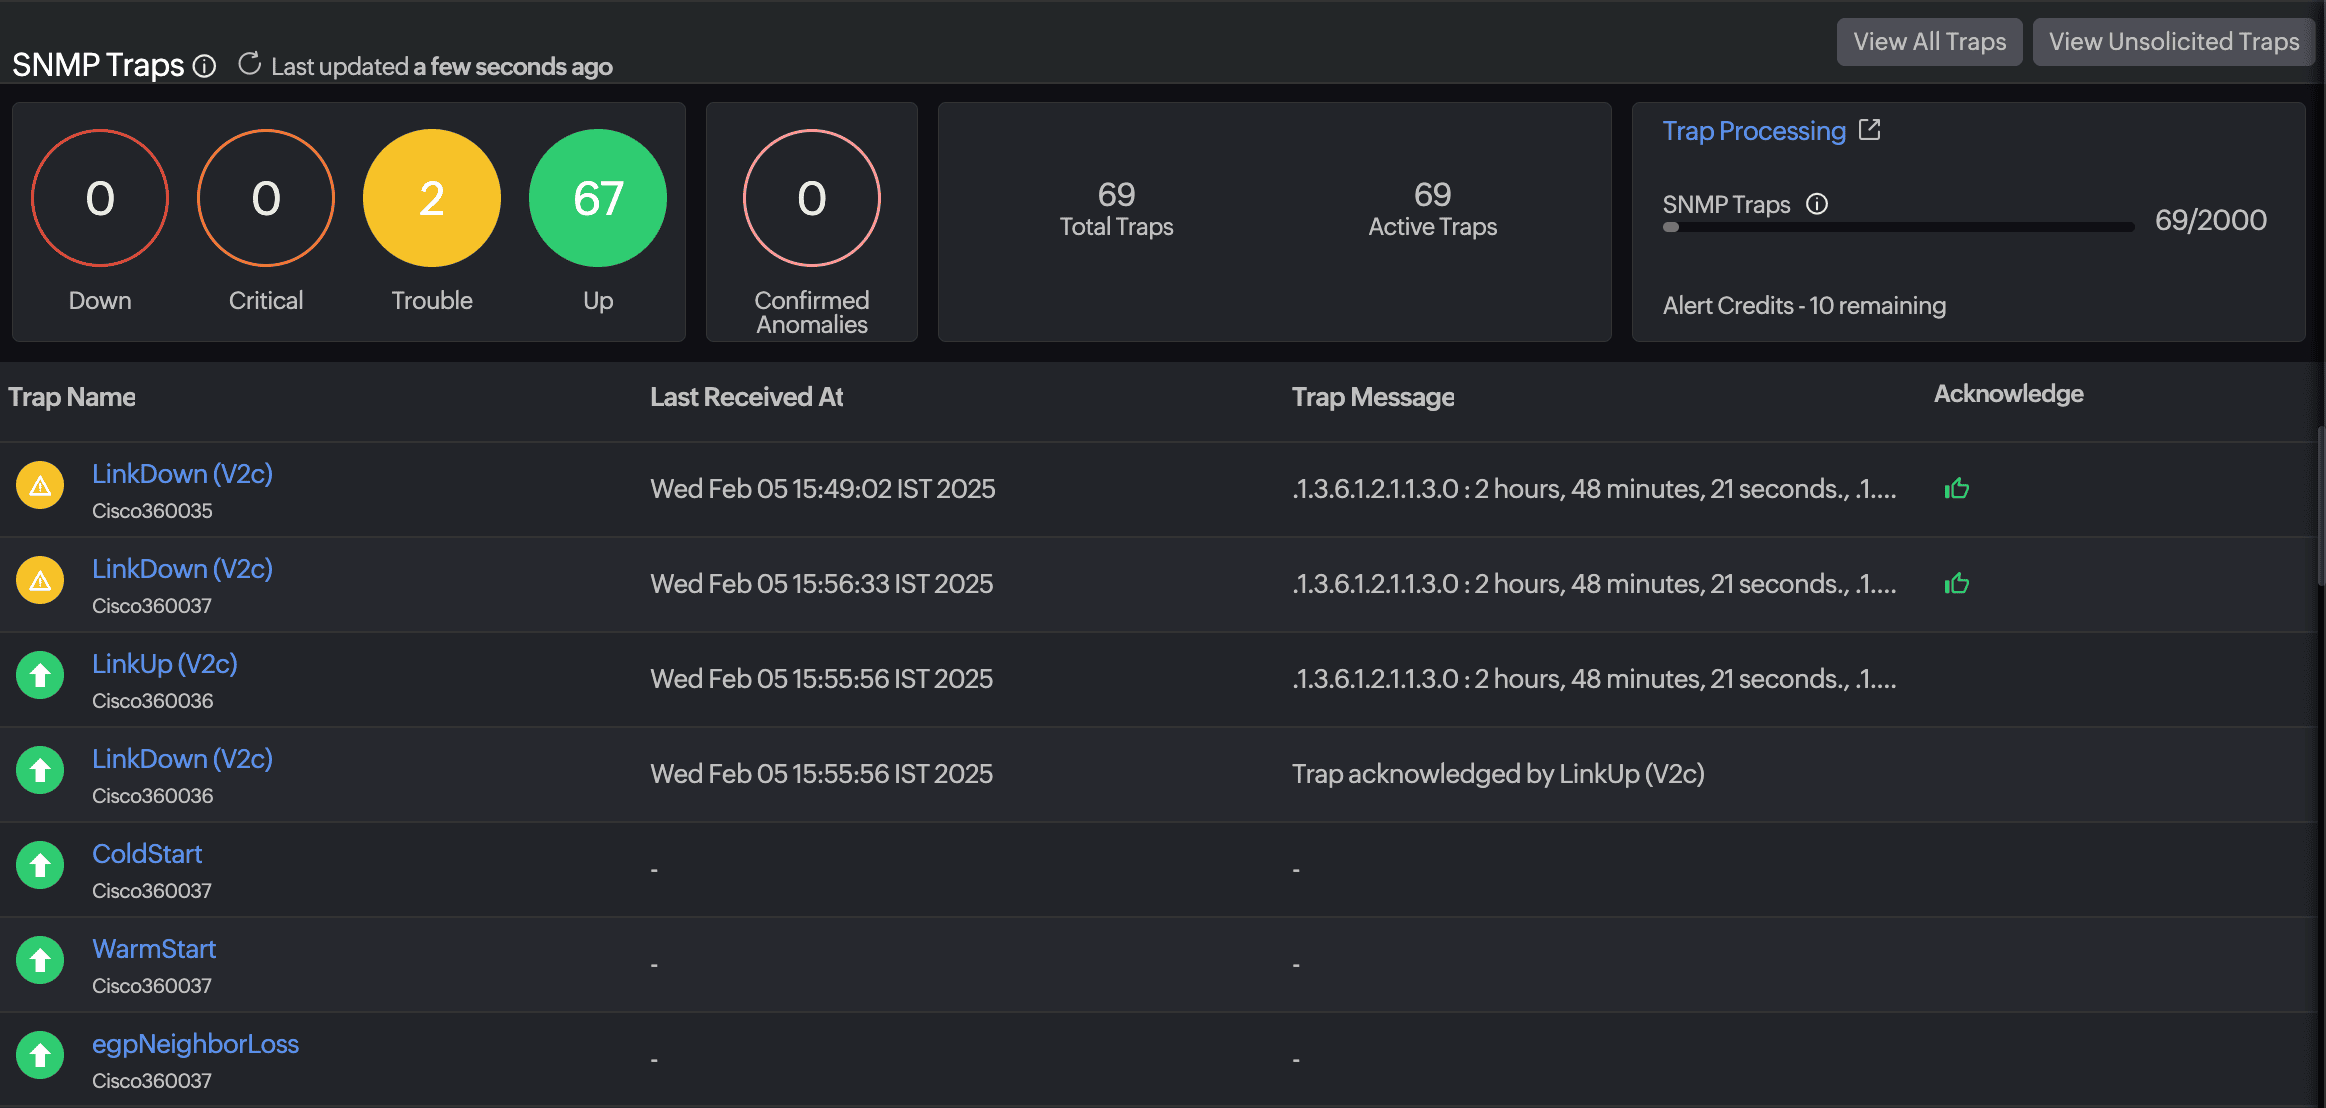 Figure 8. The SNMP Traps view.
Unsolicited Traps
Any SNMP trap that hasn't been configured for monitoring is collected and displayed in a list of unsolicited traps. These can be viewed and added from the SNMP Traps tab as shown in Figure 7.
You can add an SNMP trap by clicking the plus icon + and following the instructions described in the Adding Trap Processors guideline. While creating the Trap Processor, you can select the devices for which that trap has to be monitored. After this, you can view the data under the SNMP Traps tab.
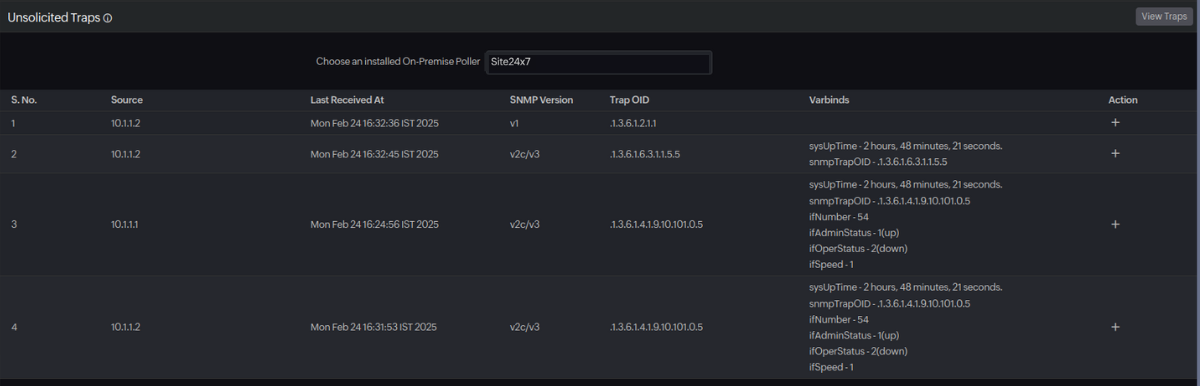
Figure 9. The Unsolicited Traps view.
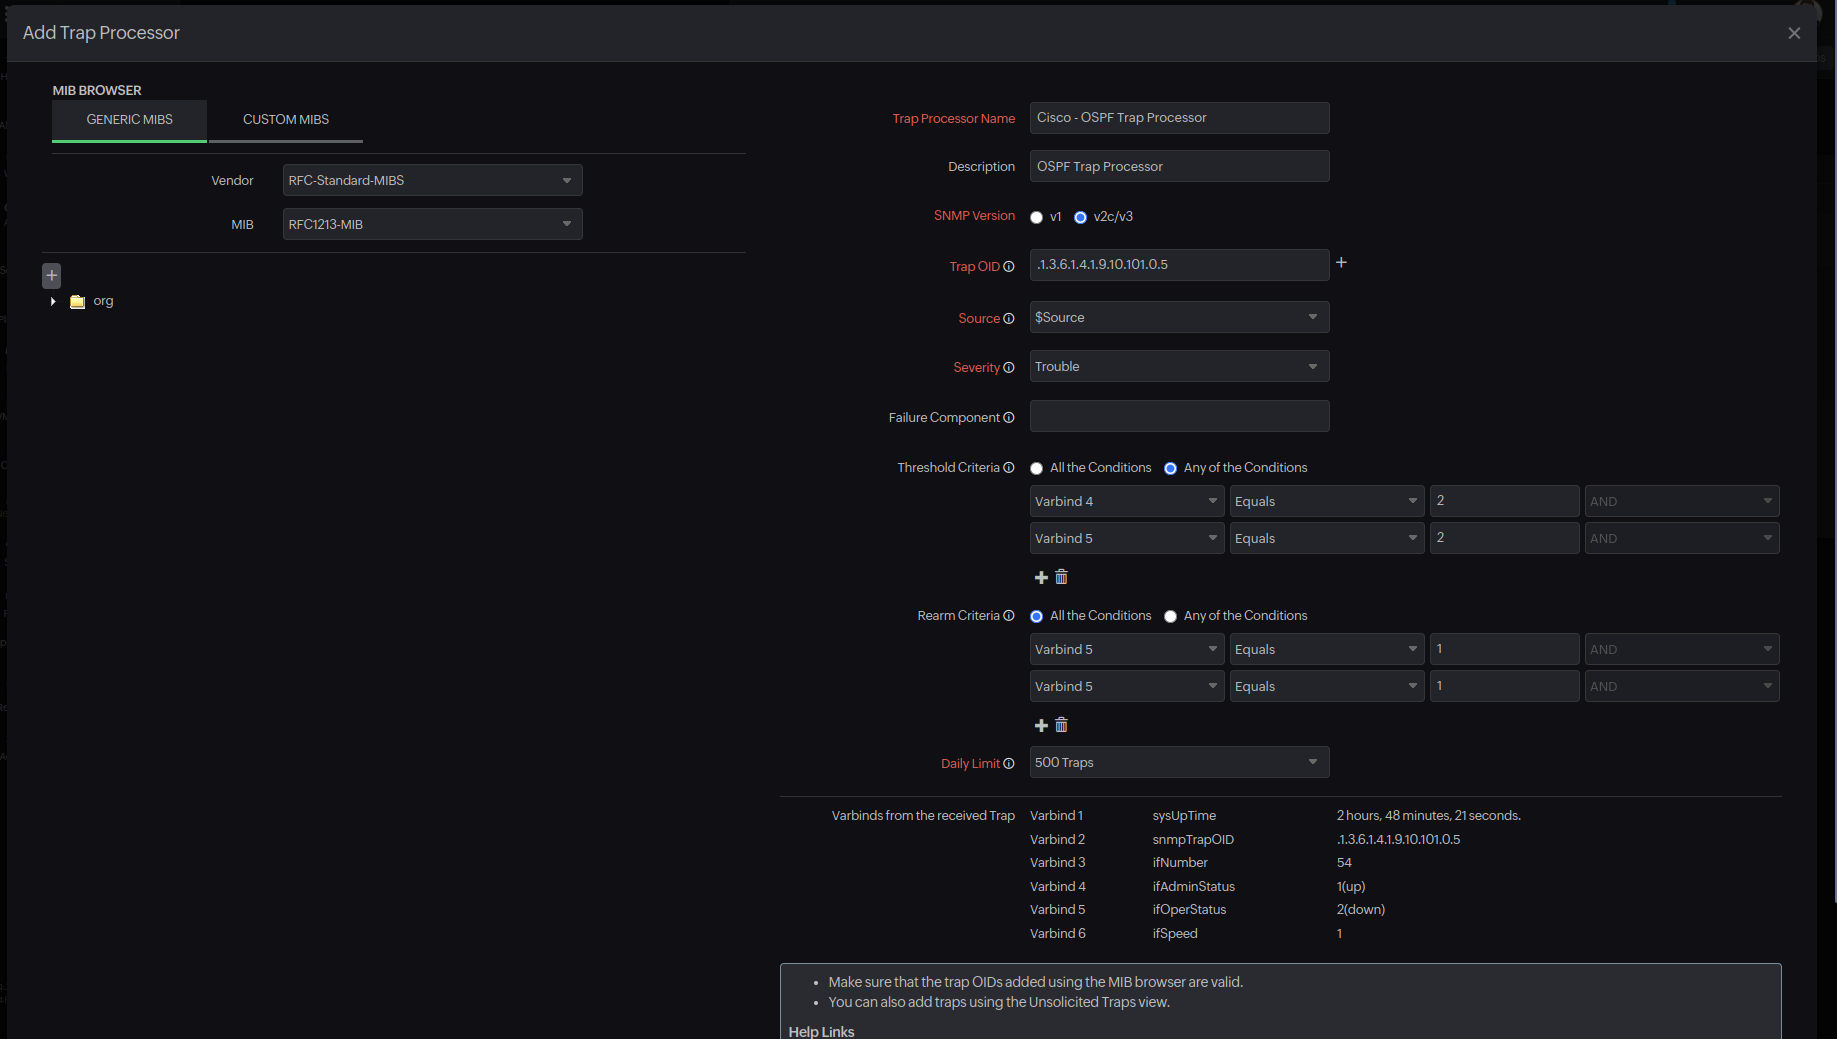
Figure 10. Adding an Unsolicited Trap.
Trap Settings page
The Trap Settings page gives you granular control over SNMP trap management for your network devices. While traps are automatically associated with all the added monitors to streamline initial setup, you can use this page to customize trap handling. This includes disabling trap monitoring for specific devices, restricting certain traps to critical devices only, and optimizing processing for performance or organizational needs. It also supports selective enablement based on device type or template. By default, newly added devices are included in existing trap rules, but you can override this behavior at any time on this page. Removing a device from trap associations means it will no longer receive or process those traps in Site24x7.
Editing and deleting Trap Processors
All the added Trap Processors are listed in the Trap Processors view. You can edit and delete them by clicking the pencil icon ![]() or trash bin icon
or trash bin icon![]() , respectively.
, respectively.
Device-wise traps
To view the device-specific traps:
- Navigate to Network > Network Devices.
- Click the device name, then navigate to the Traps tab to view device-specific traps. Here, you can view the Trap Name, Message, time of receipt (Last Received At), and Status.
- Click the hamburger icon
 to edit threshold conditions (Figure 11).
 - On the top-right of the table, click:
- The Trap Processor button to view the list of available trap processors.
- The Add Traps button to associate a trap processor with a device.
- The Bulk Action button to suspend or delete trap processors in bulk from a device.
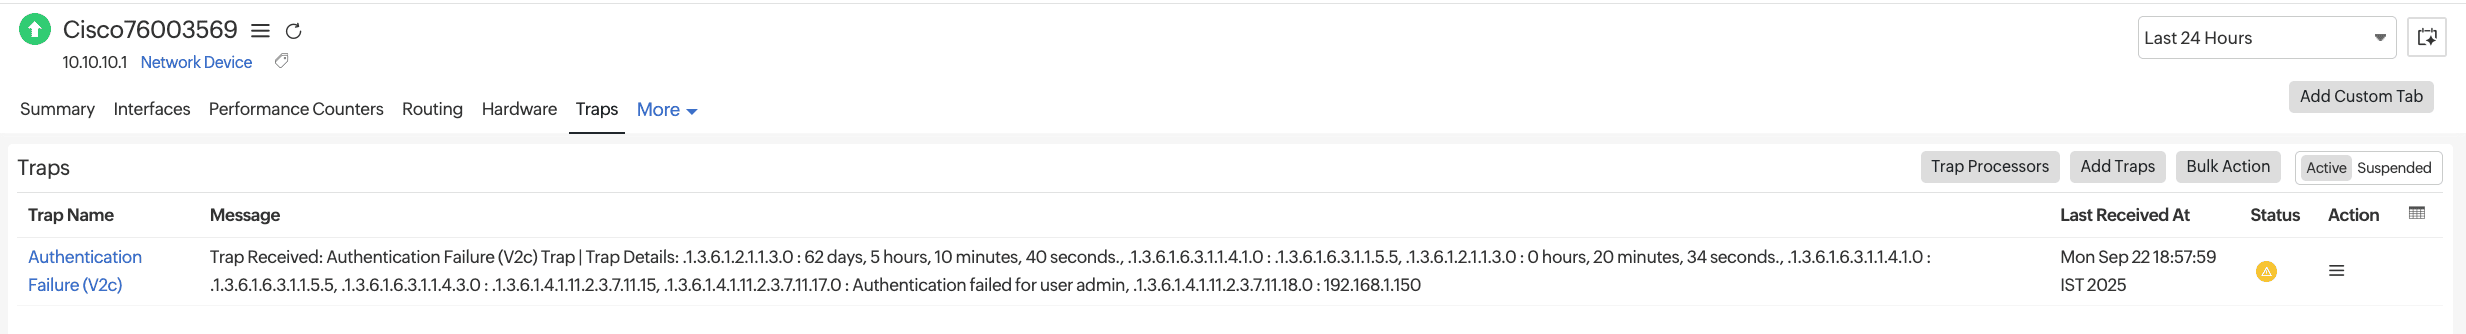
Figure 11. Device-specific traps.Note
The device status gets updated depending on the trap status. If the trap status shows Trouble, then the device status also changes to Trouble. If the trap status is Critical or Down, the device status changes to Critical. If there are multiple traps with differing statuses, the most severe status is used for updating the device status. For instance, in Figure 8, since one trap is in trouble, the device status will be updated to Trouble.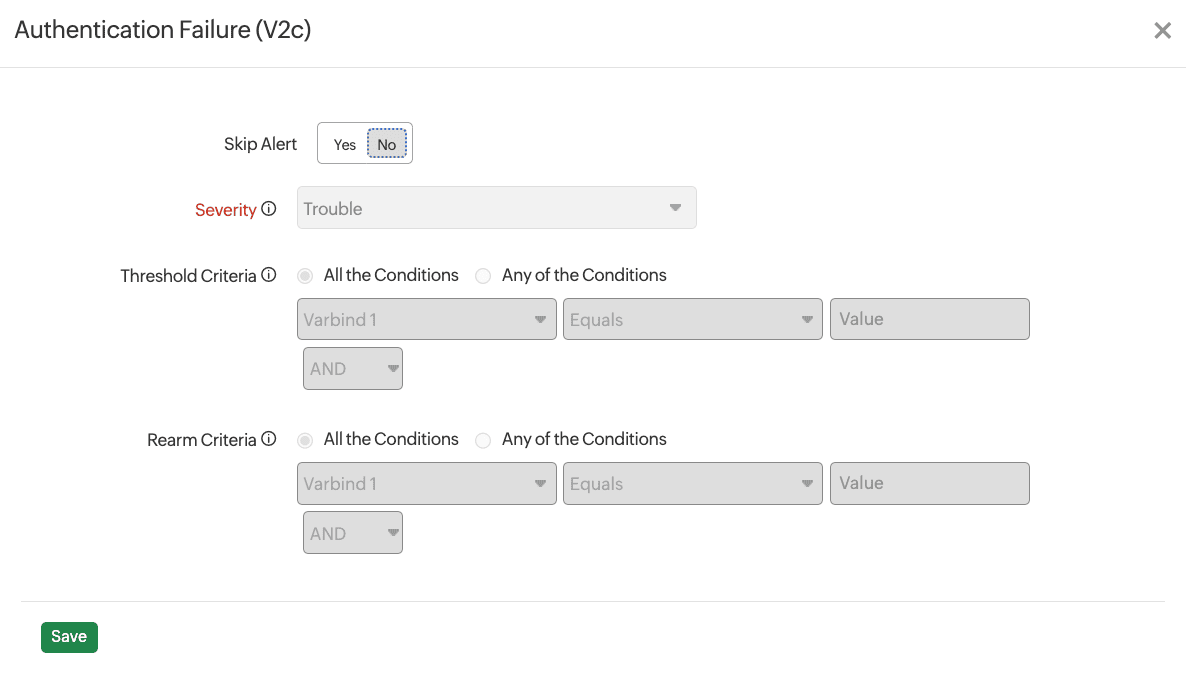
Figure 12. Setting threshold conditions.