Network inventory
Monitor routers, switches, switch stacks, firewalls, load balancers, printers, storage devices, wireless LAN controllers, and other devices in your network with Site24x7's network monitoring. Obtain real-time availability stats with one-minute status polls, and stay on top of your network's performance by using our performance counters.
The network inventory page provides a centralized view of all discovered devices and interfaces in your monitored network. It helps you efficiently manage, organize, and audit your network assets from a single view.
How it helps
The network inventory page is designed to help you:
- View every SNMP-discovered device and interface—along with monitors discovered through API like Cisco Meraki, Cisco ACI, and VMware VeloCloud SD-WAN—all in one place.
- Check device status, type, IP address, and interface metrics at a glance.
- Identify changes in inventory quickly.
- Perform quick actions like editing, deleting, or grouping devices.
Use cases
- Auditing: Track all network assets in one place.
- Troubleshooting: Identify down devices or interfaces quickly.
- Compliance: Maintain an accurate list of network devices for audits.
Viewing the network inventory page
- Log in to your Site24x7 account.
- Navigate to Network to view the Network Inventory Dashboard.
How to use the network inventory page
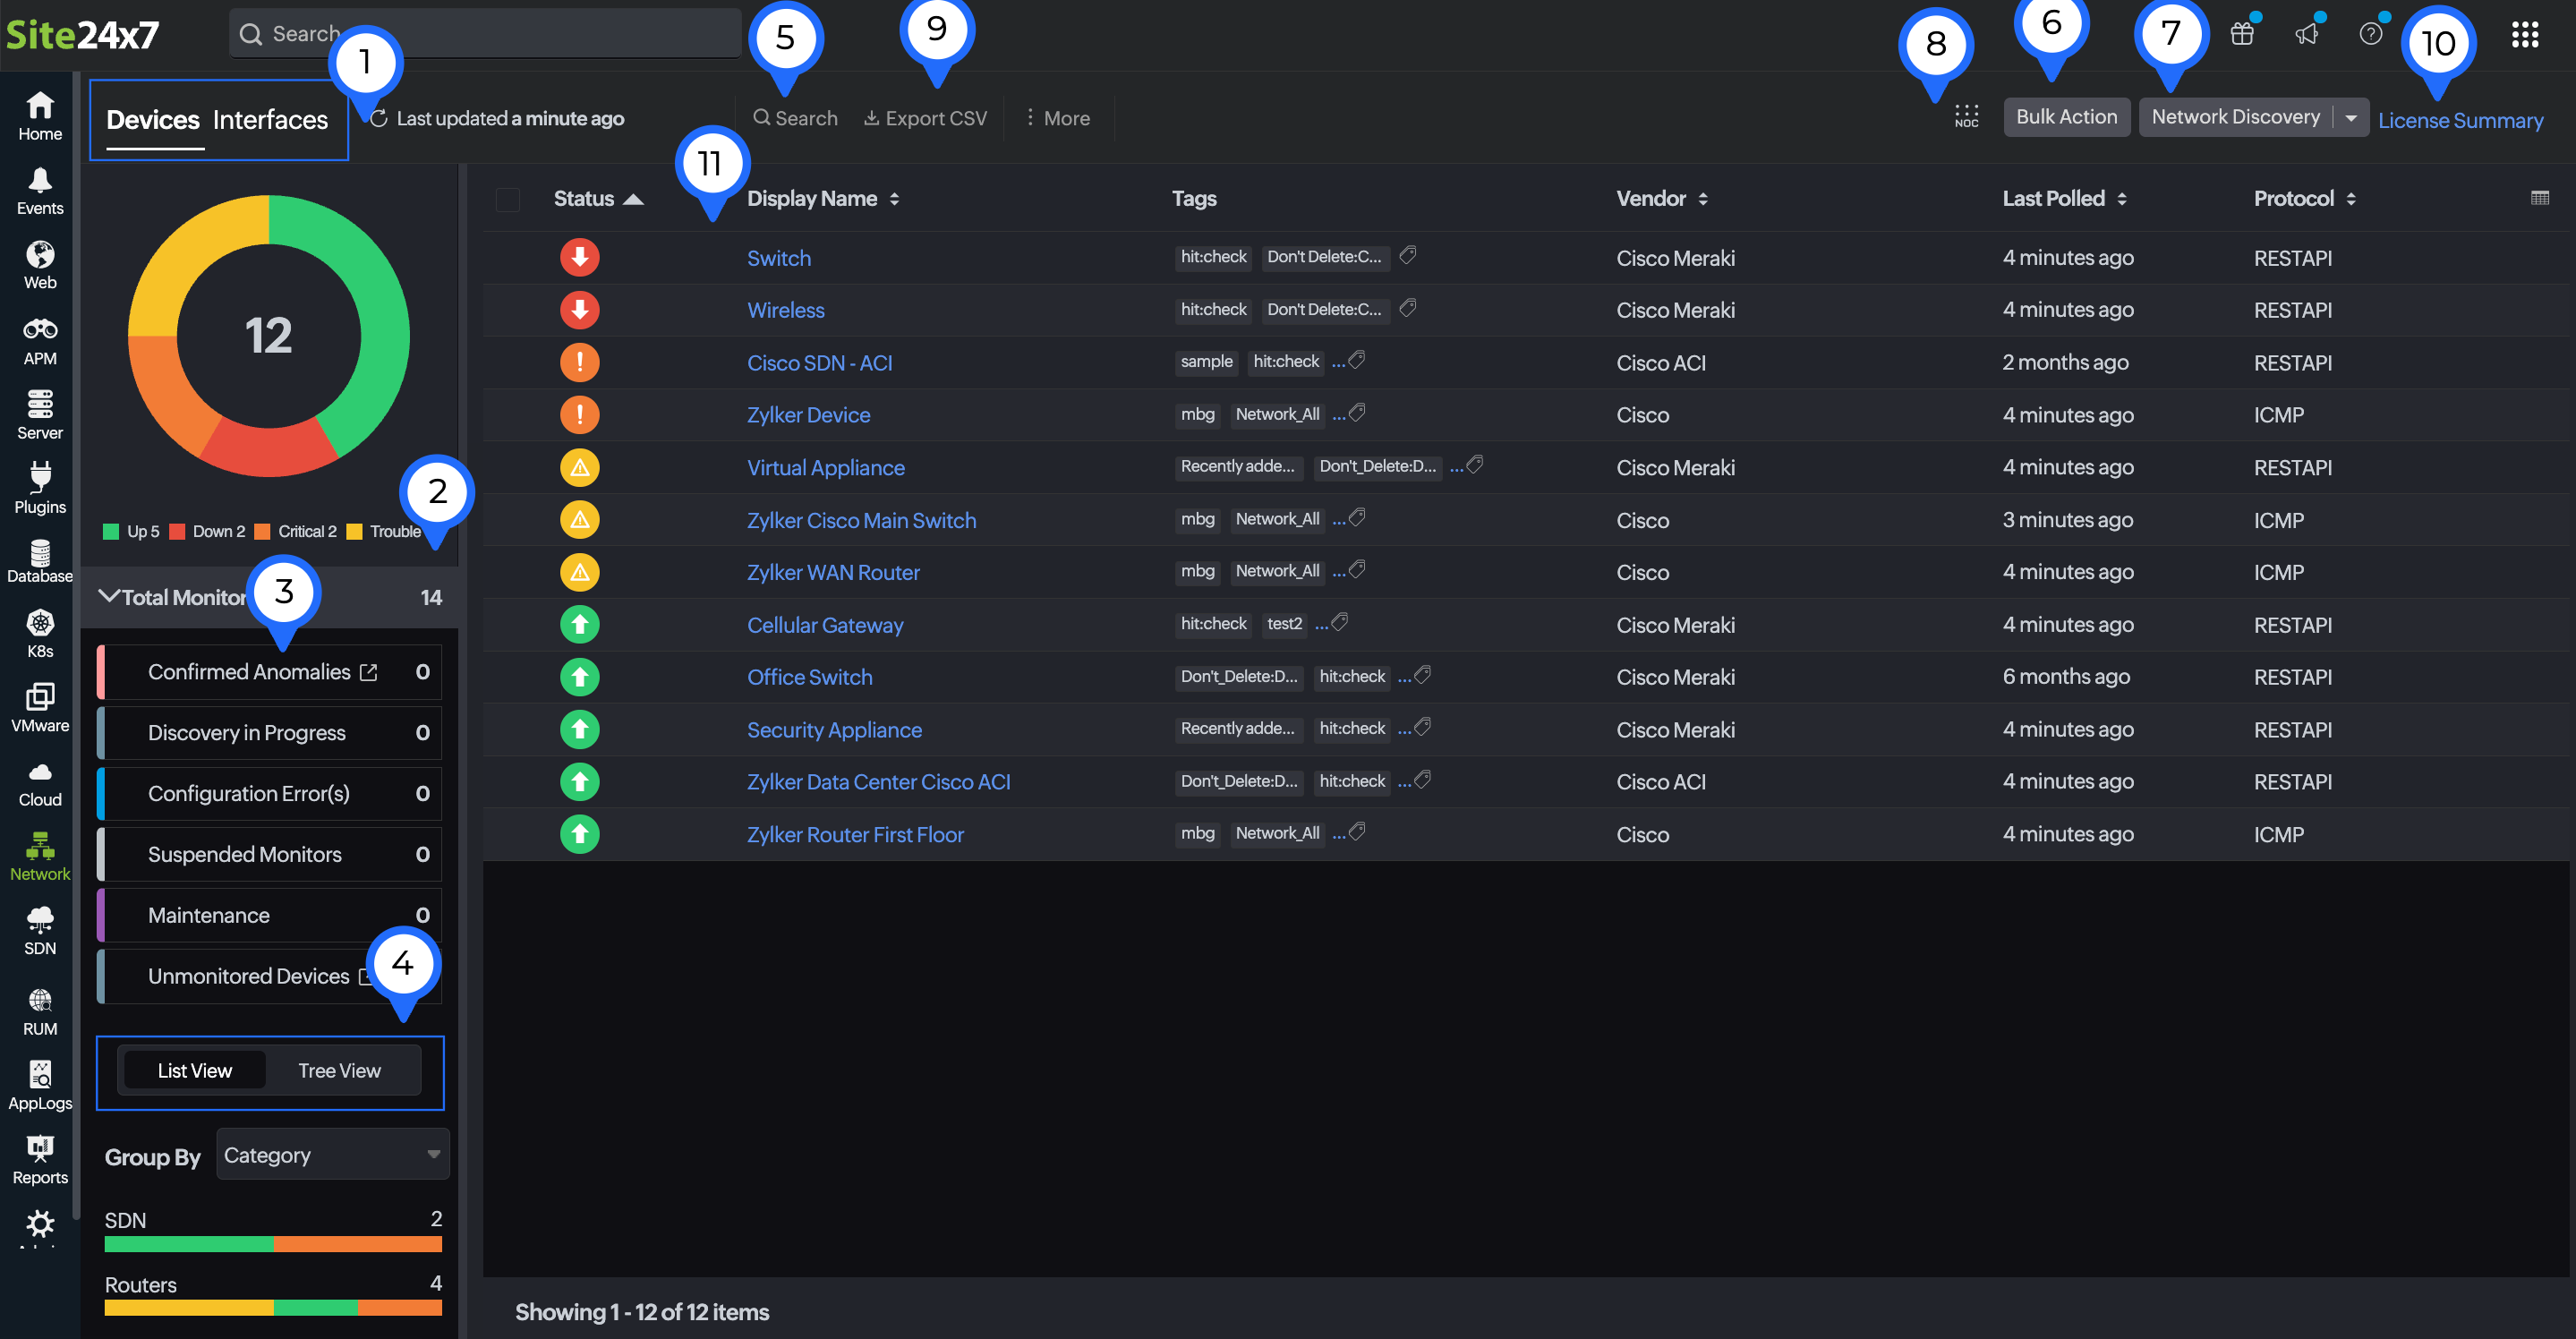
The Network Inventory Dashboard is designed to give you complete visibility into your network devices, interfaces, and more. Use the image below to understand each numbered section:

Figure 1. Network Inventory page.
- Start by selecting the type of view you want:
- Devices: View all monitored devices like routers, switches, firewalls, SDNs, SD-WANs, and more.
- Interfaces: Drill down into interface-level metrics.
- The doughnut chart gives the total number of monitored devices and their statuses. Use the legend to toggle monitors in the doughnut chart.
- Below the chart, you’ll see a breakdown of Confirmed Anomalies and monitors in the following states: Discovery in Progress, Configuration Error(s), Suspended Monitors, and Maintenance.
- Next, use List View or Tree View to organize devices as per your preference.
- Group devices by category (e.g., SD-WAN, Switches).
- Get visual insights with color-coded bars indicating each device's status.
- You can also quickly locate a specific device using the search bar at the top-right corner.
- Click the check boxes before the Status column for specific monitors and click Bulk Action to navigate to the Bulk Action page. You can also navigate directly to the Bulk Action page without choosing any monitors.
- Click Network Discovery to initiate a network scan to discover new devices. Click the drop-down button beside Network Discovery to add Cisco Meraki, Cisco ACI, and VeloCloud SD-WAN monitors.
- Click the NOC icon
 to check the NOC view for all your monitors.
 - You can export the network inventory list as a CSV file. Select the required devices, click the Export CSV button, and select Export selected items or Export all items as needed. The CSV file will be downloaded to your device.
- Click License Summary to view the license consumption for all your network monitors.
- The main panel displays all devices with the following columns, which you can sort and filter for better focus:
| Column name | Description |
|---|---|
| Status | The current status of the monitor. |
| Display Name | A unique, user-defined display name that identifies the monitor. |
| Tags | User-defined labels assigned to group and filter devices easily. |
| IP Address | The unique network address of the device. |
| Device Type | Identifies the device type according to the device template (if it is an SNMP device) or the model number (if it is monitored through API). |
| Response Time | The time taken for the device to respond. |
| Packet Loss | The percentage of data packets lost in transit. |
| Active Interfaces | The number of interfaces currently in an active state. |
| Last Polled | The time when the device was last successfully polled. |
| Host Name | The name assigned to the device within the network. |
| Category | The device classification (such as switch, SDN, SD-WAN, custom device, etc.). |
| Vendor | The manufacturer or brand of the monitored network device. |
| Credential Name | The authentication profile used for device communication. |
| Protocol | The protocol (ICMP or RESTAPI) used for monitoring. |
| Serial Number | The manufacturer-assigned unique identifier for the device. |
| Firmware Version | The current firmware or OS version running on the device. |
| Performance Counters | The count of collected performance metrics like CPU, memory, traffic, etc. |
| Interface Discovery Rule | The rule applied to auto-detect and monitor interfaces. Edit the monitor details to change the rule. |
| On-Premise Poller Name | The name of the On-Premise Poller that is monitoring the device. |
| Discovered Time | The time when the device was first discovered. |
| Last Updated Time | The last time device details were updated. |
| NCM Monitor | Indicates whether the device is also added as an NCM monitor. If the device can be added as an NCM monitor, Enable will be shown in the column. Click Enable to start monitoring the device in NCM. If it is already monitored, the IP address of the NCM monitor will be displayed. |
| NetFlow Monitor | Indicates whether network traffic monitoring is enabled. If the device can be added as a NetFlow monitor, Enable will be shown in the column. Click Enable to start monitoring the device for traffic. If it is already monitored, the IP address of the NetFlow monitor will be displayed. |
| CPU Utilization | The percentage of CPU resources being used. |
| Memory Utilization | The percentage of memory currently consumed on the device. |
| Monitor Type | Specifies whether the device is a Network Device or any SDN or SD-WAN device (like VeloCloud Edge, Meraki Camera, Cisco ACI, etc.). |
| Customize Columns | Click the table icon |
| Actions | Click the hamburger icon |
NOC view
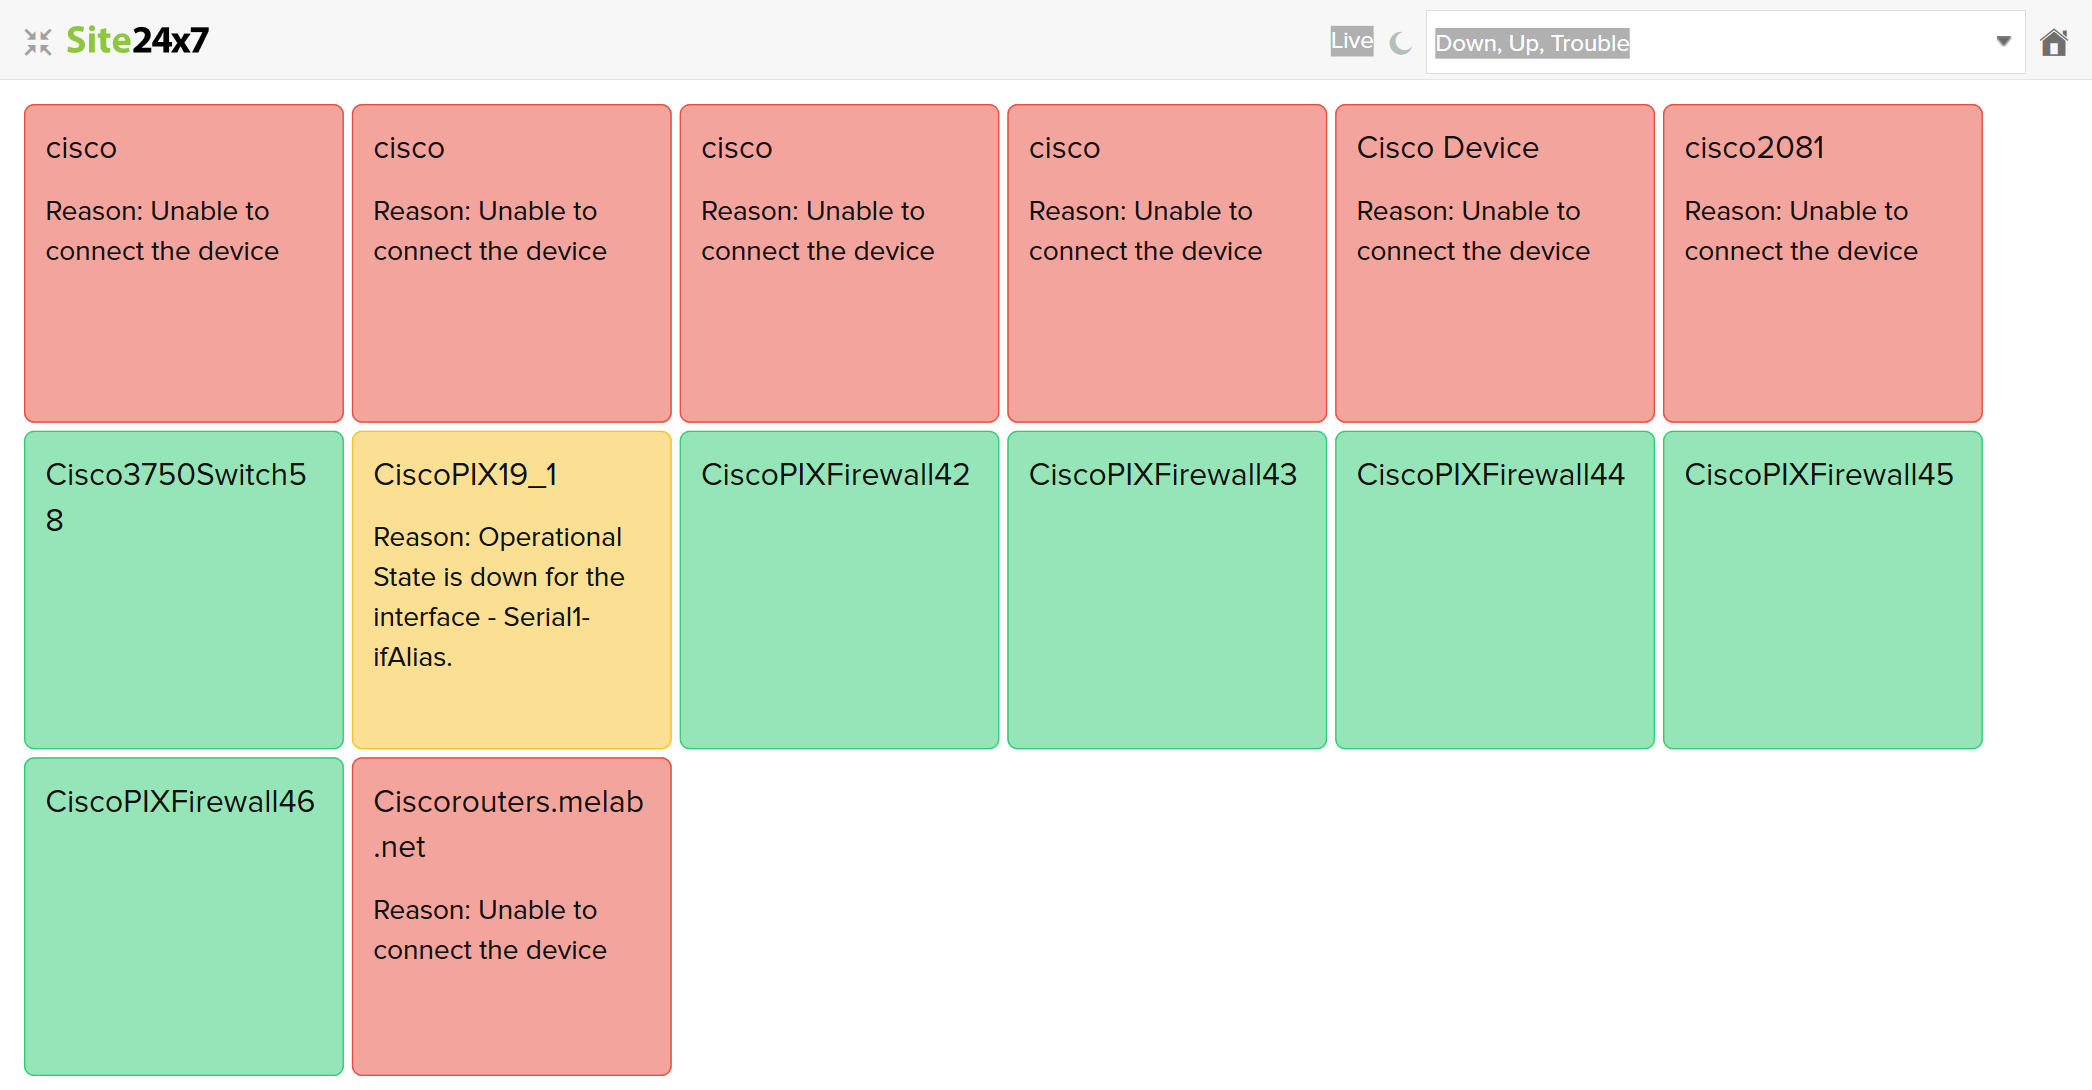
Click the NOC icon ![]() next to the Last Polled selector on the Network Devices page to open the NOC view (Figure 1, marked as 5). This view displays each device as a color-coded tile.
next to the Last Polled selector on the Network Devices page to open the NOC view (Figure 1, marked as 5). This view displays each device as a color-coded tile.
Statuses are displayed as:
| Status | Color |
|---|---|
| Up | Green |
| Down | Red |
| Trouble | Yellow |
| Configuration Error | Blue |
| Discovery in Progress | Dark gray |
| Maintenance | Lilac |
| Suspended | Light gray |
You can filter the view based on these statuses. Every tile displays the device name and the reason for the current status.

Figure 2. NOC view.
Device health
Get a clear picture of your network's performance, including stats on the top performing network devices, using our Network Health Dashboard.
If your switch is a stack switch, you can view the individual switch and hardware details from the Stack tab.
