Anomaly Reporting powered by Artificial Intelligence
Site24x7's AI-powered Zia framework for anomaly uses the Robust Principal Component Analysis (RPCA) and Matrix sketching algorithms to detect any unusual spikes or aberrations in your monitor's critical performance attributes, viz., Response time, CPU used percent, Memory utilization etc.; further, notify you about such spikes in a detailed tabular or graphical dashboard inside the webclient and via alert emails. All your KPIs are compared against seasonal benchmarked values. The Anomaly Report helps you fine-tune your resource performance and safeguard your infrastructure from any unforeseen issues. You can share anomalies with your team either by generating a CSV, PDF or via email.
Overview
The idea behind anomaly detection over a metric being monitored, is to identify any unusual spikes or aberrations in a given series. Any monitoring measure for which anomaly detection is to be enabled is treated as a time series wherein, it is polled with respect to time across uniform intervals. Depending on certain mathematical inequalities which are static, would not give contextually consistent results in the long run. Artificial Intelligence (AI) can address this with an approach that aims to detect an anomaly, upon its occurrence immediately.
An AI-based approach has distinct flavors like:
- Smoothening of Trends: Trend handling captures the overall pattern direction (rise or fall)
- Handling Seasonality: It's the pattern structure that keeps reccuring more or less in each time frame
- Robustness: Makes it immune to insignificant performance spikes.
Predict Trends with Anomaly Engine
The anomaly engine's cycle consists of various stages that include processing incoming data from data collectors against the AI-training data to generating a confirmed anomaly to notifying the anomaly itself. The Anomaly Engine has a quantitative and qualitative comparison model for anomaly detection. Prediction with Anomaly Engine involves two stages:
Anomaly Event Generation
The main purpose of this stage is to perform the heavy weight processing and generate Events. Anomaly detection engine collects the metrics every 15 minutes from Site24x7 data collector agents. For Univariate Anomaly Detection, this data is compared against the training data for the machine learning model, which is the last two weeks' respective day's hourly 95th percentile values. For e.g., if friday’s data is sent for anomaly detection, then the last two weeks’ friday’s values will be considered as the training data for the machine learning model. This helps achieve seasonality in the data. The 95th percentiles of the data are considered for training in order to remove extreme values present (In 95th percentile, top 5% highest values are removed, which will also remove any unusual spikes in the training data).
For Multivariate Anomaly Detection, Site24x7's data collection agents again push data to the Anomaly detection platform every 15 minutes. The last two weeks' hourly 95th Percentile values for corelated attributes are used for training the algorithm. If the combination is detected as an anomaly, attributes which contribute to the combination to be an anomaly will be determined.
Based on the comparison against the training data, the events are then generated and defined as L1, L2, and L3 values, with the L3 values having the highest chance of being an anomaly.
Domain Scoring to Determine Anomaly Severity
This stage adds a qualitative model to anomaly generation by also considering anomalies seen in dependent monitors. Events sum up and give a score based on which the Severity of Anomaly is decided. When an anomaly scoring task is scheduled upon occurrence of anomaly, the anomaly engine checks if there was any anomaly for any dependent monitors during the last 30 minutes. Scores are given to individual monitors based on the attributes that cause the monitor anomalous and the percentage of deviation of these attributes from the expected values.
The following methodologies (in the same order specified below) are usually considered for the final score determination:
- Another attribute of the same monitor detected as anomalous
- Dependent monitors detected with anomaly
- Parent/child monitors are anomalous
- Monitors, grouped under the same Monitor Group detected as anomalous
- Other monitor with the same Tags (user defined tags) has anomaly
- Monitors with the same Server name/Same Fully Qualified Domain Name (FQDN) has anomaly
You can read our Kbase article to know about the various cases used for domain scoring and severity benchmarking.
Finally, based on the factors like domain scores, dependencies and increasing gravity of the detected anomaly, the severity of an anomaly is segmented into three:
- Confirmed Anomaly
 : It highlights a negative trend which occurs on a persistent manner. When a confirmed anomaly repeats for a longer period, it clearly guides you to an immediate and inevitable outage situation. Hence, the repetitive confirmed anomaly needs your utmost attention.
 - Likely Anomaly
 : You must keep a close tab on such a trend, as it might lead to an outage situation in the long term.
 - Info
 : This is just a notification for the user and must be monitored very closely, inorder to alleviate any future issues.
Zia-Based Threshold Profiles
Zia-based threshold profile uses anomaly detection to determine the status of a monitor. It is a dynamic threshold approach unlike the currently used static thresholds. In the current static threshold profiles, you'll have to set hard coded thresholds to determine the status of a monitor. In case of any issue, you'll be notified only when the set thresholds are breached.
For Zia-based thresholds, you will not be able to set any hard coded threshold. Instead we will have thresholds that will be updated according to the monitor's behaviour. So, in case of any issue, customer will be notified immediately once the issue starts, rather than waiting for the static threshold to be breached. Along with being dynamic, this eliminates the need of setting poll strategies. Poll strategies are essential to avoid intermittent spikes. In case of anomaly detection, spike bursting is done to avoid reporting intermittent spikes as anomalies. Hence, hard coded poll strategies can be avoided.
How it works?
You can select a Static Profile or Zia-Based Profile from the existing Threshold profile form. If you choose Zia-Based threshold profile, the severity selection option will be shown for the attributes for which anomaly has been enabled. For attributes which don't have anomaly enabled, static threshold settings will be shown irrespective of profile type selection. A combination of both static and Zia-based profiles cannot be selected.You'll be getting Zia-based settings only for those attributes for which anomaly option has been enabled.
In Zia-based threshold profile :
- Each attribute will have two severity options i.e Likely and Confirmed. They represent anomaly severities. If Likely severity is set to Trouble, it means that, "if there is a Likely anomaly in the attribute, then make the monitor status Trouble". Same is the case with Confirmed. But both severities cannot have the same status change.
- Each attribute also has an Automation option which can be mapped to the required action if there is a likely or confirmed anomaly.
Interpret Anomaly Dashboard
The Anomaly Dashboard lets you easily decode any negative trends in your IT infrastructure beforehand. You can find and filter the Anomalies based on monitor or monitor group selection.
Follow the steps below to view and interpret Anomaly Dashboard:
- Log in to Site24x7 account.
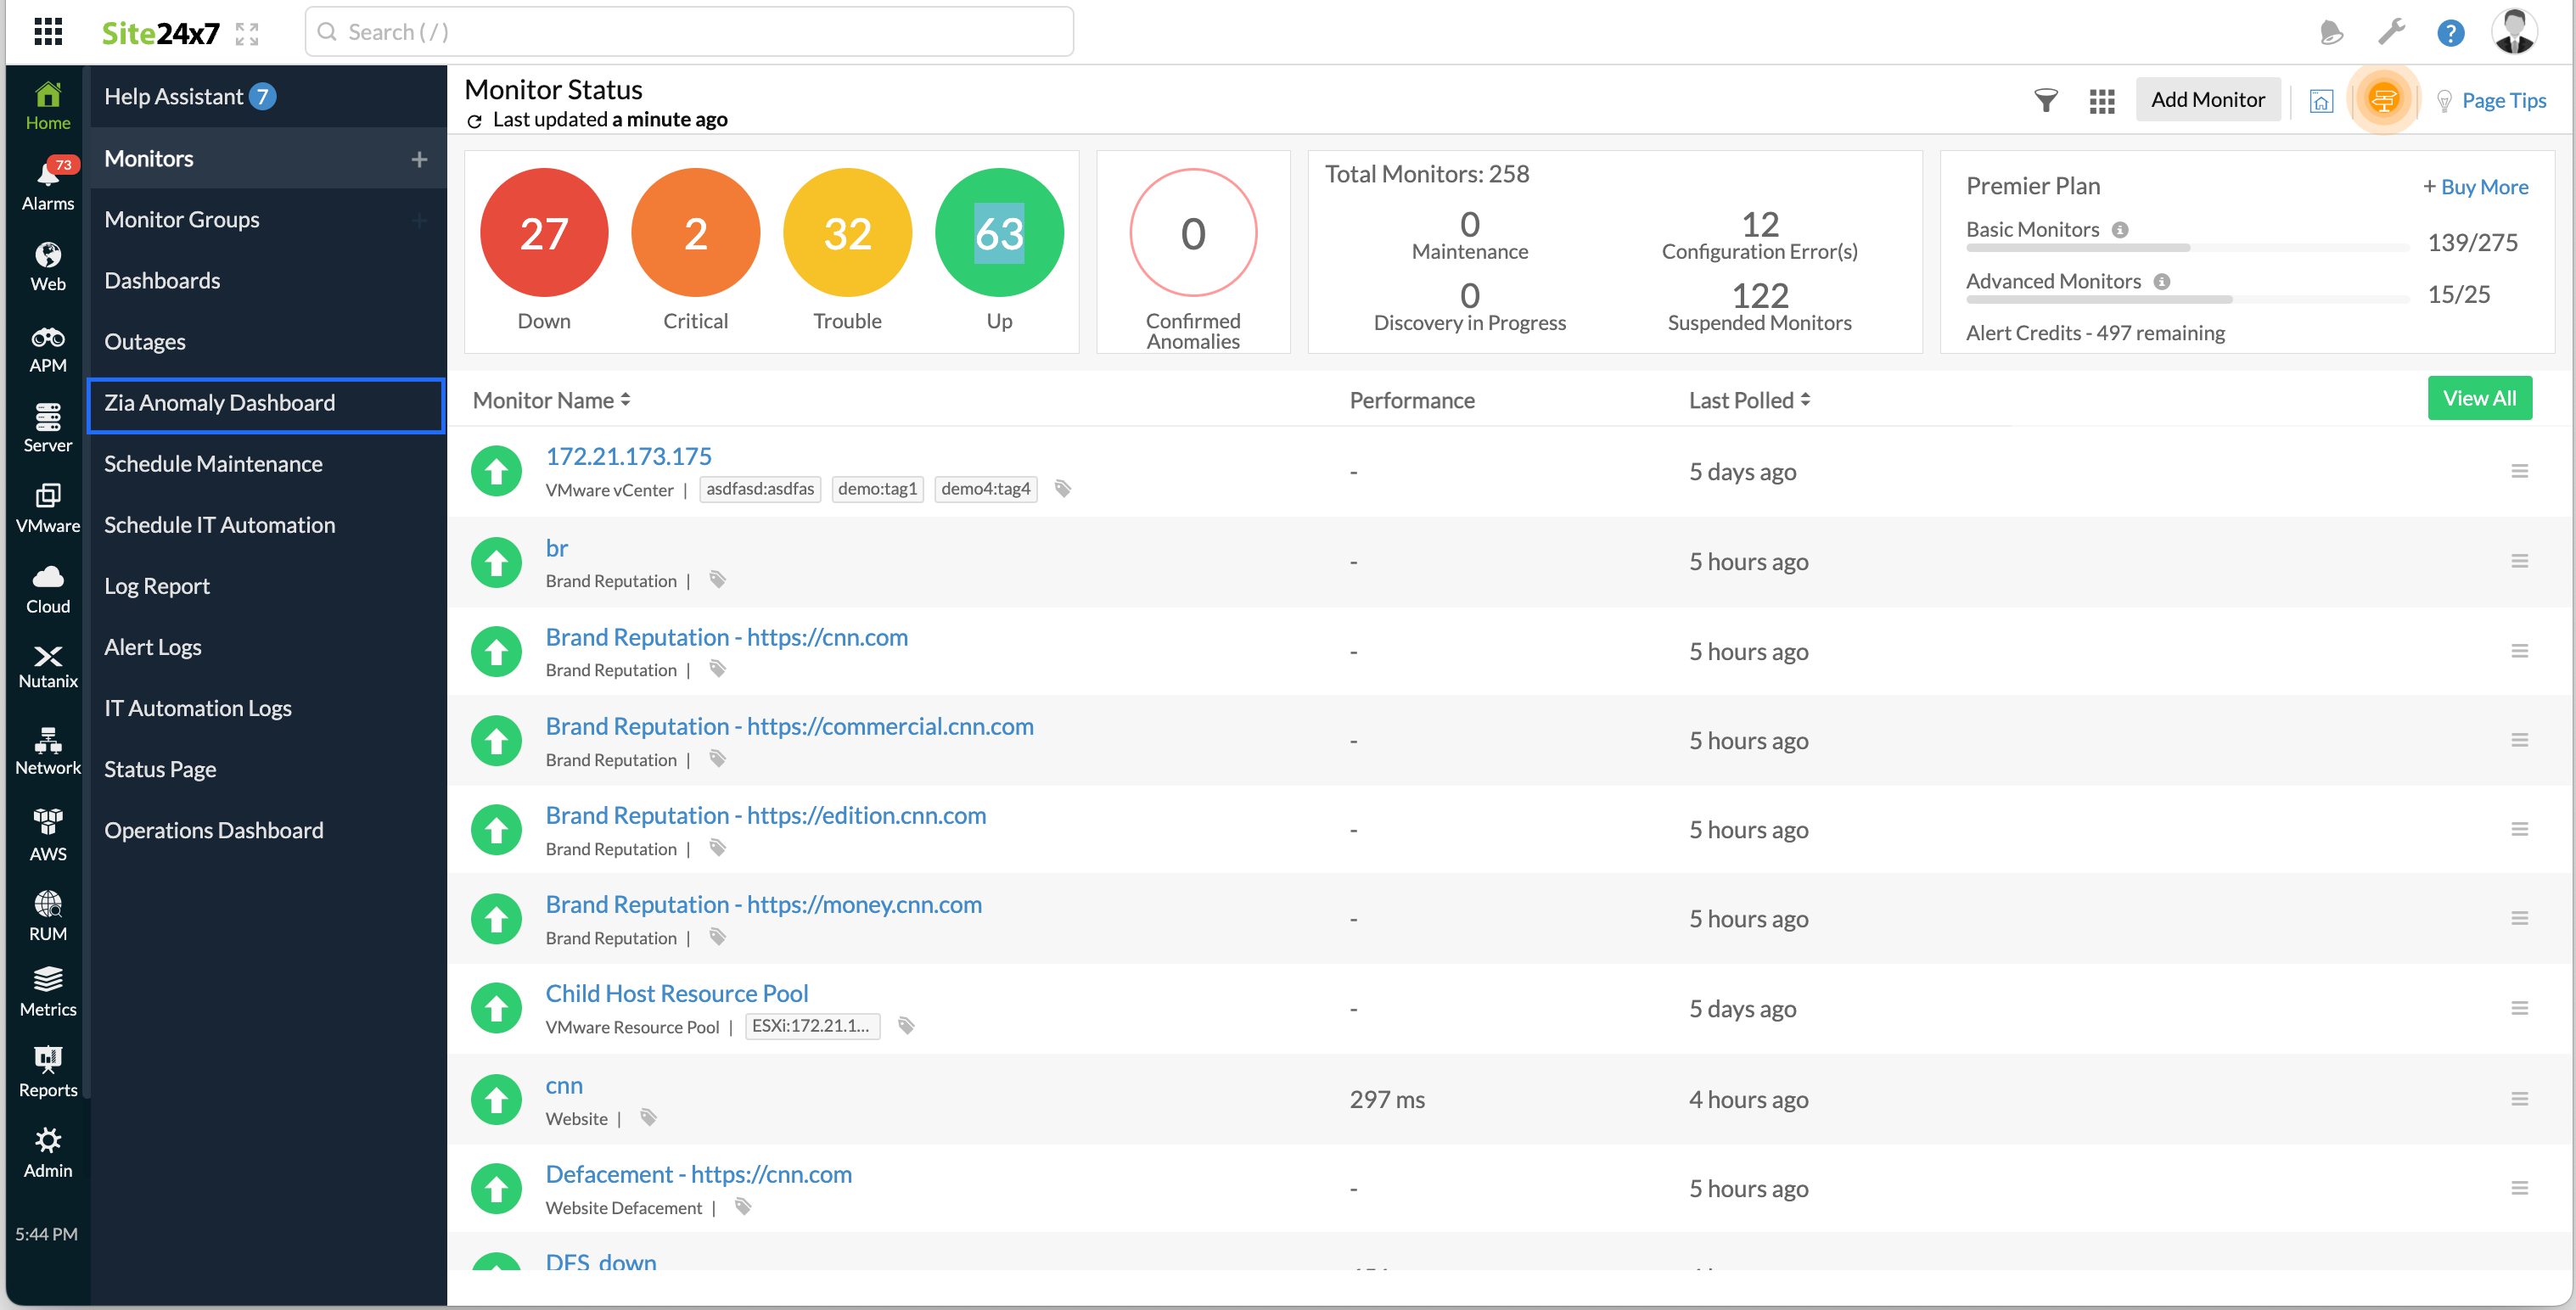
- Navigate to Home > Anomaly Dashboard.
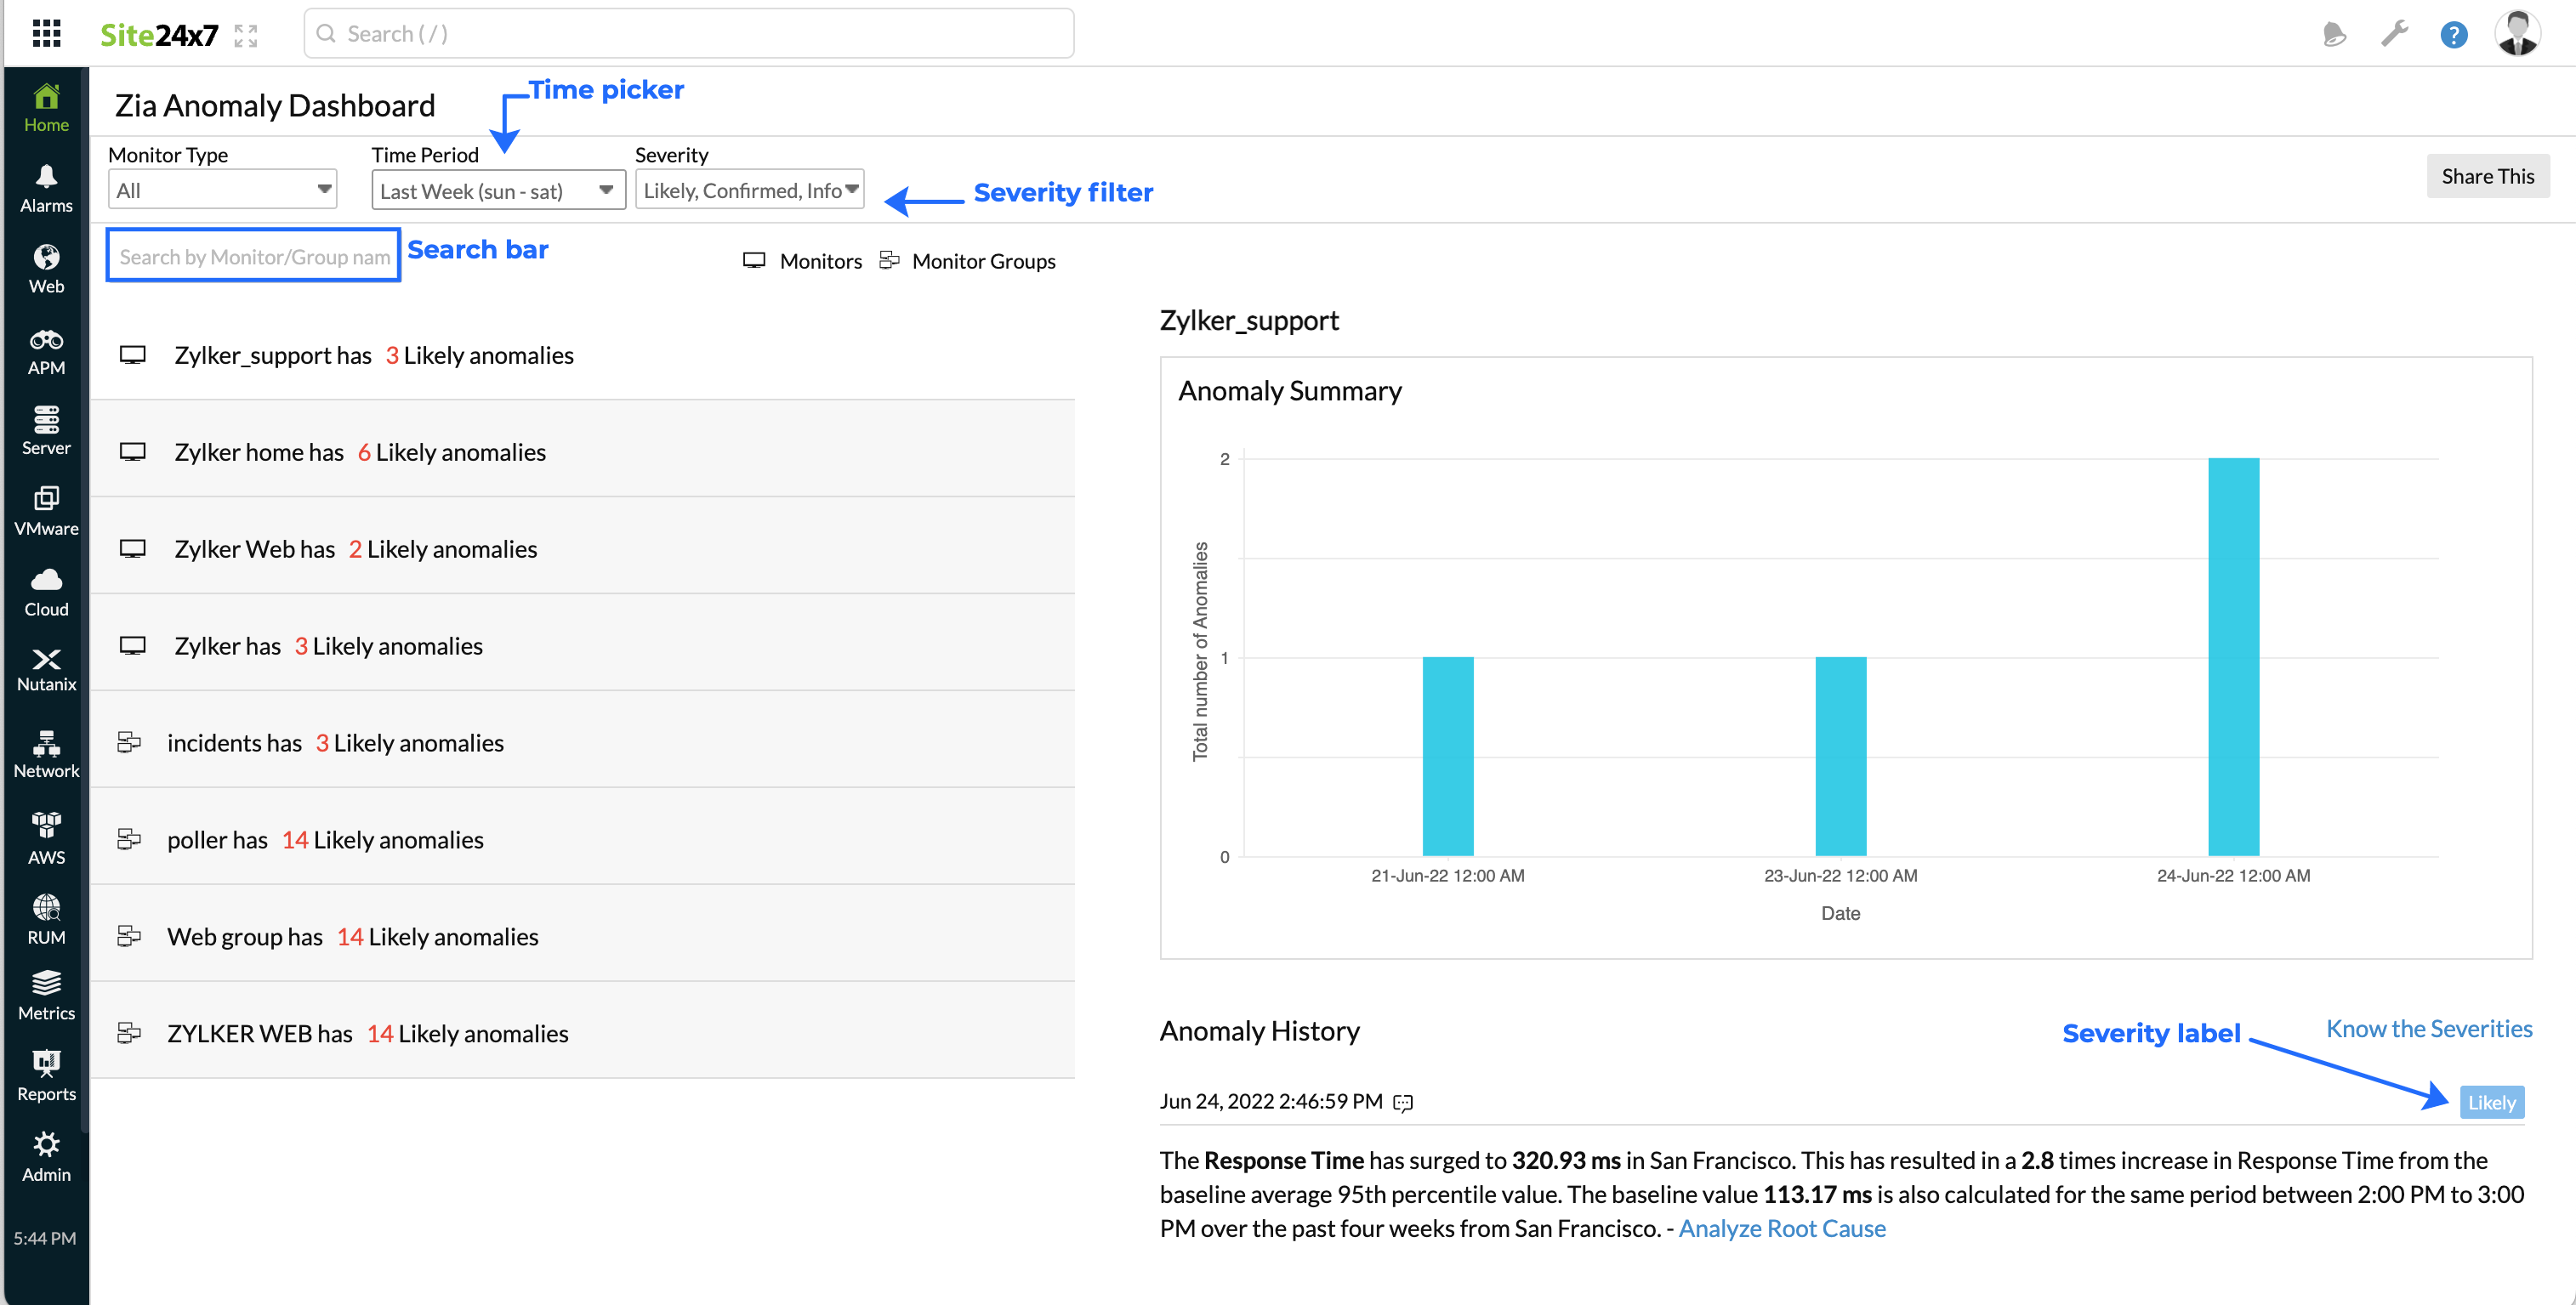
- Use the Time Period picker to select a time span ranging from Last 1, 6, 12, 24 hours upto a year back. You can sort Anomalies by looking up the Monitor/Group Names in the Search Bar.
- Additionally, you can categorize anomalies based on the various Severity Levels like Confirmed, Likely, and Info.
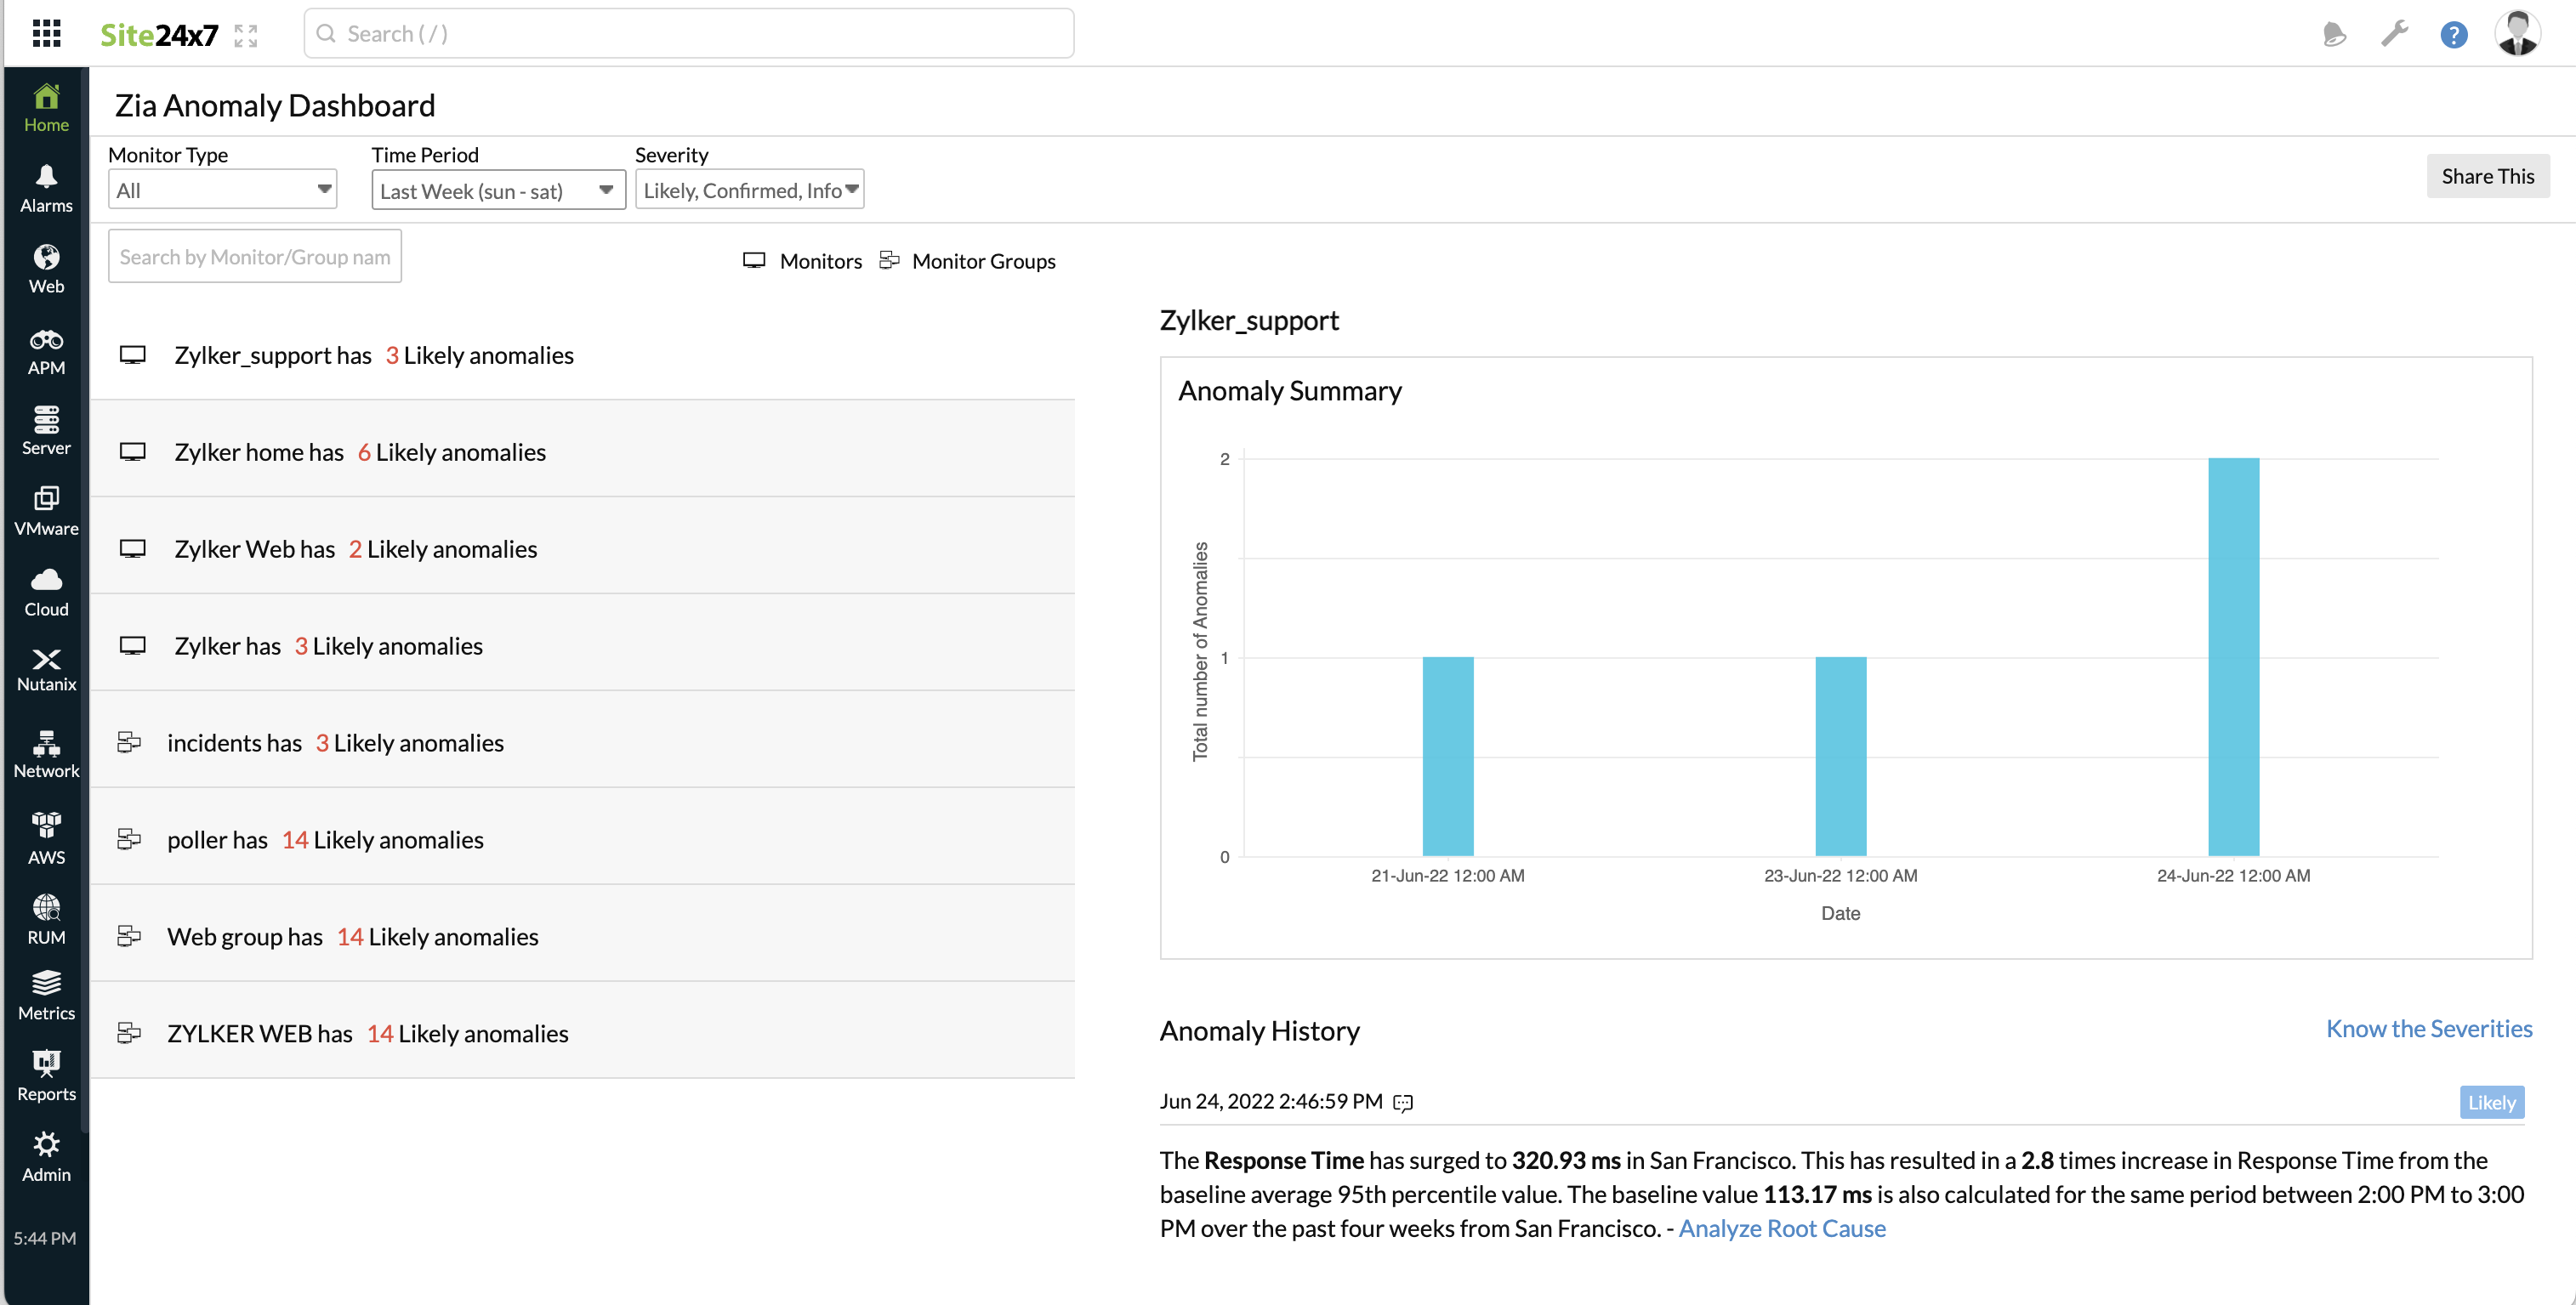
Once the dashboard is generated, you can click the Share This button shown on the top right corner to share the report via email, generate a CSV or PDF to share it with your teammates. Email can be sent to only those verified users who have agreed to receive emails from Site24x7.
The dashboard offers a Split View where all your monitors and monitor groups can be seen on the left side of the dashboard. On the right end of the dashboard screen, you can view the Anomaly Summary graph for the requested time period and the specific reason for each detected Anomaly (listed under the Anomaly History). You can sort Anomalies by looking up the Monitor/Group Name in the search field or filtering based on Severity levels. The Anomaly Summary graph displays the anomaly count of monitors/monitor groups for each day during the selected time period. The anomaly count of monitors is displayed using a stacked bar graph. Individual Anomalies will be listed under the Anomaly history section, with a detailed message regarding each listed Anomaly. All listed Anomalies will have their relevant severity flag against the Anomaly message. This Anomaly Description lets you gather indepth details about the anomaly trend. To gather further insights on the root cause of performance issues, click the hyperlink provided along with the Anomaly description.
The Anomaly Summary Graph displays the data for the selected time period. However, if the anomaly count crosses 100, then the data for only those days are shown in the graph, and the rest of the data for the remaining days is ignored.
The legends shown in the graph for each individual monitor, also acts as unique filters. You can use it to remove or re-insert specific monitors in the bar chart.
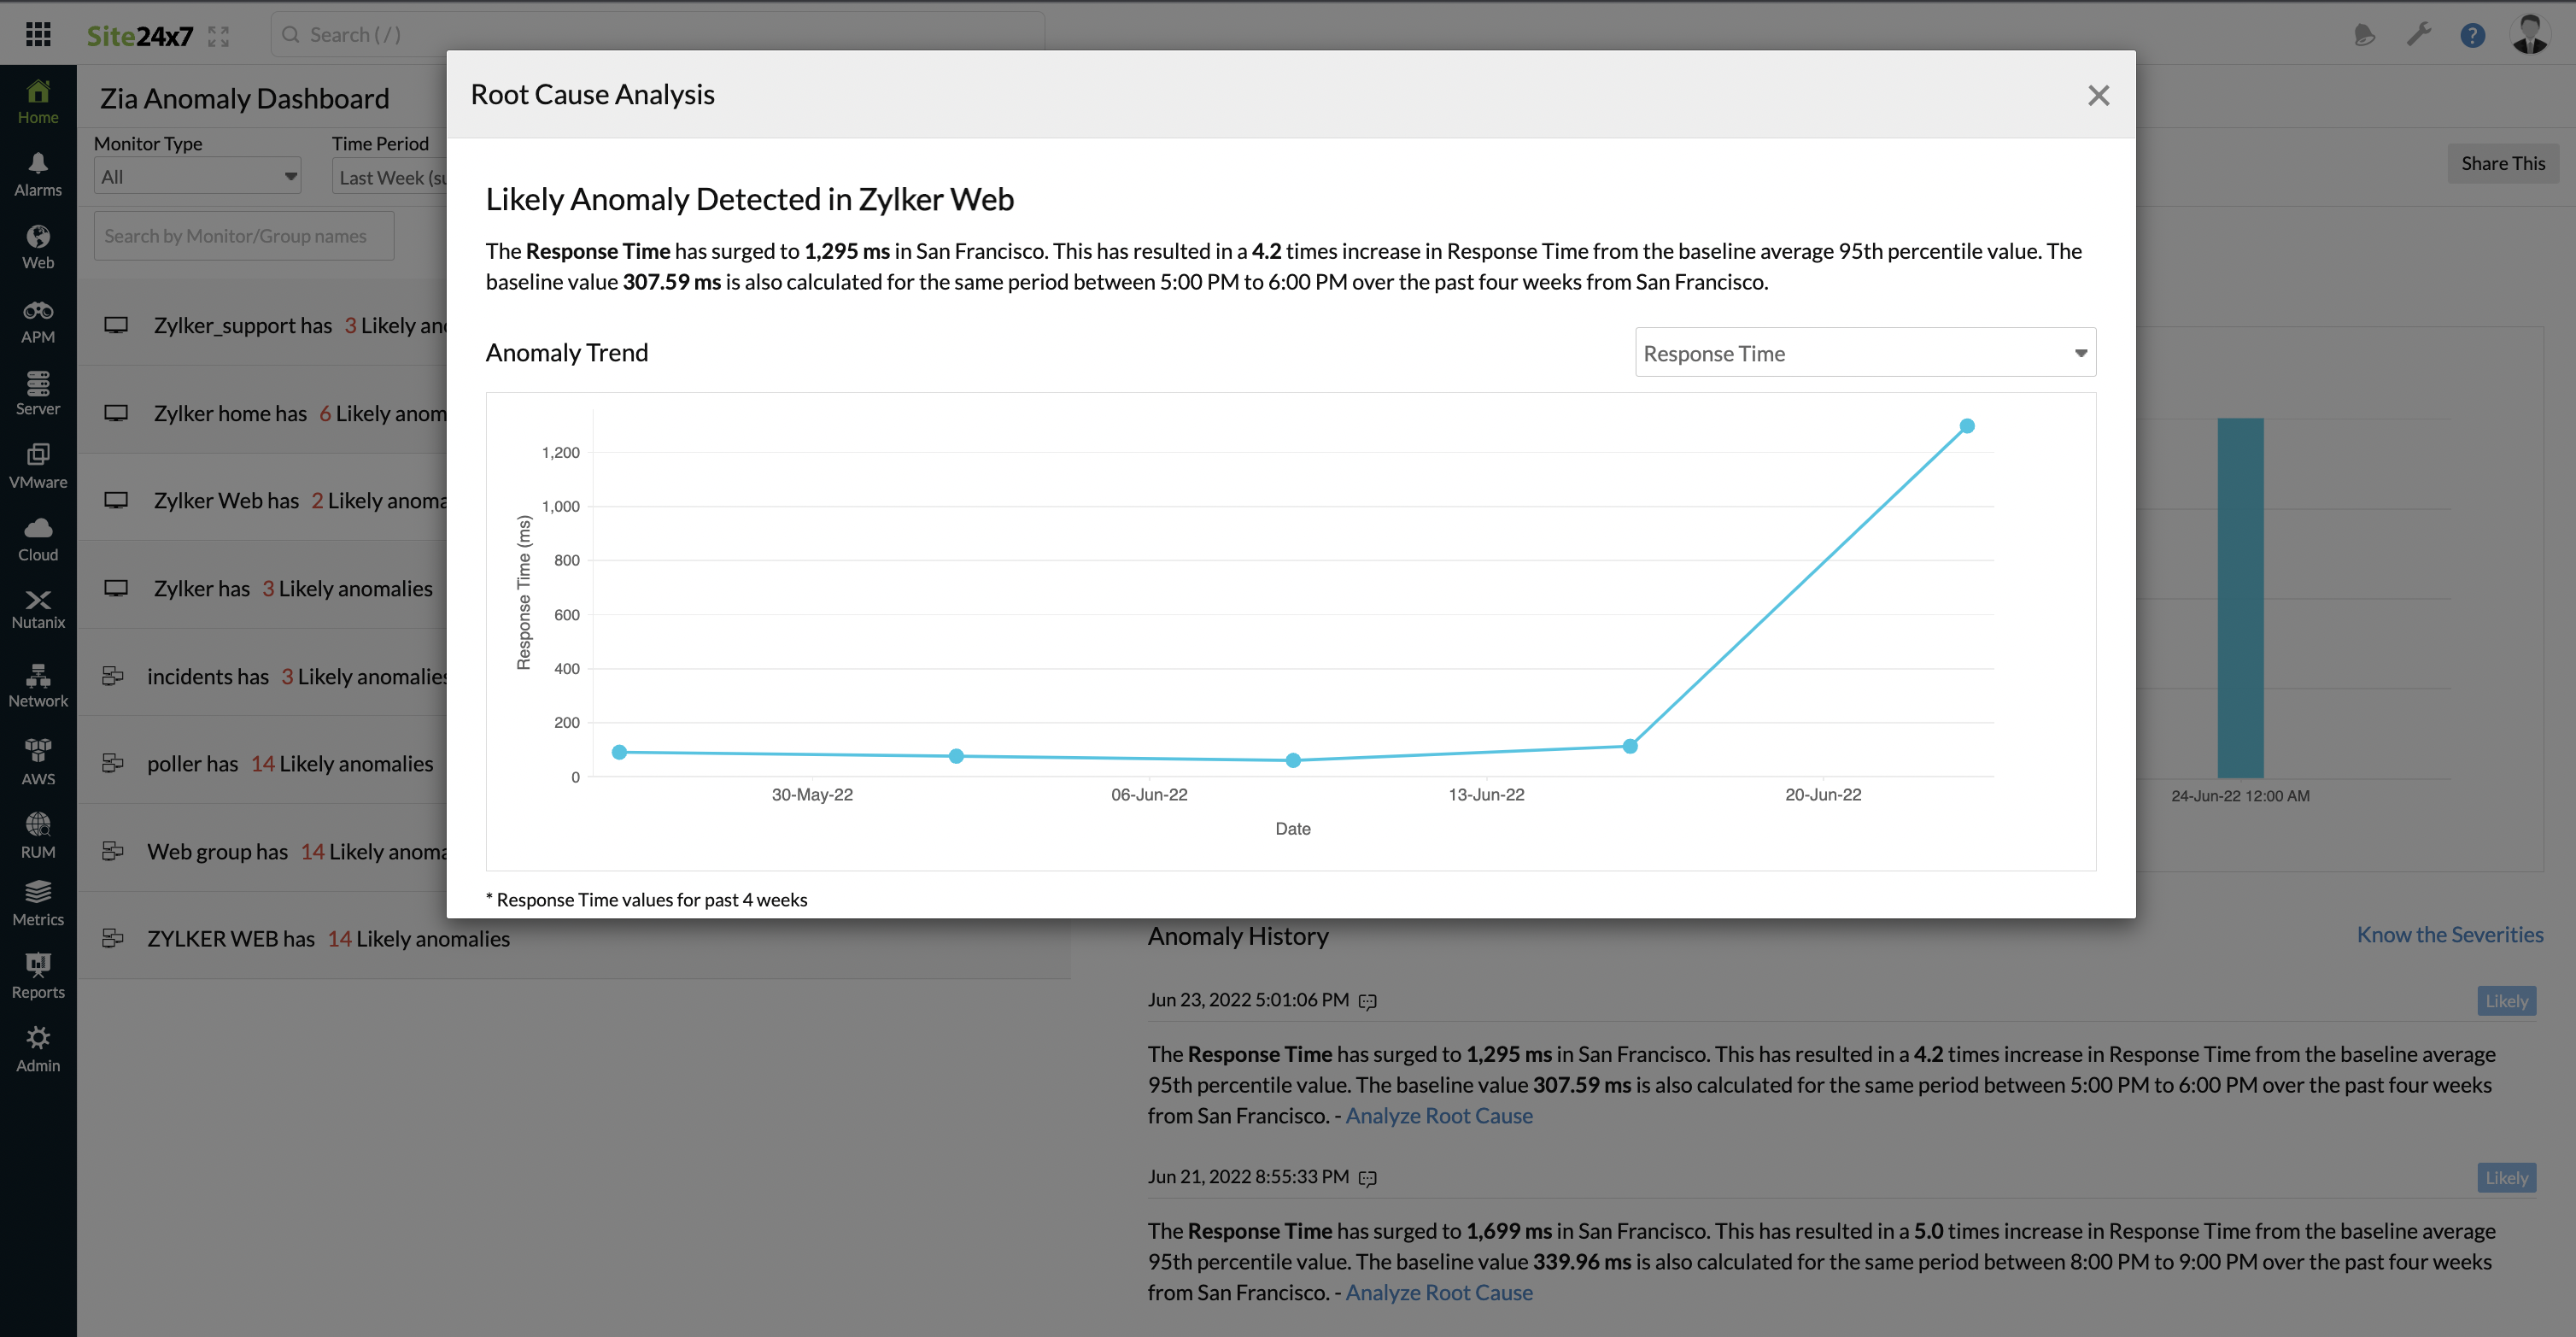
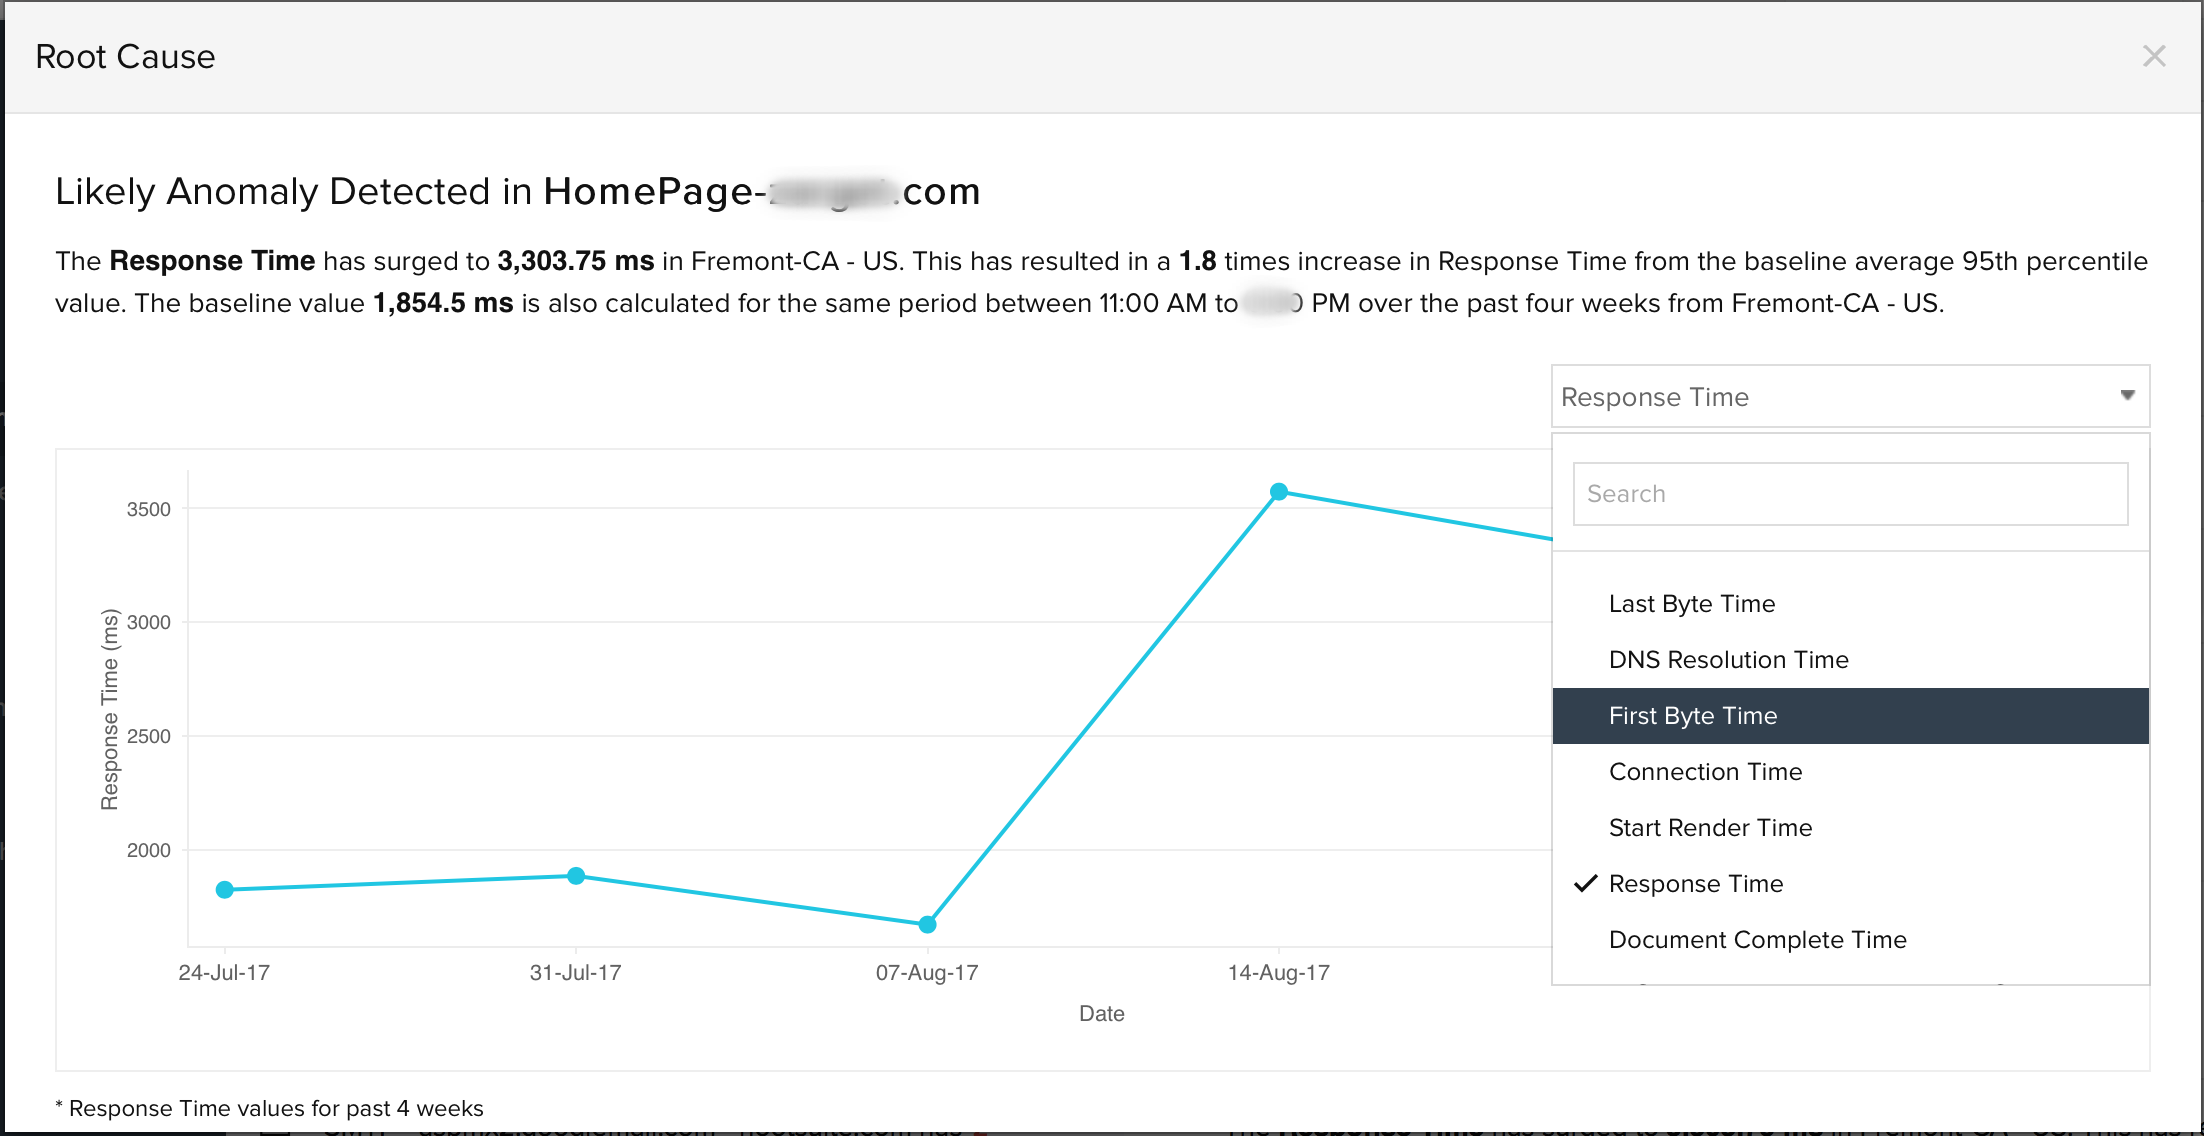
Once you click the Know the root cause link for a specific Anomaly message, you're prompted with a modal pop-up window where you can spot a line graph with the metric values. Just hover over the line graph to view the actual metric value for the specific date and time. The default metric value may vary from monitor to monitor. Every monitor will have one or more default attributes for which the anomaly detection will be enabled. However, on top of this, you can also use the drop down above the line graph, to view other performance attributes of the selected monitor, during the same time range.
Anomaly Detection: List of Enabled Monitors and Corresponding Performance Attributes
For most monitors, anomaly detection is enabled for certain metrics, by default. Here is a list of all such monitors and their respective performance attributes for which the anomaly detection is enabled.
| Monitor Type | Performance Attribute |
| Website | Response Time |
| DNS Server | Response Time |
| FTP Transfer | Response Time |
| Web Page Speed (Browser) | Response Time |
| Ping | Response Time |
| FTP Server | Response Time |
| Port (Custom Protocol) | Response Time |
| POP Server | Response Time |
| SMTP Server | Response Time |
| Web Transaction (Browser) | Response Time |
| Web Transaction | Response Time |
| Mail Delivery Monitor | Response Time |
| REST API Monitor | Response Time |
| SOAP Web Service Monitor | Response Time |
| Microsoft Hyper-V Server |
Health Critical VMs, |
| Microsoft Failover Cluster |
Outstanding Messages, |
| Microsoft Office 365 |
Group Created, |
| Plugins |
All Attributes |
| APM Insight - Application |
Response Time, Response time, request count and failed count for individual components Exception count of individual exceptions |
| APM Insight Instance |
Response Time, Response time, request count and failed count for individual components Exception count of individual exceptions |
| RUM Monitor |
Application Throughput, |
| Classic Load Balancer |
Latency, |
| Application Load Balancer |
Latency, |
| Network Load Balancer |
Processed Bytes, |
| Simple Notification Service |
Number of messages published, |
| Simple Storage Service (S3) |
Bucket Size, |
| AWS Lambda |
Invocations (Sum), |
| Elastic MapReduce |
Jobs Failed, |
| Web Application Firewall (WAF) |
Allowed requests, |
| Neptune Instance |
CPU Utilization, |
| Neptune Cluster |
CPU Utilization, |
| Lightsail Instance |
CPU Utilization, |
| Amazon GuardDuty |
Finding per day, |
| Monitor Type | Performance Attribute |
| EC2 Server Instance Monitor |
CPU Usage, |
| RDS Instance Monitor |
CPU Usage, |
| Microsoft IIS Server |
Queued Request, |
| Microsoft Exchange Server |
DB Cache Size, |
| Microsoft SQL Server |
Connection, |
| Server Monitor |
CPU Usage, |
| Microsoft Sharepoint Server |
Active requests, |
| Network Device |
Device Attributes: |
| NetFlow Device |
Device Attributes: |
| Agentless Server |
Device Attributes: |
| Meraki Security Device |
Device Attributes: |
