Server Health Dashboard
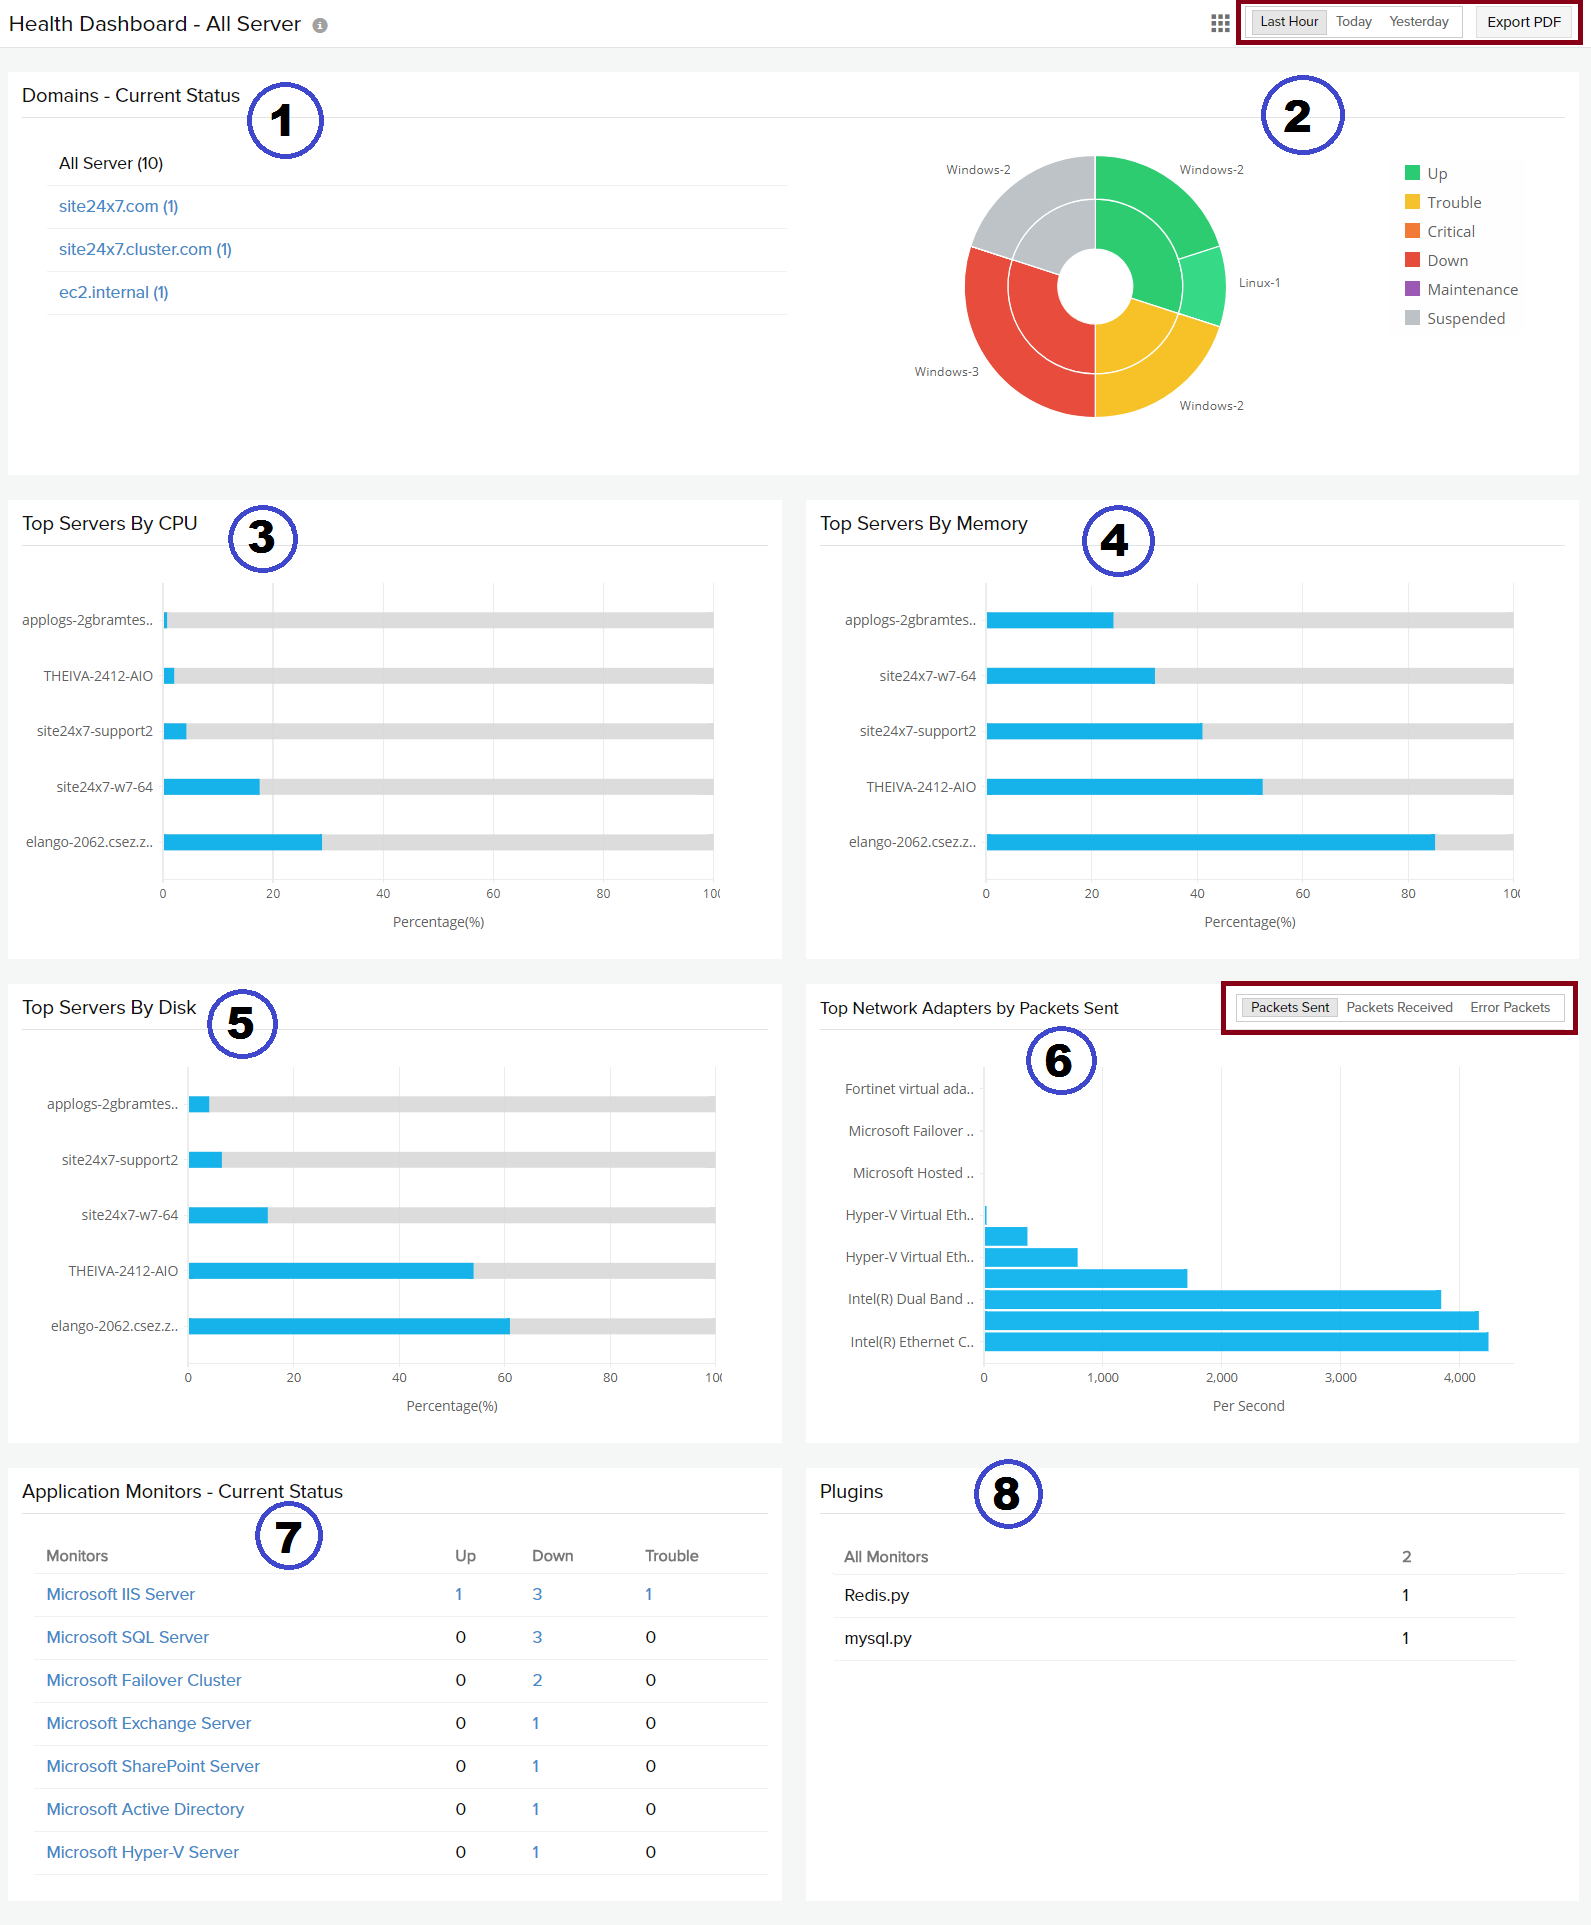
View and analyze the performance of your entire server environment by getting to know the current count and status of all the servers in your account. Detect performance outages by viewing the top servers based on CPU, memory, network and disk usage. Also, know the status of all your applications and plugins added and monitored in your Site24x7 account.
Log in to Site24x7 and go to Server > Server Monitor > Health Dashboard.
- Click on Export PDF to download your dashboard view in the PDF format.
- Use the toggle button to view the top resources for the Last Hour, Yesterday and Today.
Use Cases
Case 1:
In a setup of around 100 servers, there is a network issue in certain nodes that affects the overall performance. By viewing the Top Network Adapters by Error Packets, the user will be able to find out the problem causing machine and its respective adapter.
Case 2:
Consider a server environment of 50 servers split between two domains, A and B. The domain A is expected to have a high CPU and resource usage (over 70%). All the "Top Servers by CPU, Memory, Network, and Disk" charts are being populated with data of servers from domain A. Now, if the user wants to locate the high resource consuming servers in domain B in order to prevent a cron job failure or a resouce cleanup not happening, the servers can be listed based on domains. This will show up the top resource consuming servers for the selected domain.
What do I get to view?
- Servers listed based on domain. Filter based on domains to view the servers and their dependent resources in the respective domains.
- The count and current state (Up, Trouble, Critical, Down, Maintenance, Suspended) of all your Windows, Linux, FreeBSD, and OS X servers.
- Top servers by CPU
- Top servers by memory
- Top servers by disk
- Top network adapters by
- Packets sent
- Packets received
- Error packets
- Current status of all your application monitors
- For Windows - IIS, SQL, SharePoint, Exchange, AD, Failover Cluster, Office 365, BizTalk, Hyper-V, Windows Backup, Windows updates
- For Linux - Docker, SMART disk
- All the plugins added in your account

Related Articles
-
On this page
- Use Cases
- What do I get to view
- Related Articles
