Inventory Dashboard
The server inventory dashboard gives you the inventory details of all the servers and applications in your Site24x7 account. Log in to Site24x7 and go to Server > Server Monitor > Inventory Dashboard.
Note
Share This report as PDF or send it as an email to be viewed across your organization.
Benefits
- Complete overview of your server environment at a glance.
- Tabular listing of all the servers, applications, resource checks, services, processes, and plugins in one place.
- Quicker troubleshooting by identifying the problematic servers immediately. For example, when a threshold violation occurs due to an abnormality in the metric slow QP threads, filtering out based on Domains will help find out the problematic server and resolve the issue before it affects the overall infrastructure.
What do I get to view?
- Domains: Servers listed based on domains. Click on any specific domain to get the count of servers present in that domain and the count of dependency resources for those servers (check the Dependency Resources pie chart).
- Dependency Resources: Lists the total number of services, processes, applications, plugins, resource checks associated with your Site24x7 account.
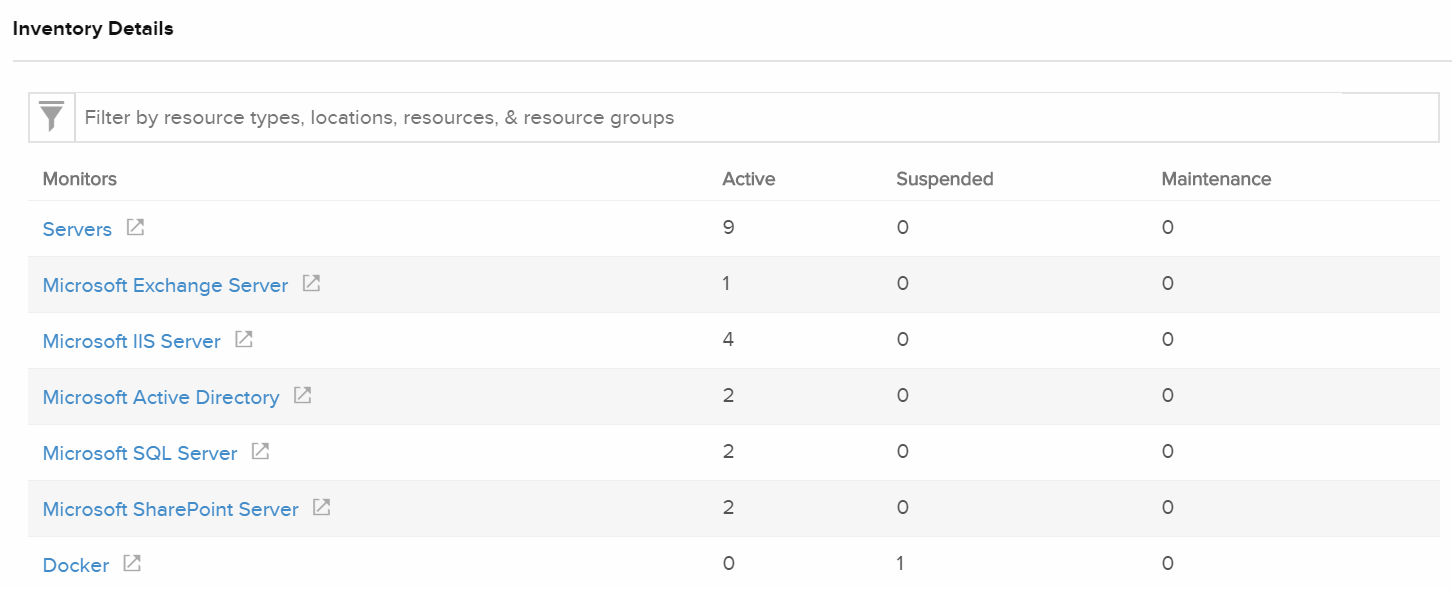
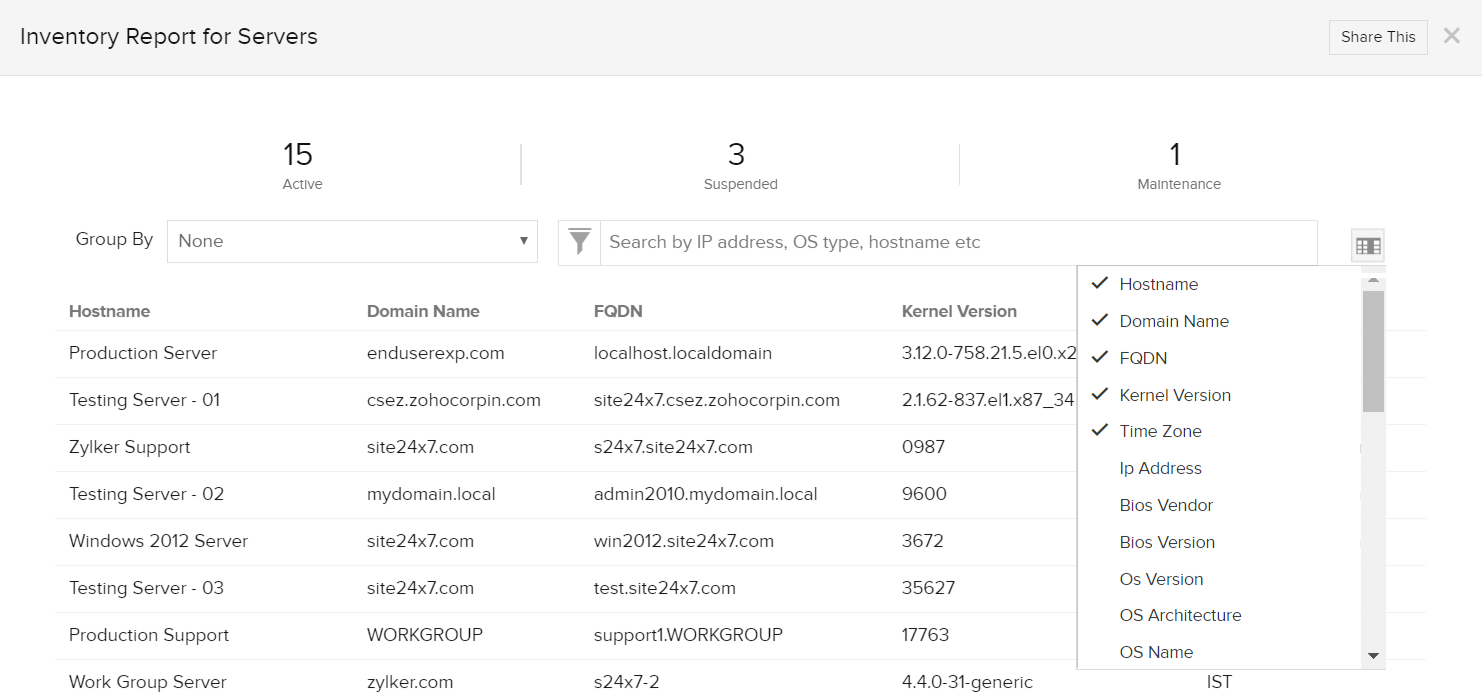
- Inventory Details: View the number of active, suspended, and under maintenance servers and applications in your Site24x7 account. Click on Servers or any application to view a detailed inventory report.

The Inventory Report lets you to filter and view servers and applications based on hostname, domain name, IP address, time zone, OS version, monitor creation time among many others. You can also group, sort, and search based on these options.
NoteYou can also view this under Reports > Server Monitor > All Monitors > Inventory Report.
Related Articles
- Health Dashboard
- Performance metrics for: Windows | Linux | FreeBSD | OS X | Docker | Applications
- Server monitoring architecture
- Site24x7 plugin integrations
- Resource checks | Configuration profiles | IT Automation
-
On this page
- Benefits
- What do I get to view
- Related Articles
