Performance Metrics for Monitoring Windows Servers
Measure critical performance metrics of your Windows servers including CPU, memory, disk utilization, services, processes and network traffic from a unified dashboard. Once the Windows agent is successfully installed, log in to the Site24x7 web client and navigate to Server > Server Monitor > Servers > click on the newly added monitor to view the performance metrics.
The Windows agent sends data to the Site24x7 data center using WMI queries. As the agent has to be downloaded and installed in your servers, learn more on how secure the agent is.
- Summary
- Services and processes
- CPU
- Memory
- Disks
- Network
- Plugins
- Checks
- Event logs
- Tools
- Add custom tab
- Root cause analysis (RCA) | Performance reports | Server inventory & health dashboards
- Licensing
Summary
Get visibility of all the important parameters of your Windows server performance in a single console. The heat map analysis gives you a quick summary on the status and performance of your server over the last seven days. You can view data for different time periods by choosing the appropriate time frame from the drop-down at the top right corner of the page. You can also export the performance details as CSV/PDF or send via email.
Click the icon ![]() to view the Performance Reports for metrics including CPU, memory, disk utilization, and more.
to view the Performance Reports for metrics including CPU, memory, disk utilization, and more.
CPU Utilization
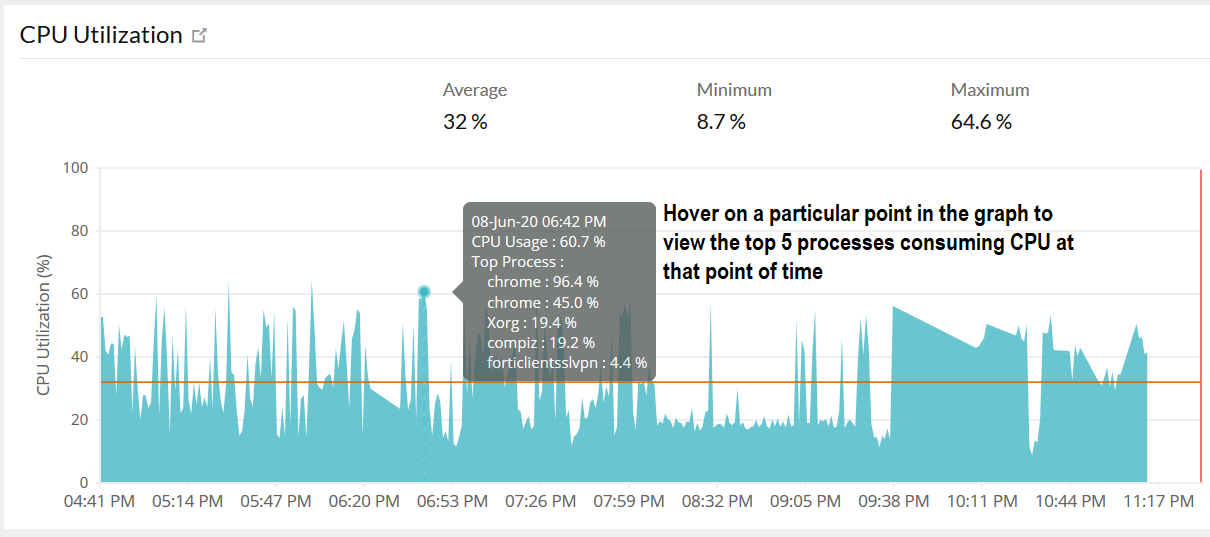
Regular monitoring of CPU usage is critical to analyzing the CPU load over a stipulated period and overcoming performance regressions.
However, not all high CPU usage is critical. Site24x7's feature that allows you view customized reports based on the period proves useful in identifying the CPU usage that is really problematic. This helps you drill down to the actual reason for a CPU spike. Based on the analysis, you can come up with solutions, like upgrading the CPU hardware, adding more CPUs, or shutting down frivolous services that are hogging these critical resources.
CPU Utility % and CPU Utilization are two distinct parameters. CPU Utility % is the amount of work the CPU is actually getting done compared to the same CPU running at its peak performance and without any idle time. CPU Utilization is the time it takes for the CPU to execute a non-idle process or thread.
The Performance Report (click on ![]() ) for CPU utilization lists the following metrics:
) for CPU utilization lists the following metrics:
- CPU utilization by cores
- Interrupts: The average number of hardware interrupts that the processor is receiving
- Context switches: The rate of switches from one thread to another—thread switches can occur either inside a single process or across processes
- Average CPU usage (%) per minute
Also, view the top five processes consuming CPUat a particular point in time by hovering over a point on the CPU Utilization graph.
The CPU utilization data is obtained from:
- PercentProcessorTime counter of Win32_PerfRawData_Counters_ProcessorInformation WMI class - For Windows Server 2008 R2 and above
- PercentProcessor Time counter of Win32_PerfRawData_PerfOS_Processor WMI class - For versions before Windows Server 2008 R2
The CPU Utility % data is obtained from the PercentProcessorTime counter of Win32_PerfRawData_Counters_ProcessorInformation WMI class (for Windows Server 2012 and above). This metric is not supported for OS versions below Windows Server 2012.
Navigate to the CPU tab to view more metrics.
Memory Utilization
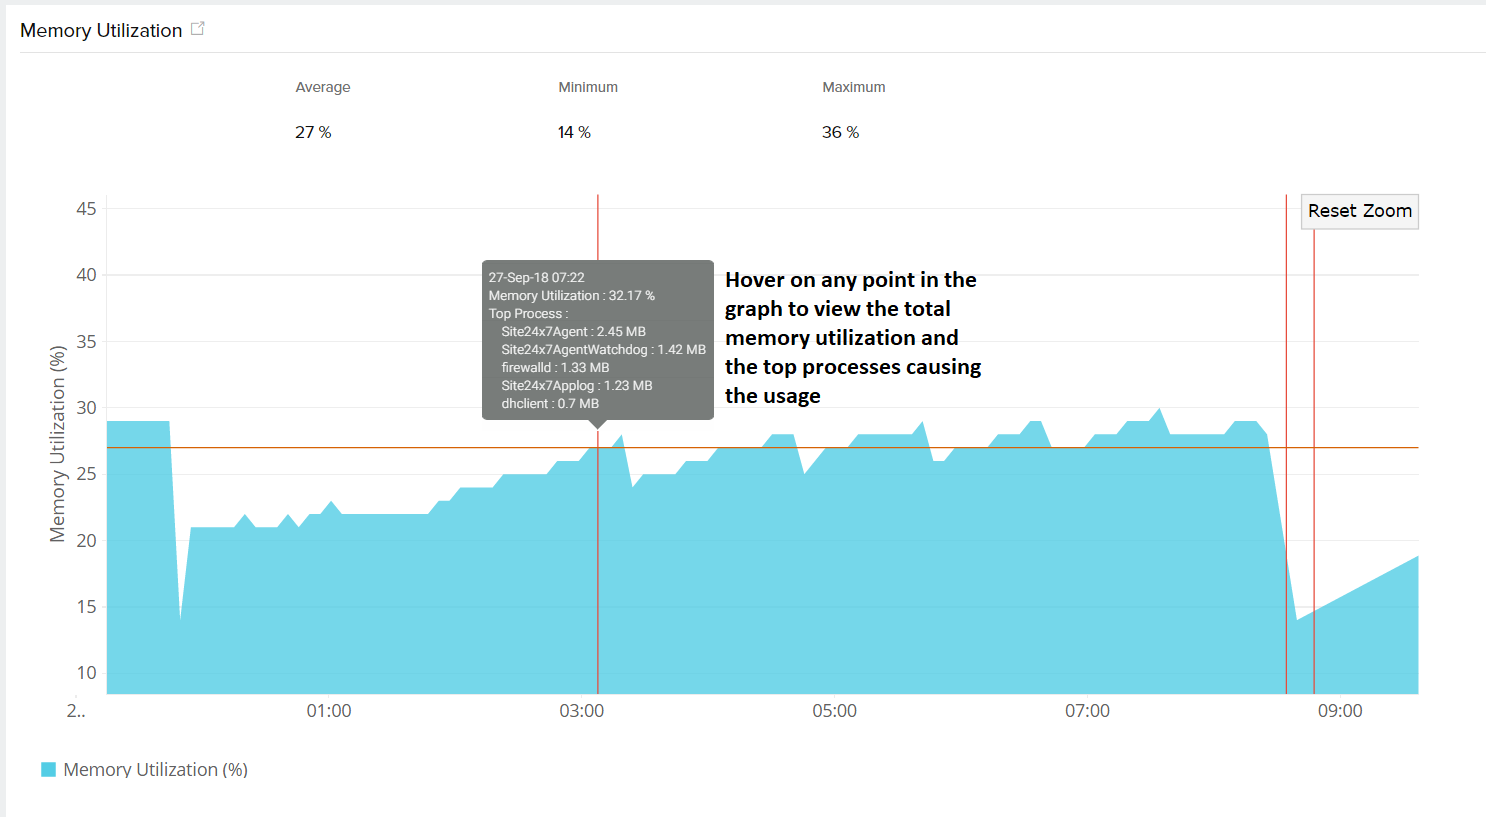
Monitoring memory usage helps you to identify underused servers and redistribute loads efffectively. This helps to detect server overloads before they cause a downtime or data loss. Know how the memory utilization is calculated for Windows servers.
The performance report (click on ![]() ) for memory utilization lists the following metrics:
) for memory utilization lists the following metrics:
- Swap memory utilization
- Memory used
- Memory break up of free physical memory and free swap memory
- Memory pages in - Number of pages read from disk to resolve hard page faults
- Memory pages out - Number of pages written to disk to free up space in physical memory
- Memory page faults - A page fault occurs when a process requires code or data that is not in its working set (its space in physical memory). Know how this metric is calculated.
- Average memory usage (%) per minute
Also, view the top five processes consuming memory for a particular point of time by hovering on a particular point in the Memory Utilization graph. The top process data is calculated using the WMI query 'Win32_PerfFormattedData_PerfProc_Process'.
Navigate to the Memory tab to view more metrics.
Memory Breakup
Get a split up of the free physical memory and free swap memory available in your Windows server. The less used files can be moved to the swap space until they are needed and new files can be swapped to the RAM. This helps to better plan and allocate resources to avoid server overload and data loss. Know how the memory utilization is calculated for Windows servers.

Navigate to the Memory tab to view more metrics.
Processor Queue Length
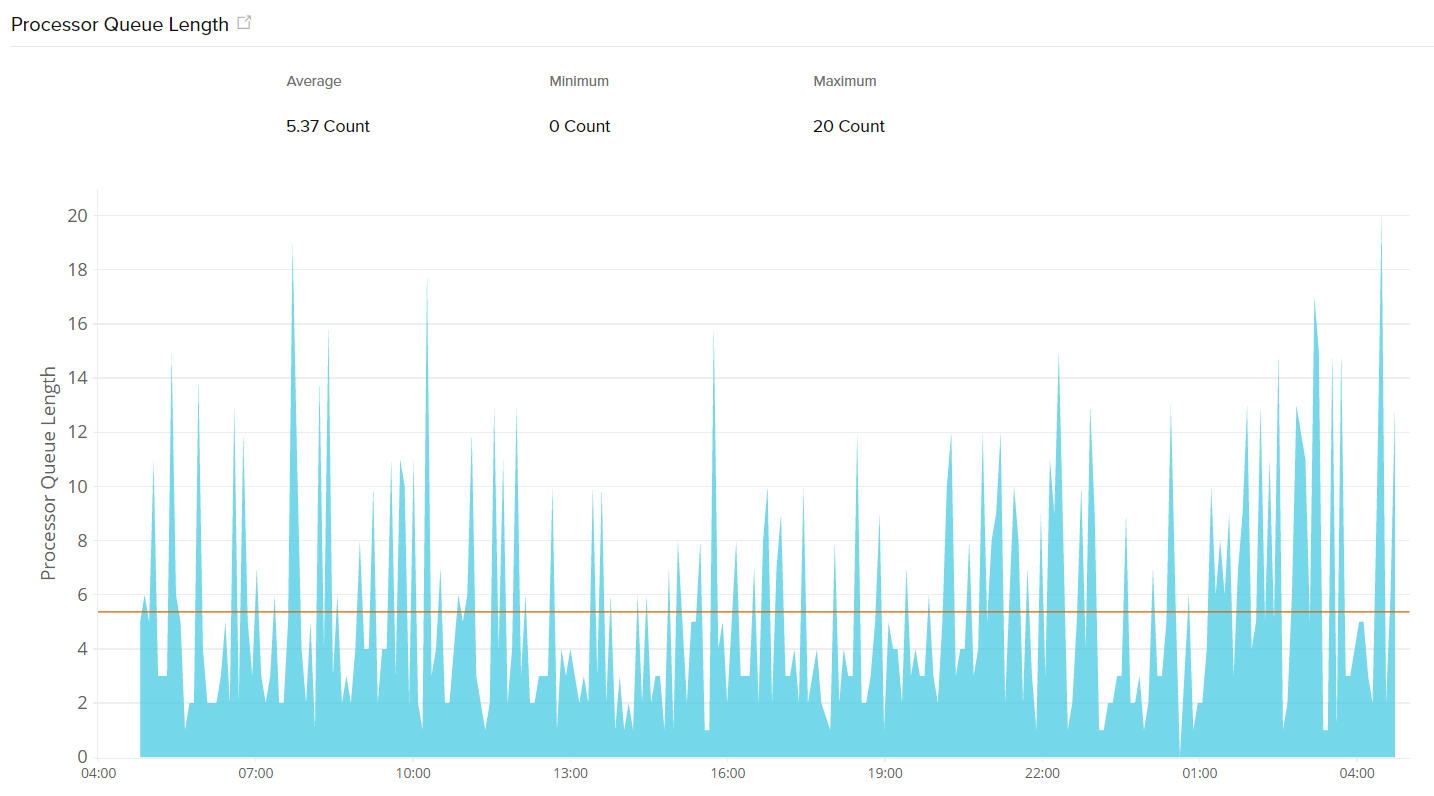
The system/processor queue length is the number of threads each processor is servicing. Continuous monitoring of the processor queue length can help indicate if there are more threads than the current processor can handle in an optimal way.
Network Throughput
The rate of data transfer across a network over a specific period. Regular monitoring aids in predicting future needs, ensuring your infrastructure can handle increased data loads without disruptions.
Disk Usage with Capacity Plan
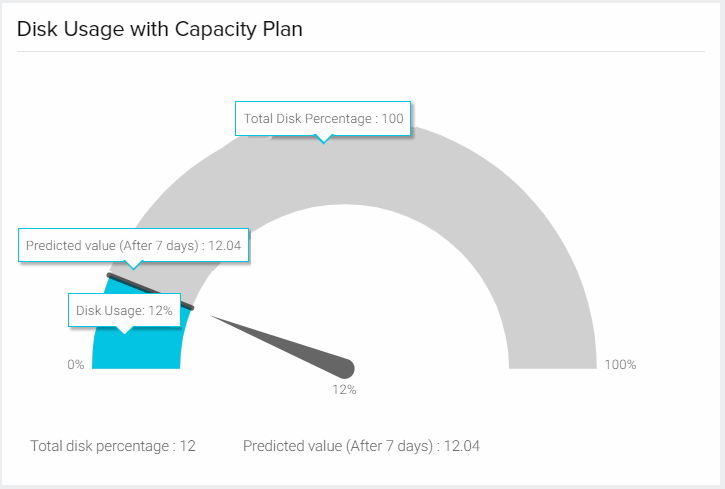
Get an idea of what your disk usage will be after seven days, based on your current disk usage. If the disk usage and predicted value are irregular or show a sudden spike, then it means there is some performance degradation issue in the usage and definitive action is required. Go to the Disks tab and check for the disk utilization of each partition and resolve the issue before it affects the overall performance of your server.
Navigate to the Disks tab to view more metrics.
Recent Events
Know the latest events in your server, categorized as Warning, Error, and Information etc. The data is refreshed after every poll and this helps in getting to know any abnormal increase in the number of error/warning events and take immediate action.
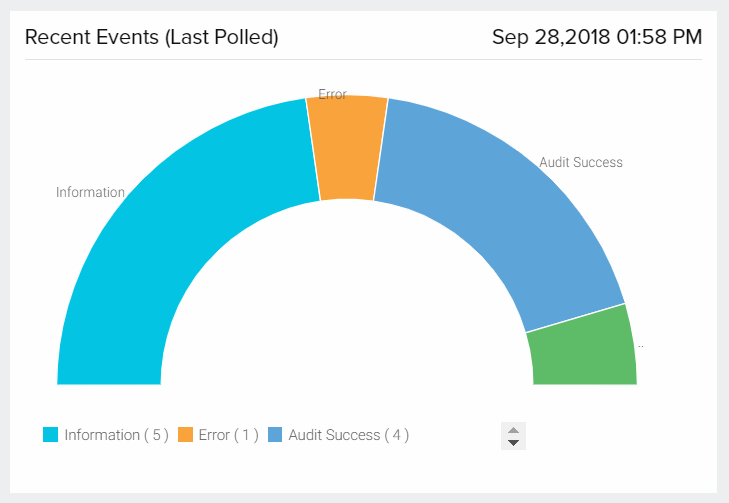
Top Process by CPU and Memory
View a list of top processes based on the CPU or memory usage in your server. Use the toggle button to choose between CPU and memory usage.
Application Details
The applications like IIS, SQL, Exchange, SharePoint, Active Directory will be listed (if they are running in your server) along with their respective monitor display names. Click on the monitor name to go to the respective application monitor's Summary page.
Down/Trouble History
The complete history of your server's DOWN and TROUBLE status is listed with the duration of the DOWN/TROUBLE period, reason for the outage, and the root cause analysis (RCA) details.
Services & Processes
Monitor the services and its associated processes running on your Windows server. In case you are unable to find the process that is running on your Windows server, use the Discover Services and Processes option to add them manually.
Find out more about the metrics for service and process monitoring and the management actions that can be performed. Individual thresholds for every service can be set by using the pencil icon under Action. Learn more.
CPU
Get complete data on the CPU utilization of your server.
| Metric Name | Description |
| System Idle Percentage | The percentage of system/server spent in the idle state |
| Interrupts and Context Switches | Average number of hardware interrupts that the processor is receiving and the rate of switches from one thread to another |
| CPU Utilization by Cores | The CPU utilization for all your central processing units or cores |
| CPU Utilization | The amount of work the CPU is handling at that particular time |
| CPU Utility % | The amount of work the CPU is completing when compared with the same CPU operating at its peak performance |
Memory
Get complete data on the memory utilization of your server. Know how the memory utilization is calculated for Windows servers.
| Metric Name | Description |
| Swap Memory Utilization | The total swap space available in the server (in percentage) |
| Memory Used | Total memory used by the server (in Bytes) |
| Memory Breakup | A split up of free physical and free swap memory |
| Memory Pages (In/Out/Fault) | Number of pages read from, written to the disk respectively and the number of page faults |
The metric memory page fault per second is calculated using Win32_PerfRawData_PerfOS_Memory WMI class and PageFaultsPersec counter type is PERF_COUNTER_COUNTER.
Disks
Closely monitor the disk usage and have a regular check on the availability of disk space in your servers. Check out the server disk partition report to view the used and free disk space across servers in your account.
| Metric Name | Description |
| Disk Partition Details & Usage Forecasting | A tabular view of the used and free disk space (in MB and percentage). Click on the values to go to a detailed performance report for each partition. Click on the pencil icon under Action to set thresholds for each of these partitions. You can also choose to Skip Alert for any partition using the pencil icon. |
| Average Disk Utilization (%) | The free and used disk space (in percentage) available in your server |
| Disk (I/O) | The read and write operations performed in the disk |
| Partition Disk I/O | The read and write operations performed in every partition |
| Current Individual Disk Utilization (%) | The most recent (last polled) utilization of individual disk partitions |
| Overall Disk Utilization | The total disk usage and free space available in GB |
| Disk Idle and Busy Percentage | Displays the percentage of time that the disk was idle (Disk Idle Percentage) and the percentage of elapsed time that the selected disk drive was busy servicing read or write requests (Disk Busy Percentage). |
| Average Disk Queue Length | Represents the average number of input and output (I/O) requests waiting in the command queue for the disk device. This metric is used for assessing disk performance and responsiveness. |
| Read Latency | The time delay in accessing data from a disk storage device. |
| Write Latency | The time taken to save or write data to a disk storage device. |
| Status | Indicates whether the disk partition is available (Up) or not connected/removed (Down). In case of threshold breaches, the status will reflect the configured alert severity of the disk. |
Under Disk Partition Details & Usage Forecasting, click on the Rediscover button to discover disk partitions and add them for monitoring. Click on the Bulk Action button to set thresholds for multiple disk partitions in one go.
If you wish to specify a threshold value for a particular partition, click on the pencil icon beside the partition's name under Action. Multiple threshold values can be set for a single partition for the conditions >, <, =, >=, <= and in Bytes, KB, MB, GB, and TB. You can choose to get a Trouble or Critical alert when a breach is detected.
Learn more on how alerting works when disk utilization thresholds reach beyond their configured values.
Network
In this tab, you can view the following network statistics:
- A graphical representation of Packets Sent, Packets Received, Data Sent, Data Received, and Network Throughput.
- Overall network details based on connection type, including:
- Network Interface Name
- Maximum interface speed
- Status
- Data Sent
- Data Received
- Bandwidth usage
- Packets Sent
- Packets Received
- Error packets
- Detailed information for individual network interfaces, including:
- Network Interface Name
- Adapter Name
- MAC Address
- IPv4 Address
- IPv6 address
Click on an individual metric value (like data sent, bandwidth, or packets received) under Network to get a graphical representation of the performance data. You can set individual threshold values to the network interfaces for the conditions >, <, =, >=, <= using the pencil icon under Action.
Set thresholds for multiple network interfaces in one go using the Bulk Action button. Click on the Rediscover button to discover network interfaces and add them for monitoring. If you want to have a consolidated report of critical network adapters across servers, check out the network adapter report.
A network interface/adapter will be added for every unique MAC address. If more than one interface has the same MAC address, then only one interface will be added and the rest will be ignored.
Plugins
Customize and monitor data specifically tailored to your needs using Site24x7's plugin integrations. Use our ready-to-install 50+ plugin integrations or write your own plugin using VB, PowerShell, Batch or DLL. You can also set thresholds to individual attributes and get alerted when there is a threshold breach.
| Parameter | Description |
| Plugin Name | Name of the plugin monitor |
|
Status |
Tells you if the plugin is in the UP or DOWN state |
| Version | This is a mandatory field denoting the version number of the plugin. If the user wants to add/modify/delete attributes, the plugin version needs to be changed to create a new template. Know under what conditions the plugin version needs to be changed |
| Template Name | Name of the plugin template that has the list of attributes to be monitored. Know how to configure a template. |
| Attributes | The total number of attributes listed under that plugin |
| Performance Attribute | While setting up the plugin template, decide which attribute has to be listed in the main Summary page, in the log report and in the main plugin monitors listing page. Learn more |
| Action | You can edit or delete the plugin monitor |
Inventory
Get complete visibility on the installation/deletion status of your plugin monitors, possible error messages while executing your plugin scripts and tips to troubleshoot them. The data under Inventory will be updated only when there is a change in the plugin folder structure.
| Parameter | Description |
| Plugin Name | Name of the plugin monitor |
| Status | Status of the plugin monitor - whether installed or if there is any configuration error |
| Message | Installation update on the plugin monitor. If there is any error, the reason for the failure is described |
| Plan of Action | Troubleshooting steps to perform if there is any error. If the plugin installation is successful, the next steps to perform is listed. |
| Action | In case there is a plugin installation failure, click on the icon to re-register the plugin and try installing it again |
Resource Checks
Monitor internal resources like files, directories, event logs, URLs, and ports in your Windows server. Click on Create/Edit Resource Check Profile to create/edit resource checks. You can also go to the Admin tab in the Site24x7 web client and click on Server Monitor > Resource Check Profile to add a resource for monitoring. The following internal resources are supported for monitoring:
- File & Directory monitoring
- Access check
- Permissions check
- Size check
- Last modified check (only for files)
- Content check (only for files)
- Subdirectory availability (only for directories)
- File availability (only for directories)
- URL and Port monitoring
- Event log monitoring
Event Logs
Event Logs provide ample amount of data laid out in a graphical format detailing downtime, performance drops, and security infringements. Detailed metrics on logging program messages and process severity can be extrapolated from the Event Logs graph. The user can also check for specific keywords and their occurrences in event logs. The events can be filtered by ID and source to get notified instantly when unexpected behavior occurs.

Tools
Manage various actions and carry out tasks at ease and all in one place using Server Tools. You can also navigate via Server > Server Monitor > Server Tools > select your Windows server from the drop-down.
I. Event Logs
You can view event logs based on the event type (All, Error, Information, Warning) for specific time periods. The format for selecting the time period is DD/MM/YYYY | HH:MM.
For eg., to see the event logs from July 01st to July 02nd 2017 from 06:11 to 06:41 for the event type Information, set the conditions as shown below in the screenshot:
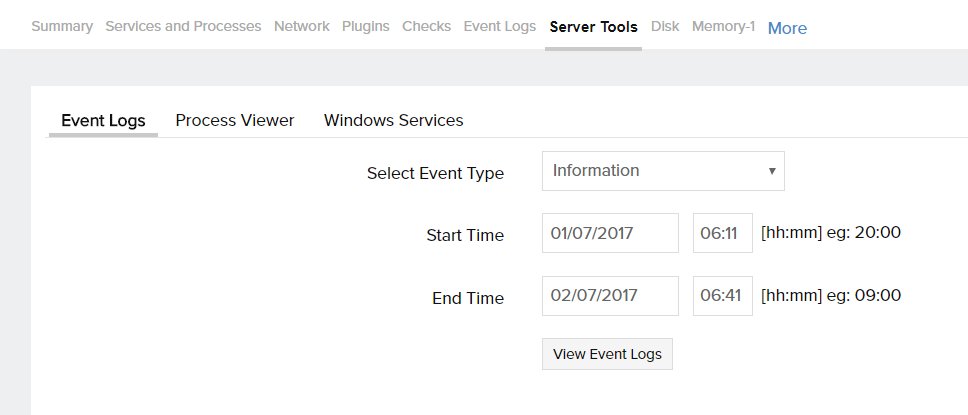
Click on a log entry to see its associated server, the event code, and the respective message based on the event type.
Process Viewer
Get the complete list of services and processes running on your server with their CPU (%), memory (%) usage, handle count, thread count, and instances. You can search for any particular process in the Search Bar at the top (highlighted in green in the screenshot below) and use the +Add option to add that process for monitoring (highlighted in blue in the screenshot below). Click on a process name to get its PID, execution path, and the arguments passed (highlighted in grey in the screenshot below).

Service Viewer
Get the complete list of services running on your server with their associated process, current state (stopped or running), and start mode (manual or auto). You can search for a service in the Search Bar at the top (highlighted in green in the screenshot below), use the +Add option to add that service for monitoring (highlighted in blue in the screenshot below), and start/stop the service under Action - all in one place. Click on a service to get its name, execution path, and the arguments passed (highlighted in grey in the screenshot below).
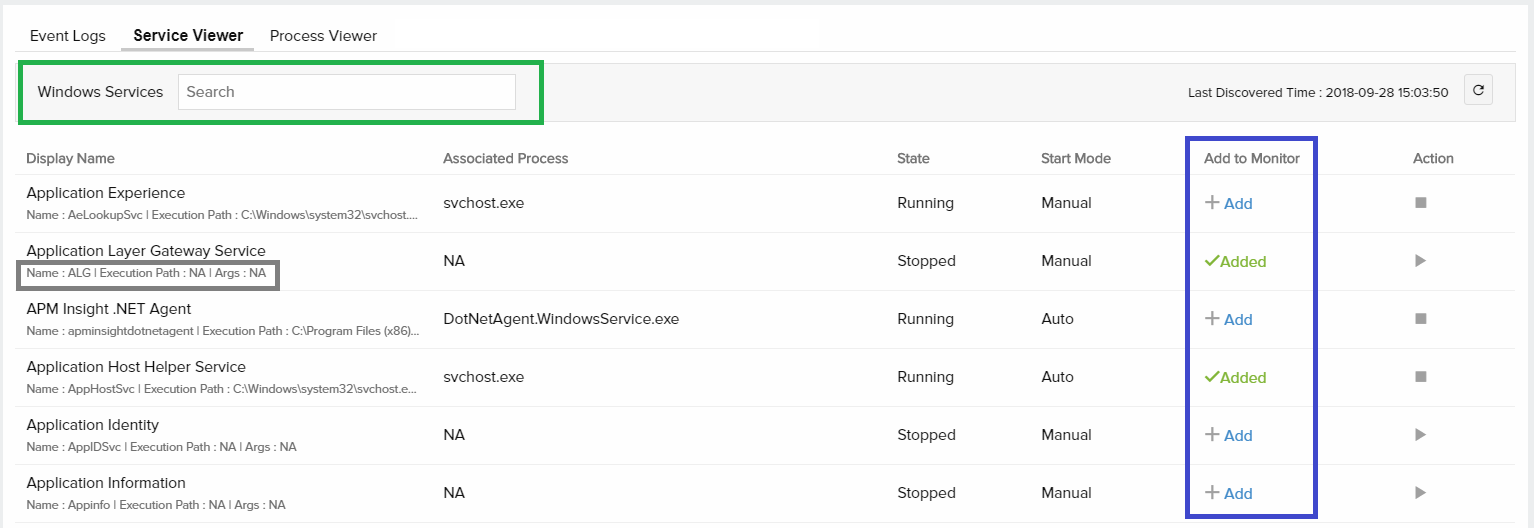
Add Custom Tab
Create your own tab and monitor the performance metrics you need.
Steps to add a customized view:
- Click on the Add Custom Tab button.
- Provide a Display Name for identification purposes.
- Select the metrics that you wish to view and monitor under this view.
- Save your changes.
- Click on More > click on the custom dashboard that you created.
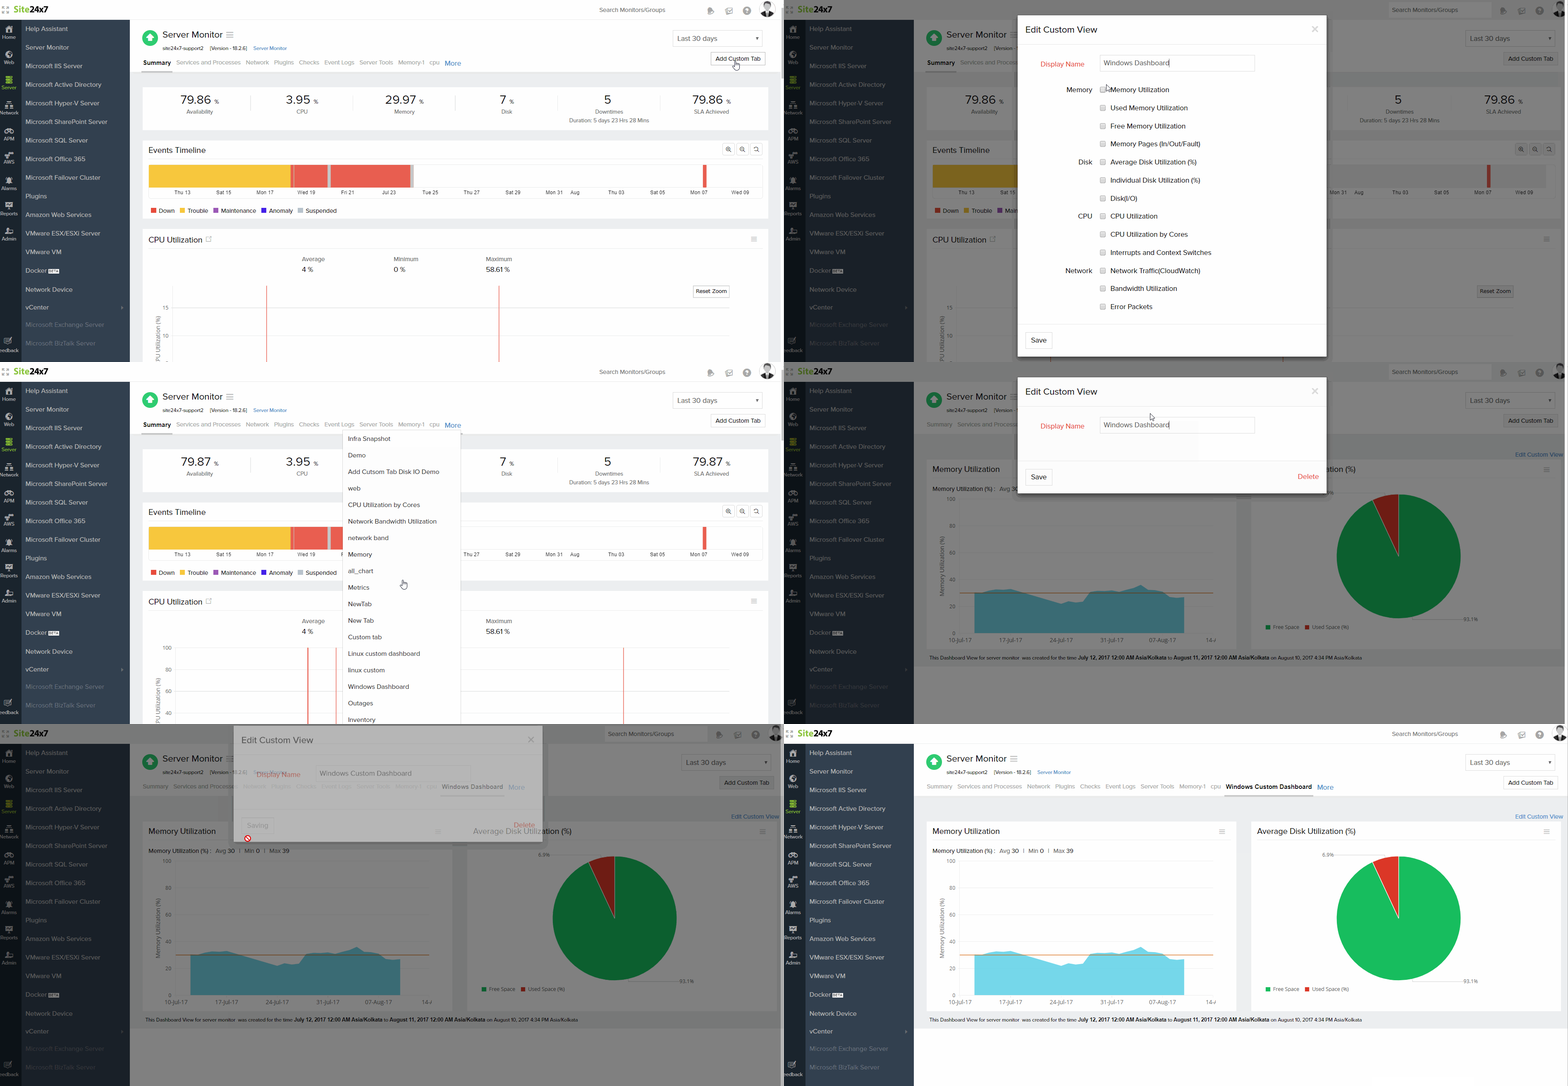
You can edit the display name or delete a custom view by clicking on Edit Custom View.
Root Cause Analysis
Every time a downtime is detected, a Root Cause Analysis report (RCA) is triggered and sent to the user based on the alerting contact and medium. The RCA generated for Windows server monitor provides the actual reason behind the downtime, along with the trace route map to diagnose connectivity issues.
Performance Reports
Log in to Site24x7 and go to Reports > Server Monitor to access performance reports for server monitoring. In addition to the common reports available for all monitor types in Site24x7, server monitoring has some exclusive reports on disk usage, network adapter details, agent inventory, and top n reports for CPU, memory, and disk. Learn more.
Server Inventory & Health Dashboards
Get complete view of your entire server environment with our intuitive dashboards.
- Inventory Dashboard - Displays a count of all your servers, applications, resource checks, plugins and more.
- Health Dashboard - Know the current count and status of all the servers, plugins, and apps in your account.
Licensing
Know the license consumption details of Windows server monitor in our infrastructure monitoring license help document.Know what metrics you get per Windows server monitor. Learn more.
