Performance Metrics of FreeBSD Server Monitor
Interpret FreeBSD Server Monitoring Results
Monitoring your FreeBSD monitor lets you track and measure important metrics including CPU, memory, disk utilization, network traffic and more from a custmizable and unified console.
Know how to add a FreeBSD monitor. Learn more on the server monitoring architecture
Various parameters and metrics can be obtained by accessing the following tabs:
- Device Snapshot
- Processes
- Network Statistics
- Resource Checks
- Sys Logs
- Process Viewer
- Add a custom view
Device Snapshot:
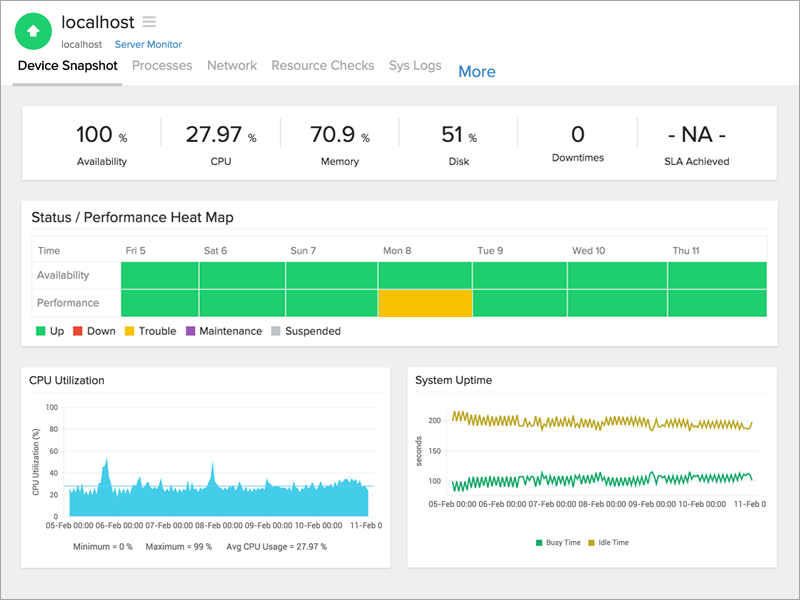
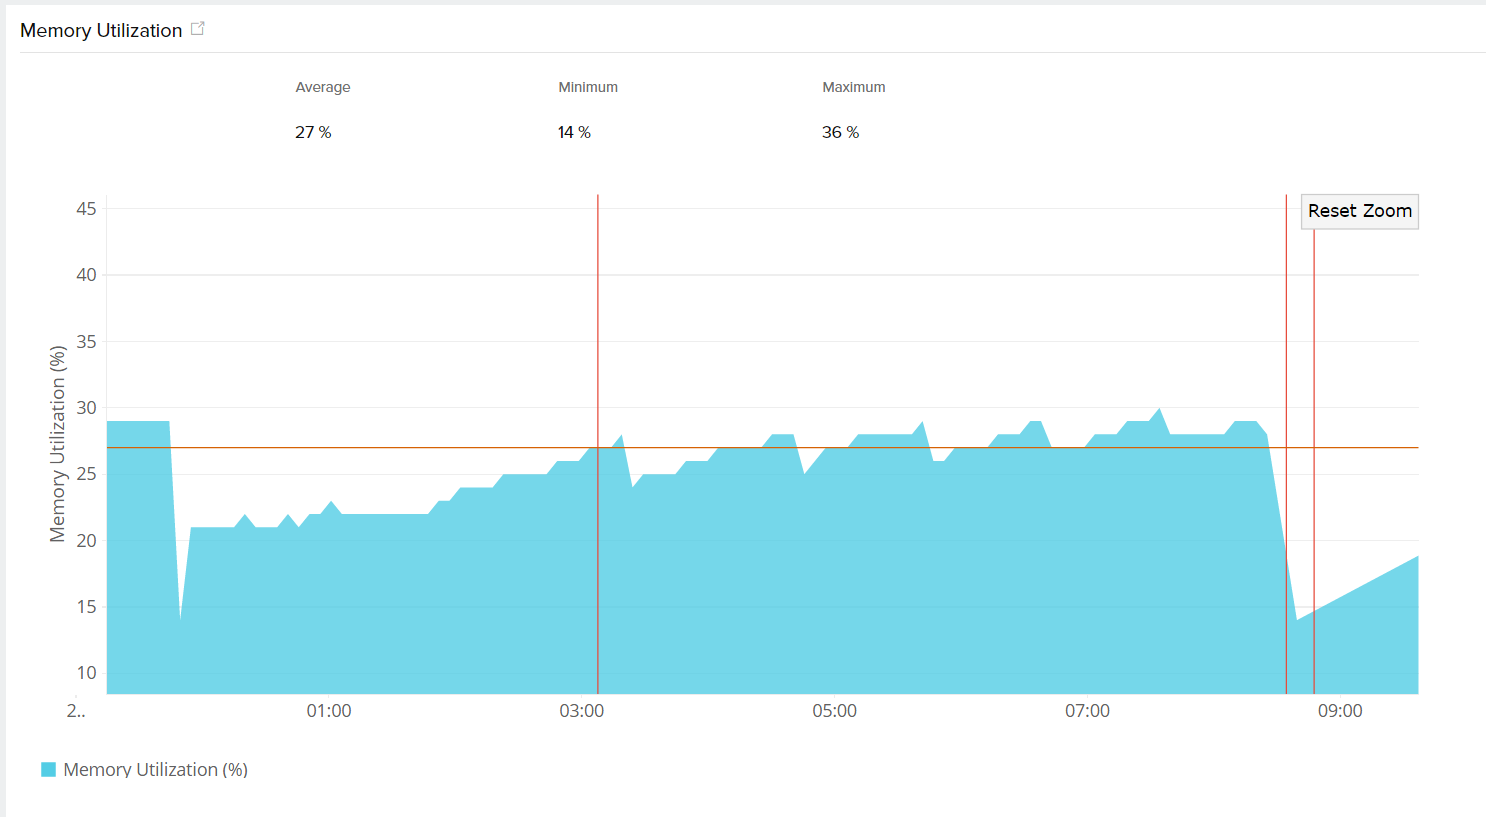
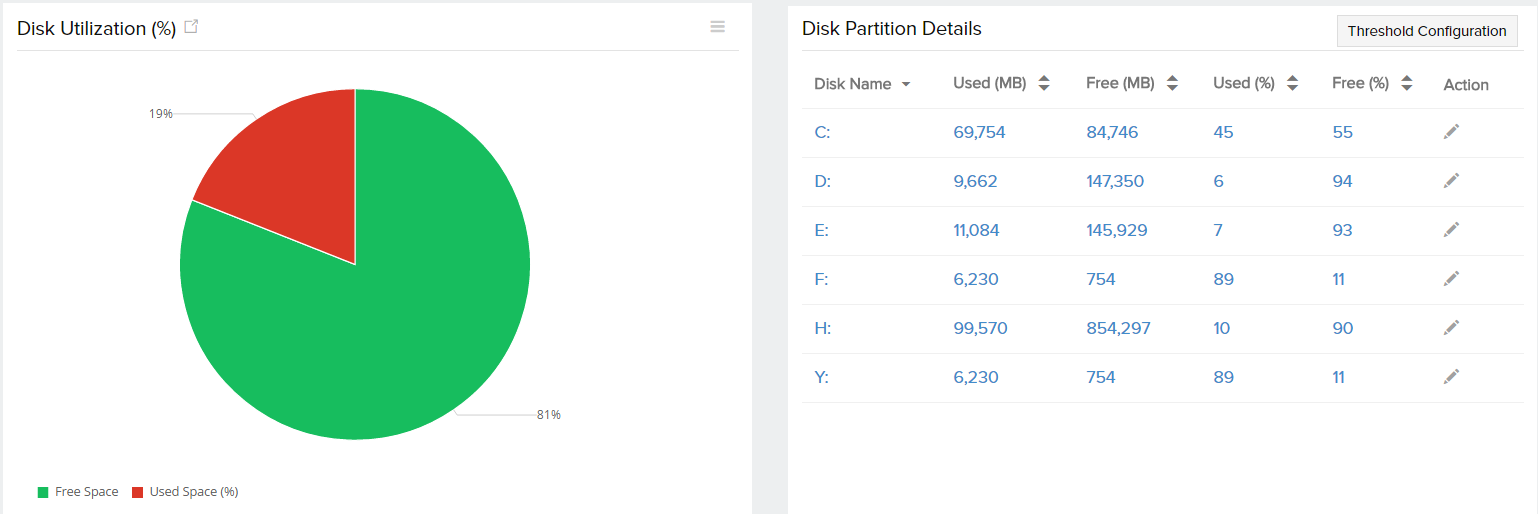
In-depth analysis and study can be made for every parameter listed under the Device Snapshot tab. By clicking on the desired parameter, a detailed synopsis opens up in a new window, which can be sent as an email or exported as a PDF/CSV file. Reports can also be generated for a specific time period, by using the drop down on the top left corner of the page.
Memory Breakup/Memory Utilization
Disk Utilization
Asset Details:
| Parameters | Description |
| Host Name | Name of the system |
| IP Address | The IP address of the host machine |
| Operating System | Name of the OS running in the instance |
| OS Architecture | Specifies the underlying OS architecture - 32 bit or 64 bit |
| Installed Memory | The physical memory of the server in MB |
| Number of CPU Cores | The number of available CPU cores |
| Processor | Name and description of the processor |
Processes:
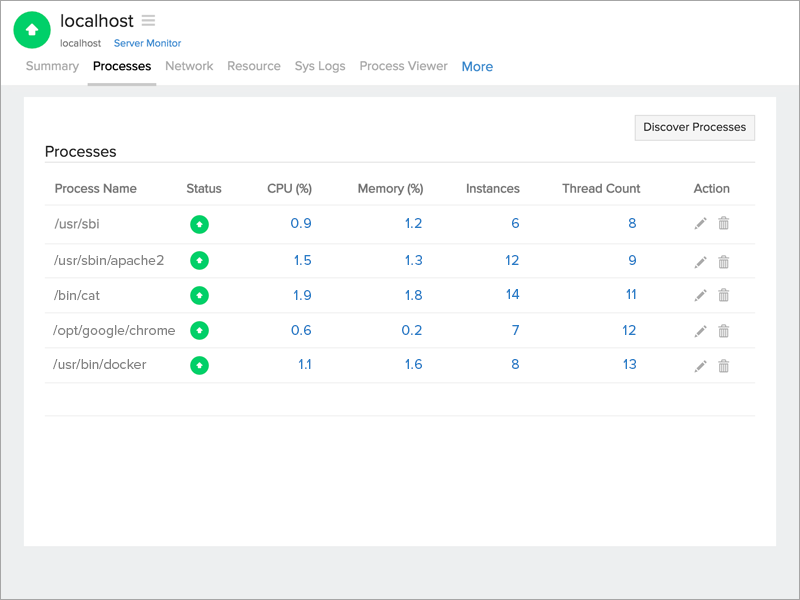
The various processes associated with FreeBSD are detailed under this section, along with the following metrics:
| Parameters | Description |
| Process Name | Name of the process |
| Status | Status of the process, it is up or down |
| CPU (%) | The percentage of CPU used by a particular process |
| Memory (%) | The percentage of memory used by a particular process |
| Instances | The number of running instances in a process |
| Thread Count | No of threads created by a process |
| Action | Set thresholds or delete a particular process |
Network Statistics:
This section provides a complete description on the input and output traffic, in addition to the bandwidth utilization for both input and output traffic. Clicking on the traffic icons will generate individual reports on the error/discarded packets and packets traffic.
| Parameters | Description |
| Network Interface Card Name | Name of the card |
| Speed | Bandwidth of the interface |
| Data Sent | Amount of data sent by the interface per poll |
| Data Received | Amount of data received by the interface |
| Packets Sent | Number of packets sent by the interface |
| Packets Received | Number of packets received by the interface |
You can also set individual threshold values to the network interfaces added
Resource Checks:
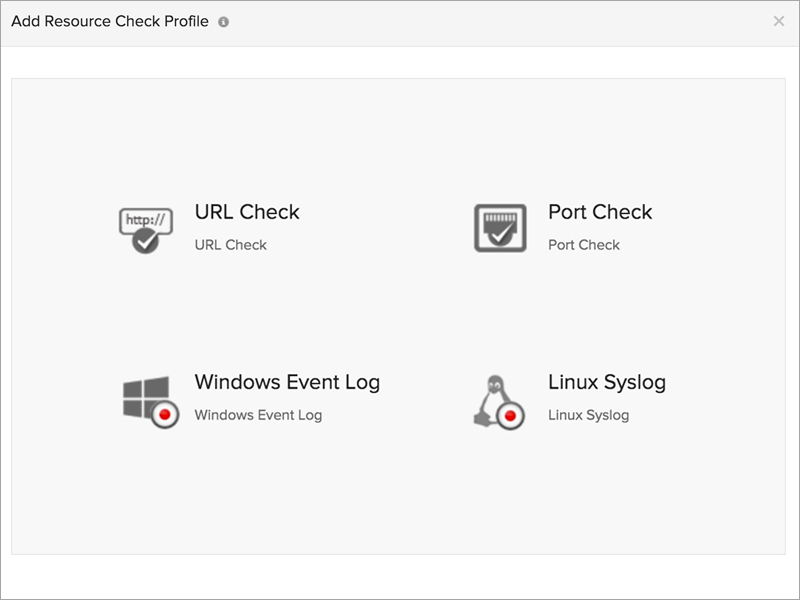
Gather inputs on url, port, sys log checks and configure thresholds to be alerted when a check fails. New/existing checks can be added/edited using the Edit Resource Check Profile option on the right corner of the page. To know more on how to add/edit/modify a resource check, click here.
| Parameters | Description |
| Check Name | Name of the resource check |
| Status | Tells if the check is up or down |
| Check Type | Specifies the type of resouce check configured |
| Resource Monitored | Details about the check |
Sys Logs:
Information on severity, log types, and events by source can be collected, which can be used for analyzing performance drops, downtimes, and security infringements. The graphical data aids in understanding the logging program messages and process severity. The data can be obtained based on a hourly or daily basis.
Process Viewer:
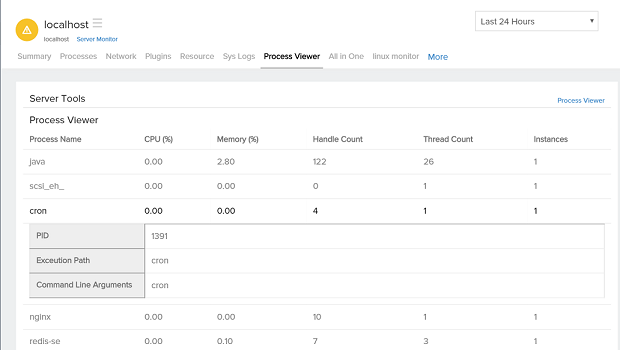
The various processes on the server monitor can be studied using the Process Viewer. Hovering the mouse on the process name lists their respective PID, Execution Path, and Command Line Arguments. Sort the processes based on CPU, memory handle, and thread count.
Customizable reports:
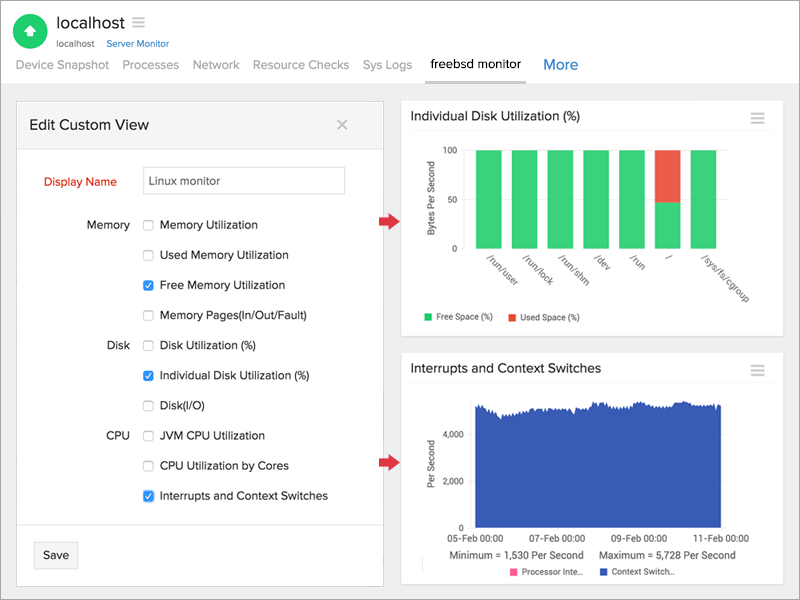
Users can create reports based on their preference by clicking on the desired metric and access the icon. Here, you can select the required parameters based on memory, disk, and CPU.
