Web Transaction (Browser)
Web Transaction (Browser) enables you to monitor the availability and performance of your web transactions using an actual web browser. To check the end-user experience, a robust recorder tool records the web transactions and then plays them back via a real browser such as Firefox or Chrome. You can carry out all the testing from our 130 global monitoring locations or a private location (using an On-Premise Poller).
The Intelligent Capture functionality in the Web Transaction (Browser) monitor learns about changes made to any user interactive element in a webpage and updates the scripts accordingly. When you change attributes such as ID, name, CSS, or xpath of a user-interactive element, you do not have to re-record or update the changes. For example, say a sign-up action on your webpage has been captured. Then, for optimization, if you decide to modify the button’s name, ID, or xpath, you can update the changes without having to re-record the action. You can import the Selenium-based test cases into the recorder tool to set up a Web Transaction (Browser) - Selenium WebDriver monitor.
You can use the SaaS Synthetics (Browser) monitor to track the availability and performance of SaaS-based applications, such as Microsoft Outlook, Microsoft Teams, Salesforce, and Microsoft Dynamics 365. This monitor involves monitoring metrics and ensuring the efficient operation of your SaaS applications.
How does it work?
- Record your transactions: Record your browser-based web transactions with the Web Transaction (Browser) monitor, which records the user interactions in your web application in their exact sequence and notifies you when any error is detected.
- Record using the Edge or Chrome browser directly.
- Record using the Firefox browser by installing the recorder add-ons.
- Save your transactions: Save your transactions for monitoring once the transactions are recorded. A maximum of 20 transaction steps can be recorded. Site24x7 will then keep simulating these actions continuously, scanning for any sign of trouble.
NoteYou can record up to 20 steps with an advanced license.
- Edit your transactions: Modify or edit your transactions later through the monitor form, where you can delete or modify steps. Alternatively, use the Edit Web Script option to edit the script directly. You can also update the monitor by completely re-recording it.
You can import Selenium IDE-based test cases in the .side format into your recorder to set up a Web Transaction (Browser) with Selenium WebDriver monitor. - Set alerts and visualize the data: Set custom thresholds, receive real-time alerts, and gain quick insights into the application performance with our intuitive dashboard.
Use case
The Zylker booking system is designed to assist customers in booking flight tickets. The company faced an issue while booking a customer's ticket and aimed to ensure a smooth process from login to payment to avoid any inconvenience for their customers.
The Web Transaction (Browser) monitor helped solve their problem by troubleshooting the transaction flow from login to payment and making necessary modifications to improve the application's performance. Additionally, this monitoring tool has helped ensure the website remains available, especially during busy periods.
Add a Web Transaction (Browser)
-
Adding web transactions for Chrome and Edge
To begin recording the transactions, start by installing the Web Transaction (Browser) recorder. To install the recorder:-
- Log in to Site24x7.
- Navigate to Home > Monitors > Click on the + button.
- Click Web Transaction (Browser) monitor.
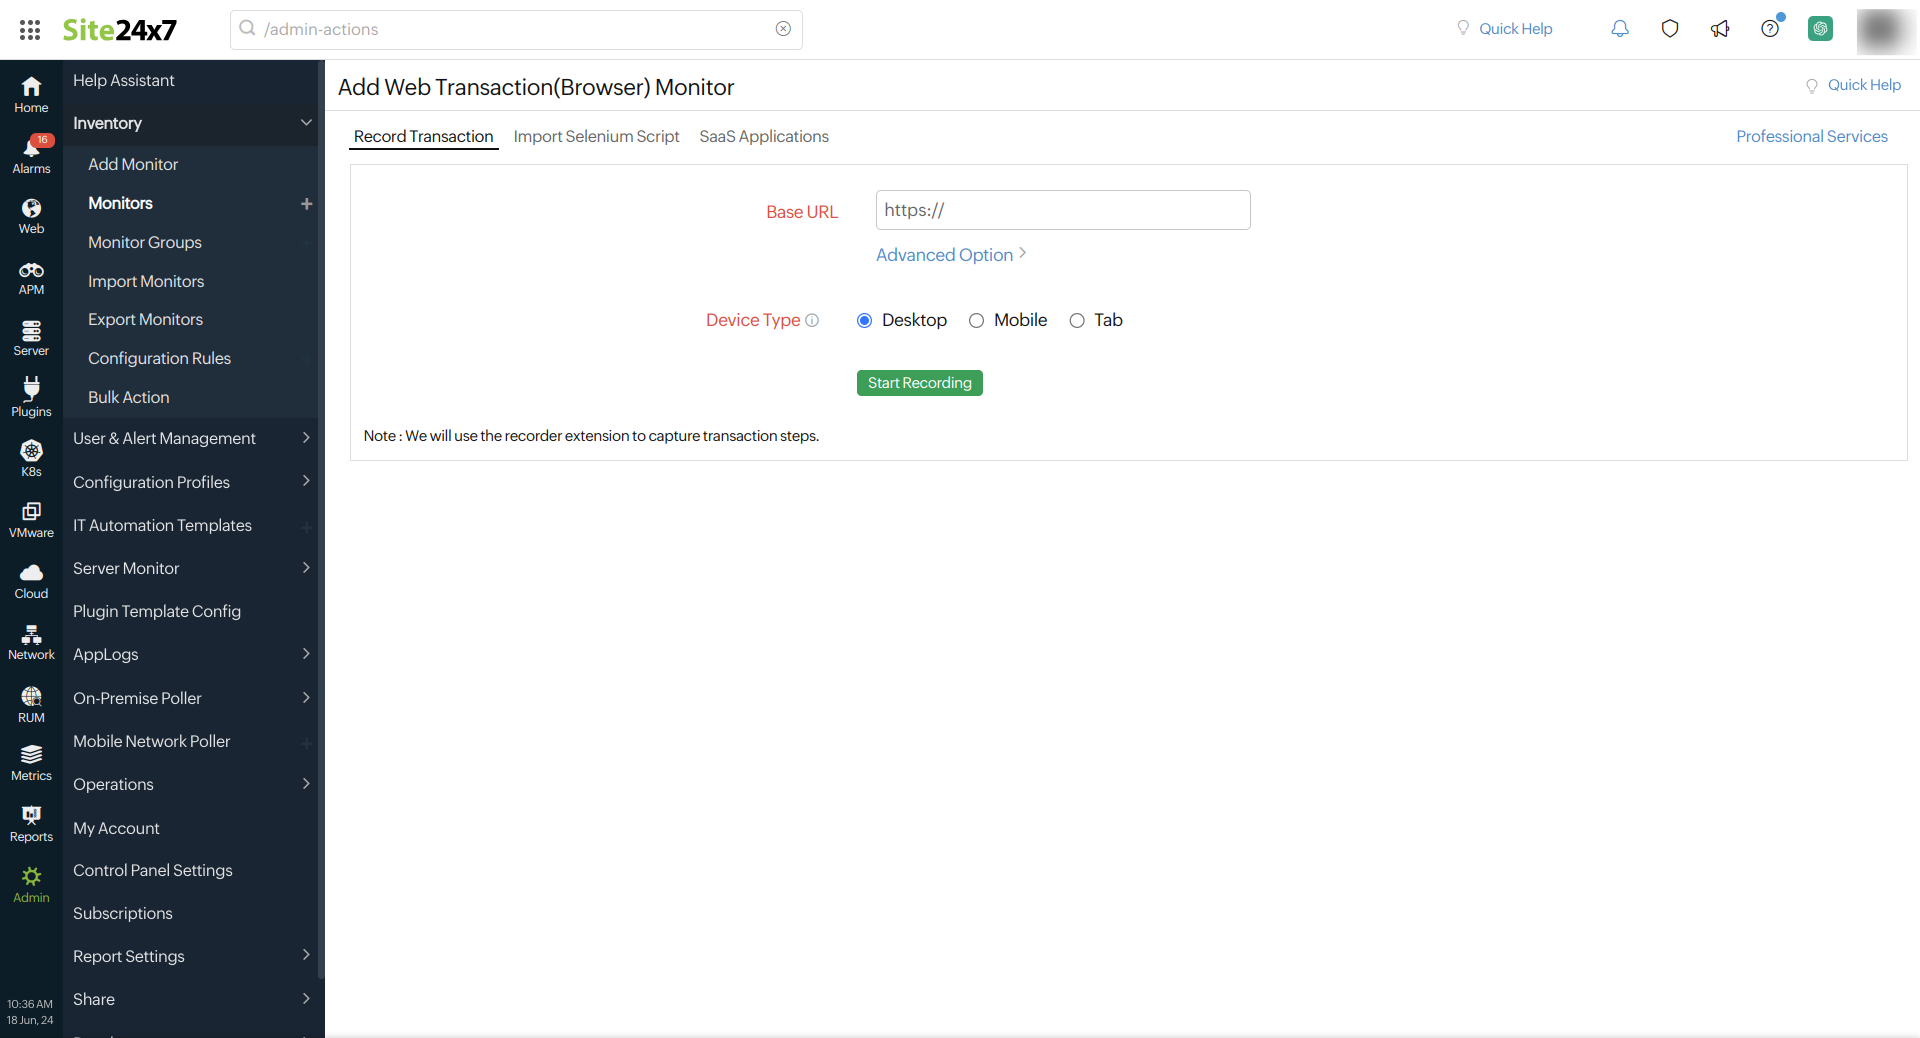
- Provide the following details in the Record Transaction section.
- Base URL: Base URL is the URL for which you're creating the monitor.
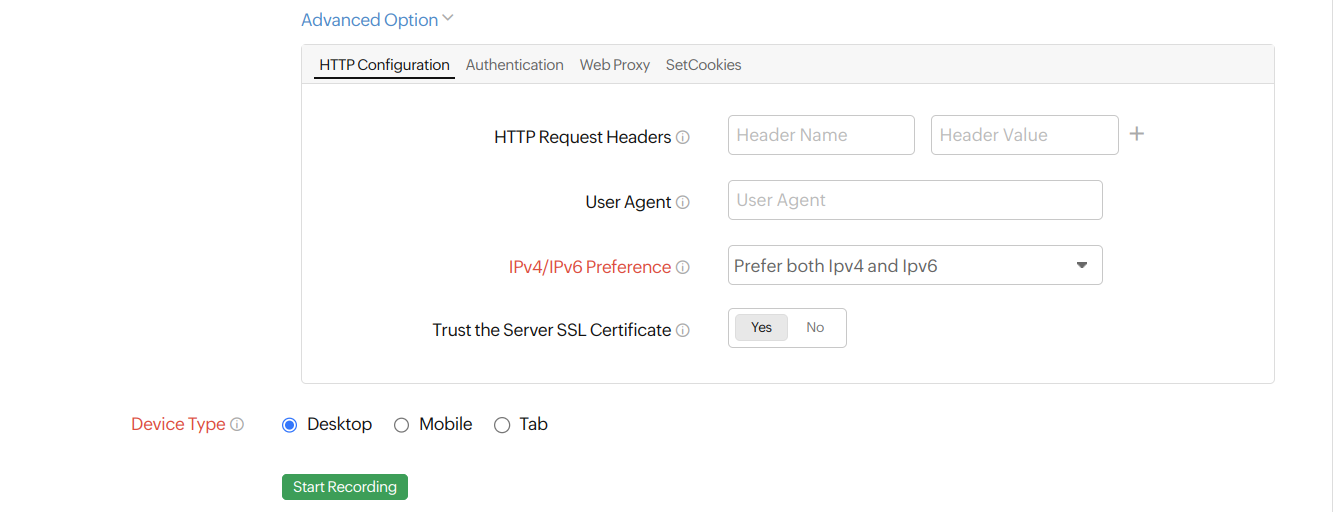
- Click the Advanced Option link to set various configurations and thresholds for the monitor you're configuring.
- HTTP configurations:
- HTTP Request Headers: If you want to customize the default HTTP request header information, the additional header name and header value can be added here.
Note
To use a credential profile in HTTP Configurations, type $ and a list of available credential profiles will appear—select the desired one from this list. Learn more about credential profiles.
- User Agent: Configure a customized user agent (web browser) for sending your request and the HTTP headers to data collection.
Learn more about browser versions used in the Synthetic Web Transaction (Browser) monitor. - Trust the Server SSL Certificate: Choose Yes to accept the certificate and ignore the validation error. You can choose No to validate the certificate and get alerted when the validation fails.
- HTTP Request Headers: If you want to customize the default HTTP request header information, the additional header name and header value can be added here.
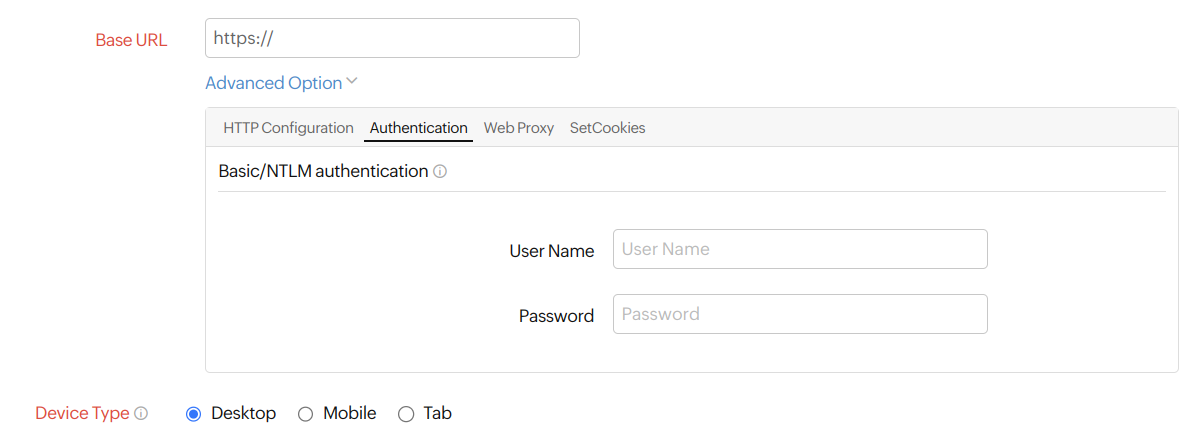
- Authentication:
- Basic/NTML Credentials: Basic/Windows NT LAN Manager (NTLM) is the authentication method used to access a service URL. Basic authentication is a simple method where the username and password are encoded as base64. NTLM is a secure method of authentication that allows users to authenticate without sending the password over the network.
Submit the credentials to be used for the authentication method of your choice. Provide the User Name and Password.
- Basic/NTML Credentials: Basic/Windows NT LAN Manager (NTLM) is the authentication method used to access a service URL. Basic authentication is a simple method where the username and password are encoded as base64. NTLM is a secure method of authentication that allows users to authenticate without sending the password over the network.
- Web Proxy:
A web proxy is an intermediate server that stands between the web client (i.e., browser) and the web server. The client sends requests to the web proxy, and the server responds to the client through the web proxy, which helps increase security.
- A proxy URL acts as an intermediary between the client and the server. Provide the Web Proxy URL, User Name, and Password.
- SetCookies:
HTTP cookies are designed for web browsers to track, personalize, and store information about each user session.
- Cookie Name and Cookie Value: Provide your cookie name and value for setting up the cookies.

- Cookie Name and Cookie Value: Provide your cookie name and value for setting up the cookies.
- HTTP configurations:
- Device Type: Choose the device resolution for which you'd like to check the transactions out of the options provided.
- Click the Install Recorder button. If you've already installed the recorder, click the Start Recording button.
Once the recording is done, you can click the Stop Recording button to stop the recording.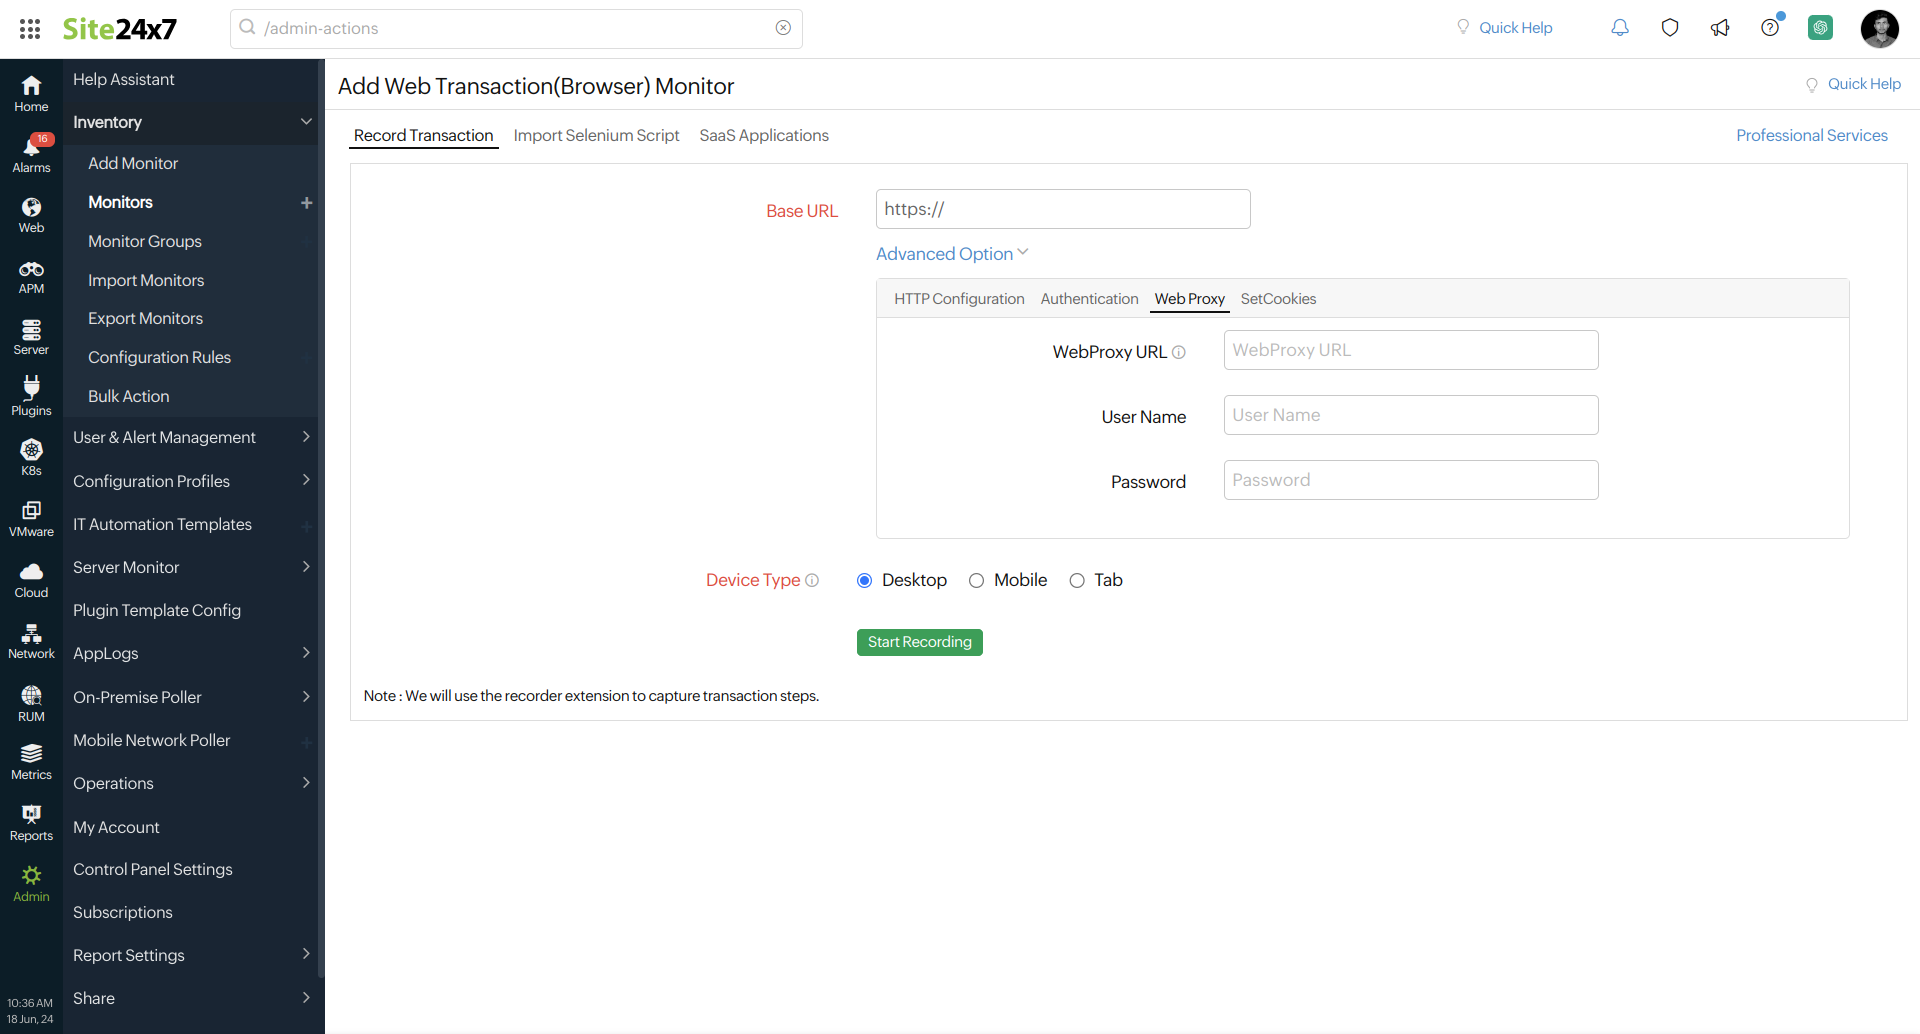
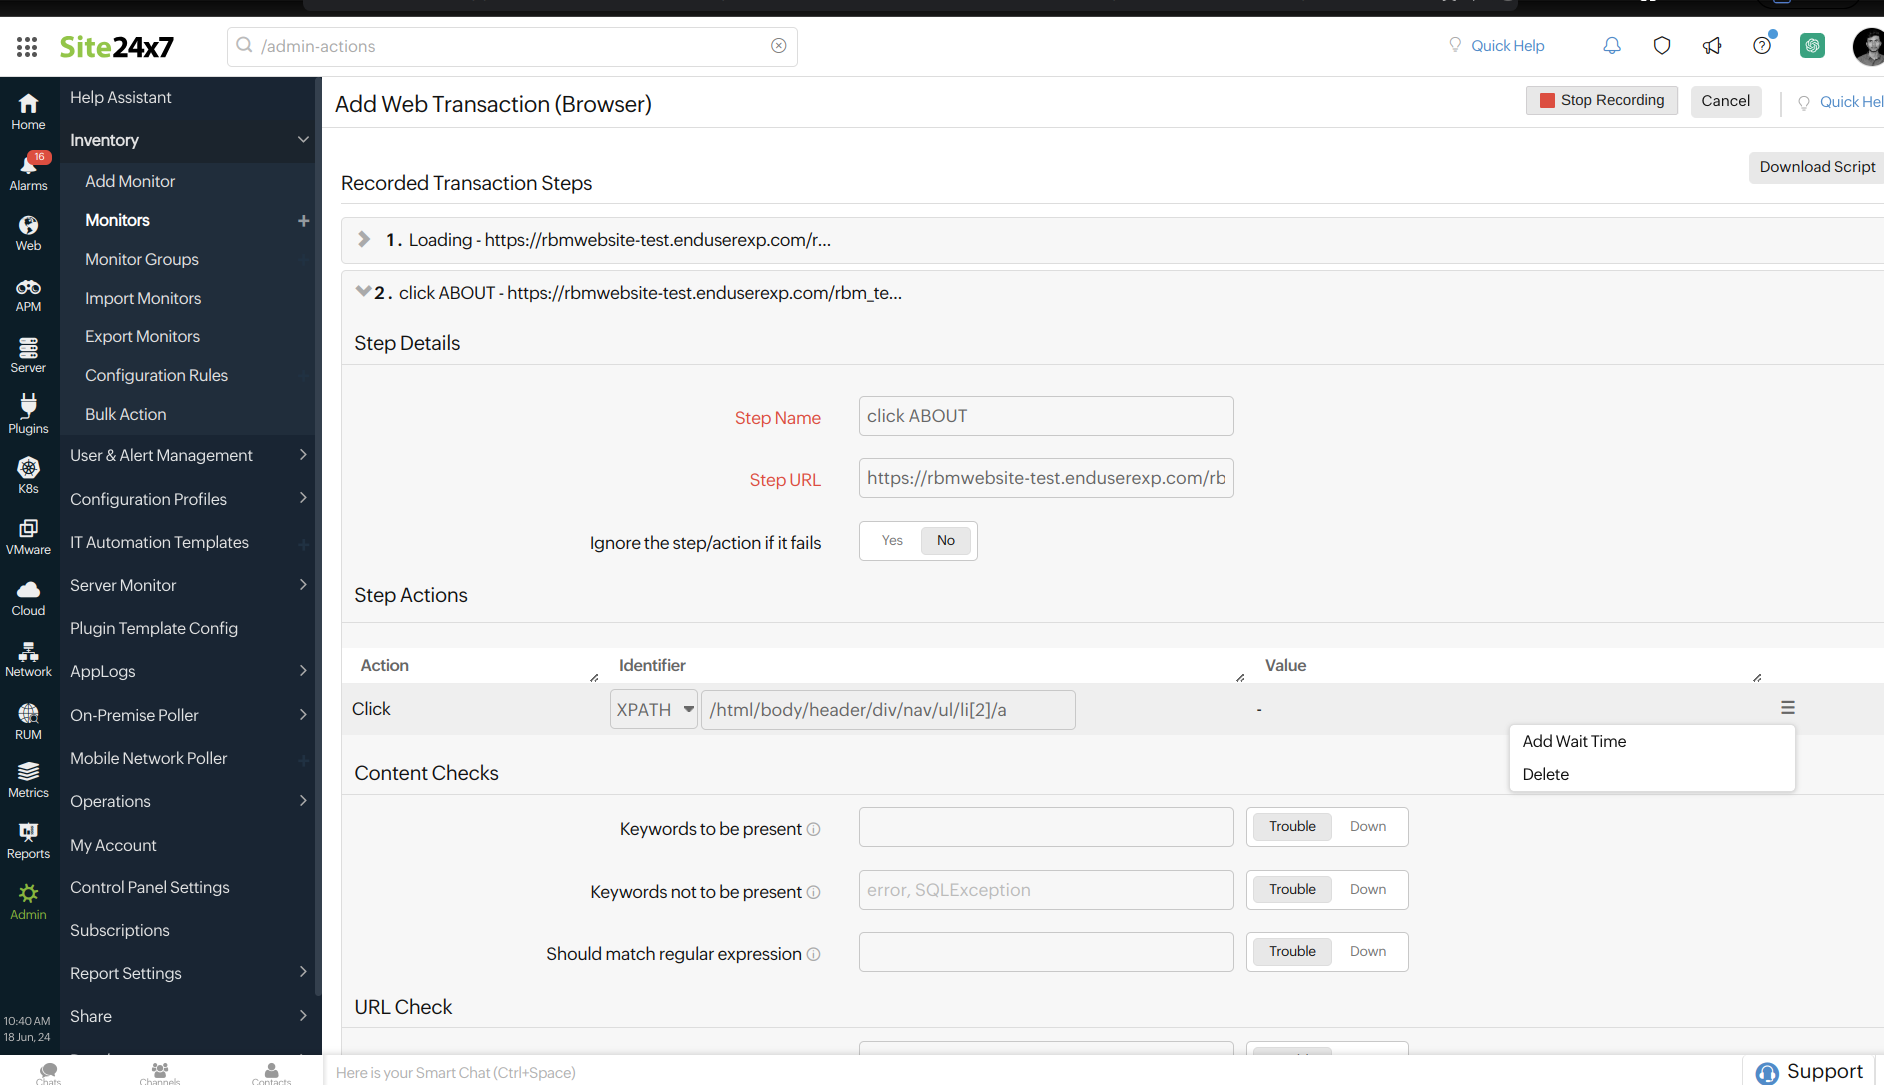
- Edit the steps of the transactions under the Recorded Transaction Steps:
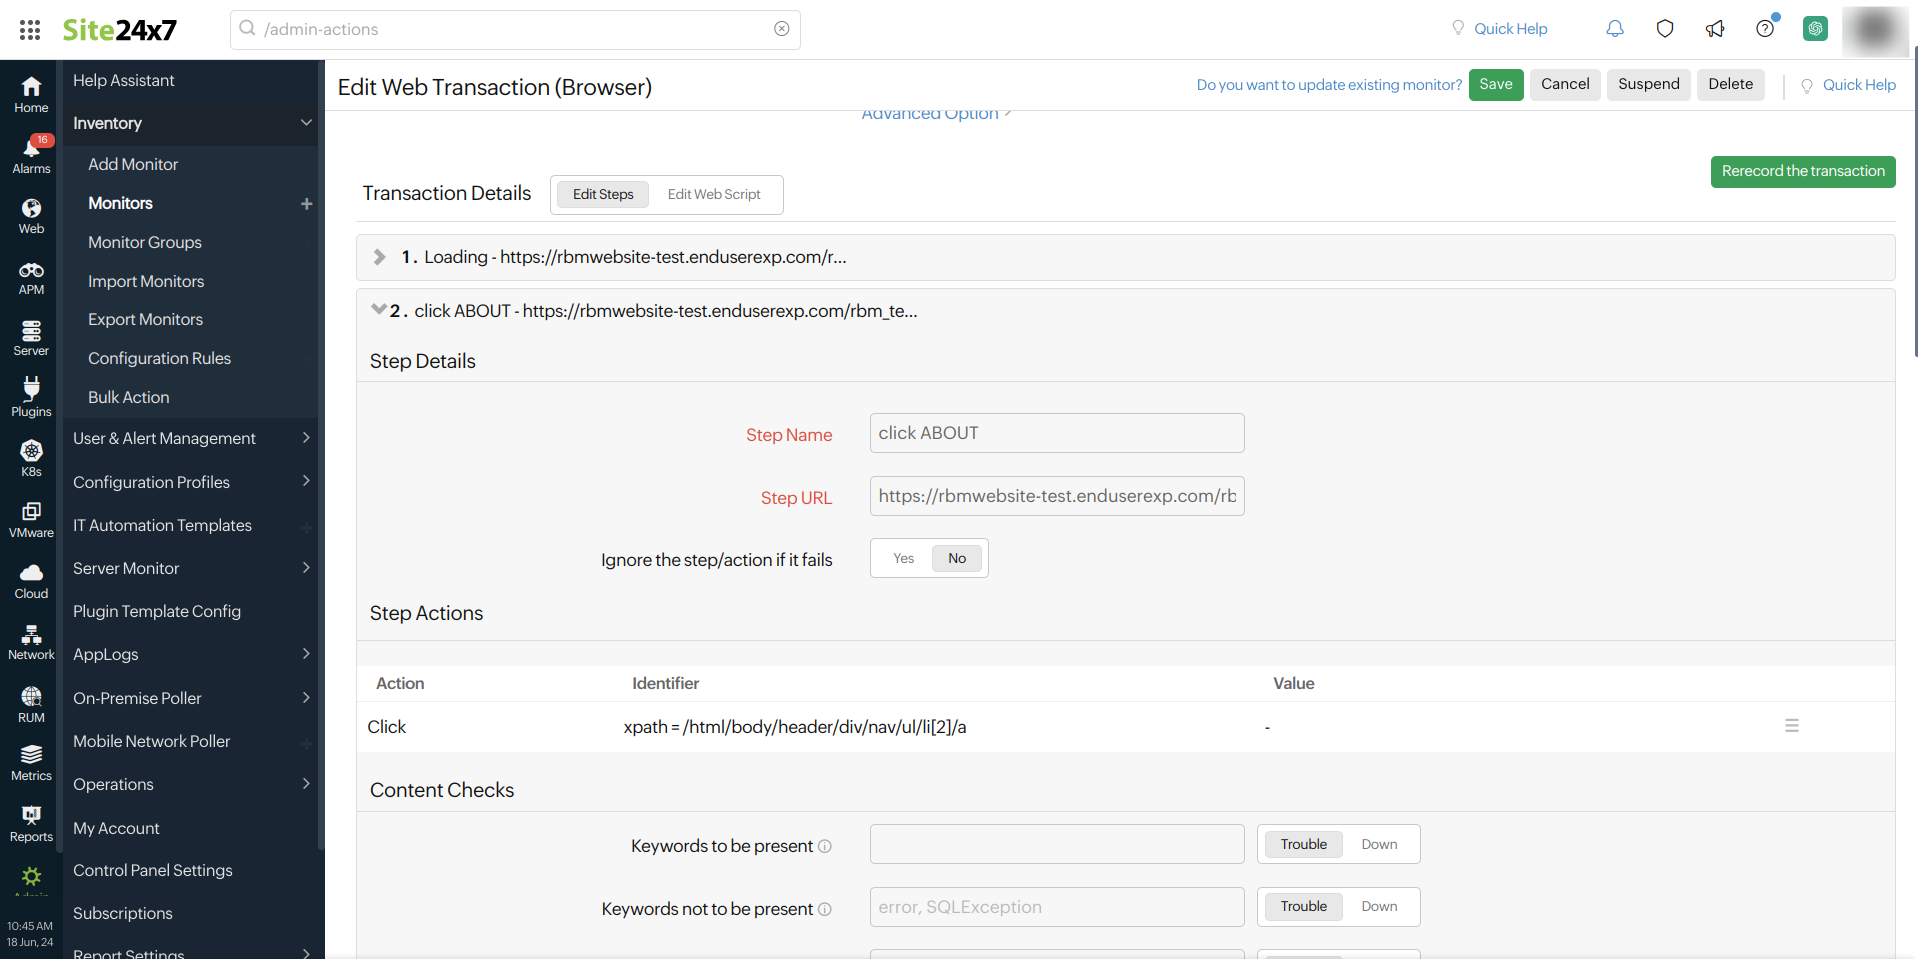
You can edit the step details by clicking a step and modifying the Step Details, Step Actions, Content Checks, and URL Checks.- Step Details: Provide the Step Name, Step URL, and toggle the button for Ignore the step/action if fails to Yes if you want to ignore this step. By default, the toggle is set to No.
- Step Action: Provide the Action, Identifier, and Value. Clicking the hamburger
 icon lets you add a Wait Time or Delete the action.
Wait time is the duration that each action is required to pause for. - Content Checks: Modify the Content Check settings as per your requirements.
- Keywords to be present: Get alerted when the specified keywords are not present in the website. Mention the keywords in the Content Check text box and toggle the button to trigger a Trouble or Down alert when the keyword check fails. To check multiple keywords or a phrase, specify these inside double quotes (""). Example: "searching the keyword".
- Keywords not to be present: Get alerted when the specified keywords are present in the webpage content. Mention the keywords in the check box and use the toggle button to trigger a Trouble or Down alert when the keyword check fails.
NoteYou must adhere to the following conditions while adding keywords in the given field:
- A single string or keyword can be configured with or without any double quotes (e.g., HTML).
- If there are two strings, which comprise a single keyword, add a space in between the two strings and enclose it with double quotes. (e.g., "HTML response").
- If you have more than two individual keywords configured, you will have to separate them with a space and also use double quotes for each of them. (e.g., "monitor" "HTML").
- Should match regular expression: Configure your alert based on whether a particular pattern matches with the website content.
For example: For the expression ^[a-z0-9_-]{3,15}$, your website content should contain alphabets from a to z, numbers from 0 to 9, underscore, and a hyphen. Also, there should be a minimum length of three characters and a maximum length of 15 characters. When it is not matched, your website will be reported as "Regular expression"^[a-z0-9_-]{3,15}$" does not match" as a reason.
- URL Check: Specify the URL to verify it against the currently loaded URL. Based on your alert setting (i.e., Trouble or Down), an alert is automatically triggered when the URL check fails.
- Specify the following details under Monitor Configuration:
- Display Name: The name of your web browser transaction monitor. Save the monitor with this name.
- Base URL: The URL you provided before starting the recording. This field cannot be edited.
- Resolution: The screen resolution that will be used during the monitor playback.
- Page Load Timeout: The total estimated time taken to load the HTML and all its associated components, including javascript and images. This time can be anywhere between 1 and 60 seconds.
- Select Browser For Monitoring: Choose Firefox, Chrome, or Edge for test playback.
- Check Frequency: Choose the required polling frequency. The frequency can be set from 5 minutes to 1 day.
- Monitoring Locations: Choose a global location or private location from the drop-down list to set up monitoring of your website transaction from this location. Choose your On-Premise Poller from the drop-down to customize your private location. Additionally, customize Monitoring Locations and create location profiles based on your requirements.
NoteTo know more, refer to Location Profile.
- Parallel Polling: Enable parallel polling to initiate data collection from all the configured monitoring locations simultaneously during hourly polls. Polling will be handled asynchronously, by default.
NoteFor session-based applications, if the polling occurs simultaneously across multiple locations, it will create concurrent sessions and affect the monitoring, leading to monitor failure. This is why it's important to restrict parallel polling during hourly polls alone.
- Associate with Monitor Group(s): You can associate your monitor with multiple monitor groups by selecting the relevant monitor groups from the drop-down list. This allows for logical grouping of your monitors.
NoteTo learn how to create a monitor group for your monitors, refer to Monitor Groups.
- Dependent on monitor: Select a monitor from the drop-down list to choose it as your dependent resource. Alerts to your monitor will be suppressed based on the Down status of your dependent resource.
Note- Configuring a dependent resource and suppressing alerts based on the dependent resource's status provides you with better false alert protection. Learn more about alert suppression at the monitor level.
- If you select None in the dependent resource field, alerting will proceed as per your normal configuration settings. No alerts will be suppressed in this case as the monitor doesn't have a dependent resource.
- Multiple monitor group support for monitors allows a monitor to be associated with multiple dependent resources in different monitor groups. If during a normal monitor status check, any one of these dependent resources' status is identified as Down, the alert for the monitor will be suppressed automatically. However, the dependency configuration at the monitor level is always given the higher priority over any other monitor group-level dependency configuration for suppressing alerts. To learn more, refer to dependency configuration.
- Specify the details under the Advanced Configurations:
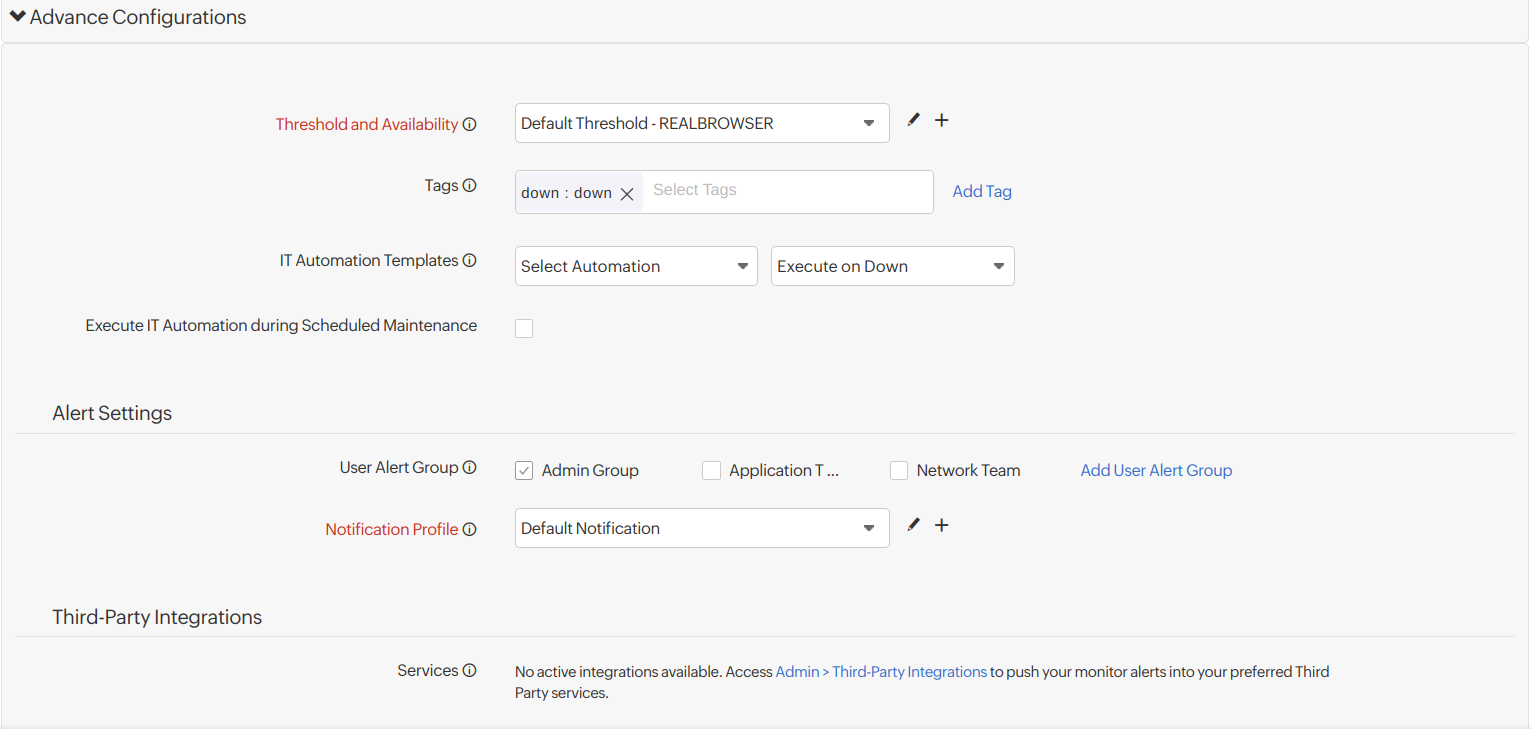
- Threshold and Availability: Select a threshold profile from the drop-down list or choose the default threshold set available and get notified when the resources cross the configured threshold and availability.
NoteTo create a customized threshold and availability profile, refer to Threshold and Availability.
- Tags: Associate your monitor with predefined Tag(s) to help organize and manage your monitors creatively.
NoteLearn how to add Tags.
- IT Automation Templates: Select an automation to be executed when the website status is Down, Trouble, Up, or any status change or any attribute change. The defined action will be executed when there is a state change, and selected user groups will be alerted.
NoteLearn more about IT Automation.
- Execute IT Automation during Scheduled Maintenance: Configuring a scheduled maintenance window allows you to suppress alerts for select IT resources during routine maintenance tasks. Select the check box to enable the option to execute IT Automation, including script executions, server commands, and more, during this period.
- Threshold and Availability: Select a threshold profile from the drop-down list or choose the default threshold set available and get notified when the resources cross the configured threshold and availability.
- Specify the details under the Alert Settings:
- User Alert Group: Select the user group that need to be alerted during a outage. To include multiple users in a group, refer to User Groups.
- Notification Profile: Choose a notification profile from the drop-down or select the default profile available. Notification profiles help to configure when and who needs to be notified in case of downtime. To create a customized notification profile, refer to Notification Profile.
- Third-Party Integrations: Associate your monitor with a preconfigured third-party service. This option lets you push your monitor alarms to selected services and facilitates improved incident management.
NoteIf you haven't set up any integrations yet, navigate to Admin > Third-Party Integration to create one. To know more, refer to Third-Party Integration.
- Click Save to save the monitor.
Once saved, you'll be redirected to the dashboard monitor summary page.
-
-
Browser Add-ons (Firefox)
Install the Web Transaction (Browser) Recorder add-on, which records all the user interactions in your web application in their exact sequence and notifies you when an error is detected. This monitoring feature will use an actual browser, Firefox or Chrome, to play back the captured web transaction.Record a new web transaction using a browser add-on
To install a Web Transaction (Browser) recorder:
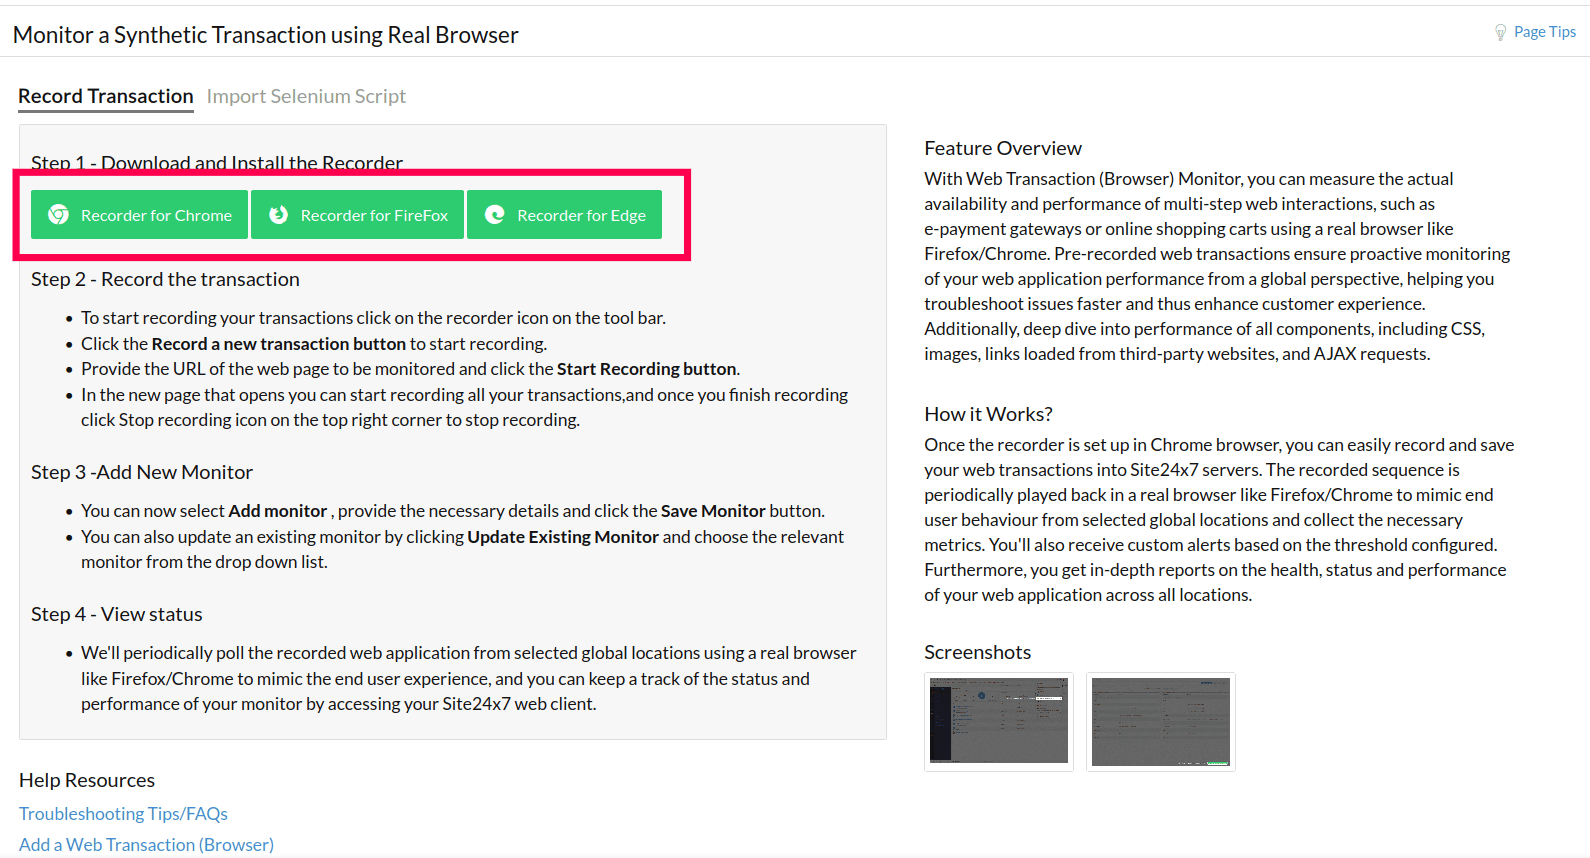
- Click the Recorder for Firefox button to access the add-on.
- Click the Add to Firefox button. Once you finish this step, you can start recording your transactions
Enabling the recorder in private browsing mode
To ensure that your transaction recordings are not affected by cookies from previous sessions or other cached data, it's important to enable private browsing mode. Here's how to do it:
- Click the puzzle
 icon on the menu bar, then click the settings icon next to Site24x7 Web Transaction (Browser) Recorder.
 - In the pop-up that appears, select the Manage Extension option.
- On the Add-ons Manager page, click Allow next to Run in Private Windows.
To start recording your transactions:
- Click the puzzle

icon available on the toolbar. Select the data center and log in to your Site24x7 account. - Click the Record a new transaction button.
Note- Alternatively, you can import a Selenium-based script in .side format into your Web Transaction (Browser) Recorder add-on using the Import a Selenium script button. When Selenium scripts are imported, they might contain multiple test cases in the test suite, but only the first test case will be accepted, and all the others will be discarded.
- If the recorded script has CAPTCHA fields, you will be notified about this as a warning just before the actual test playback starts. You can always skip this and proceed with the test playback.
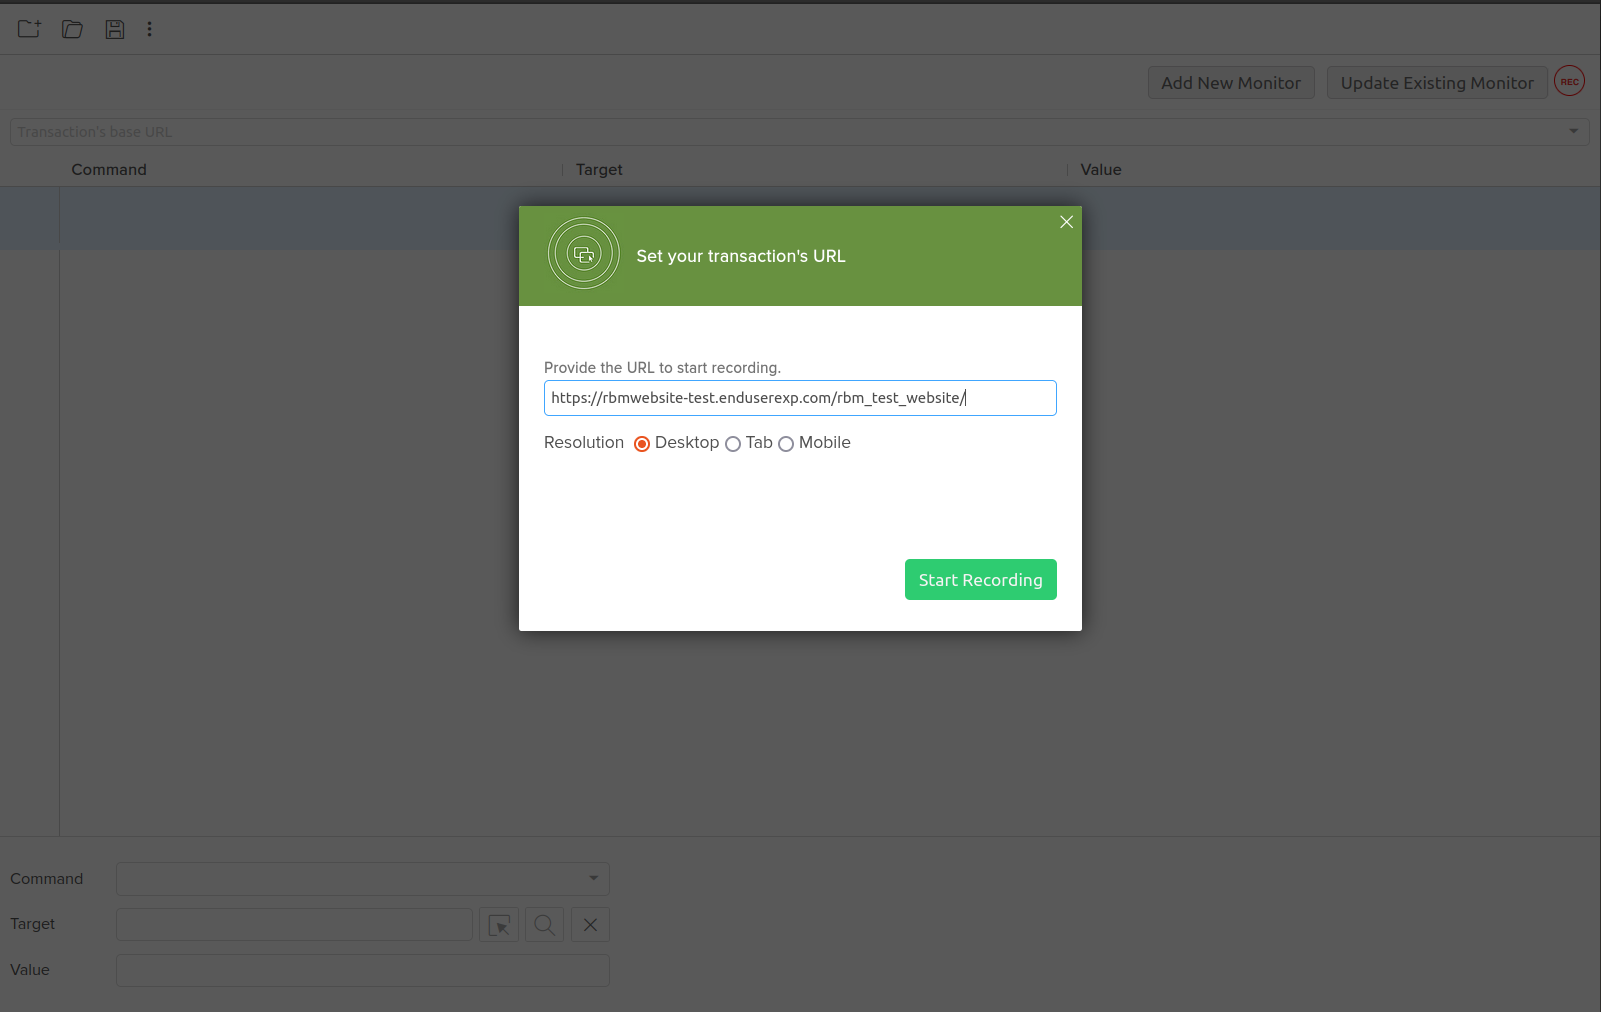
- Enter the URL of the webpage you would like to monitor.
- Choose the resolution based on the type of device (Desktop, Tab, or Mobile), then click the Start Recording button.
 Note
NoteThe resolution change is handled at the browser level only.
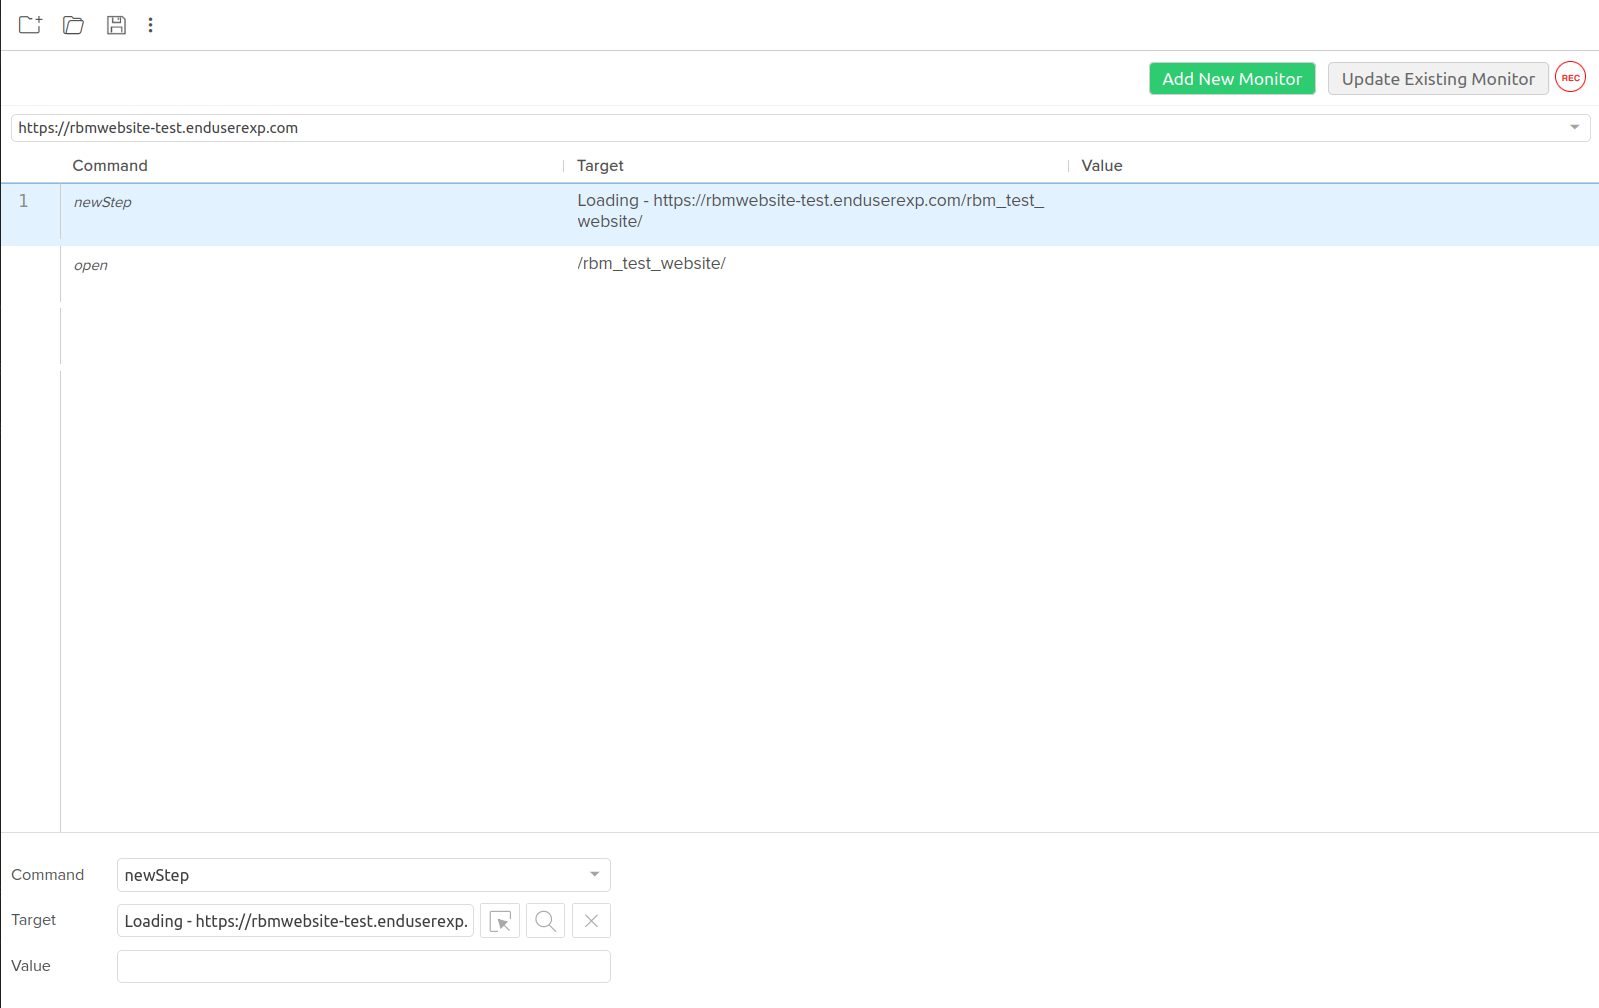
- In the new window that opens, you can record all your transactions. To access an already recorded transaction, click the Update Existing Monitor button.
- Once you finish recording, click the icon in the top-right corner of the add-on.
- Click Add New Monitor, provide the necessary details, and click Save Monitor.
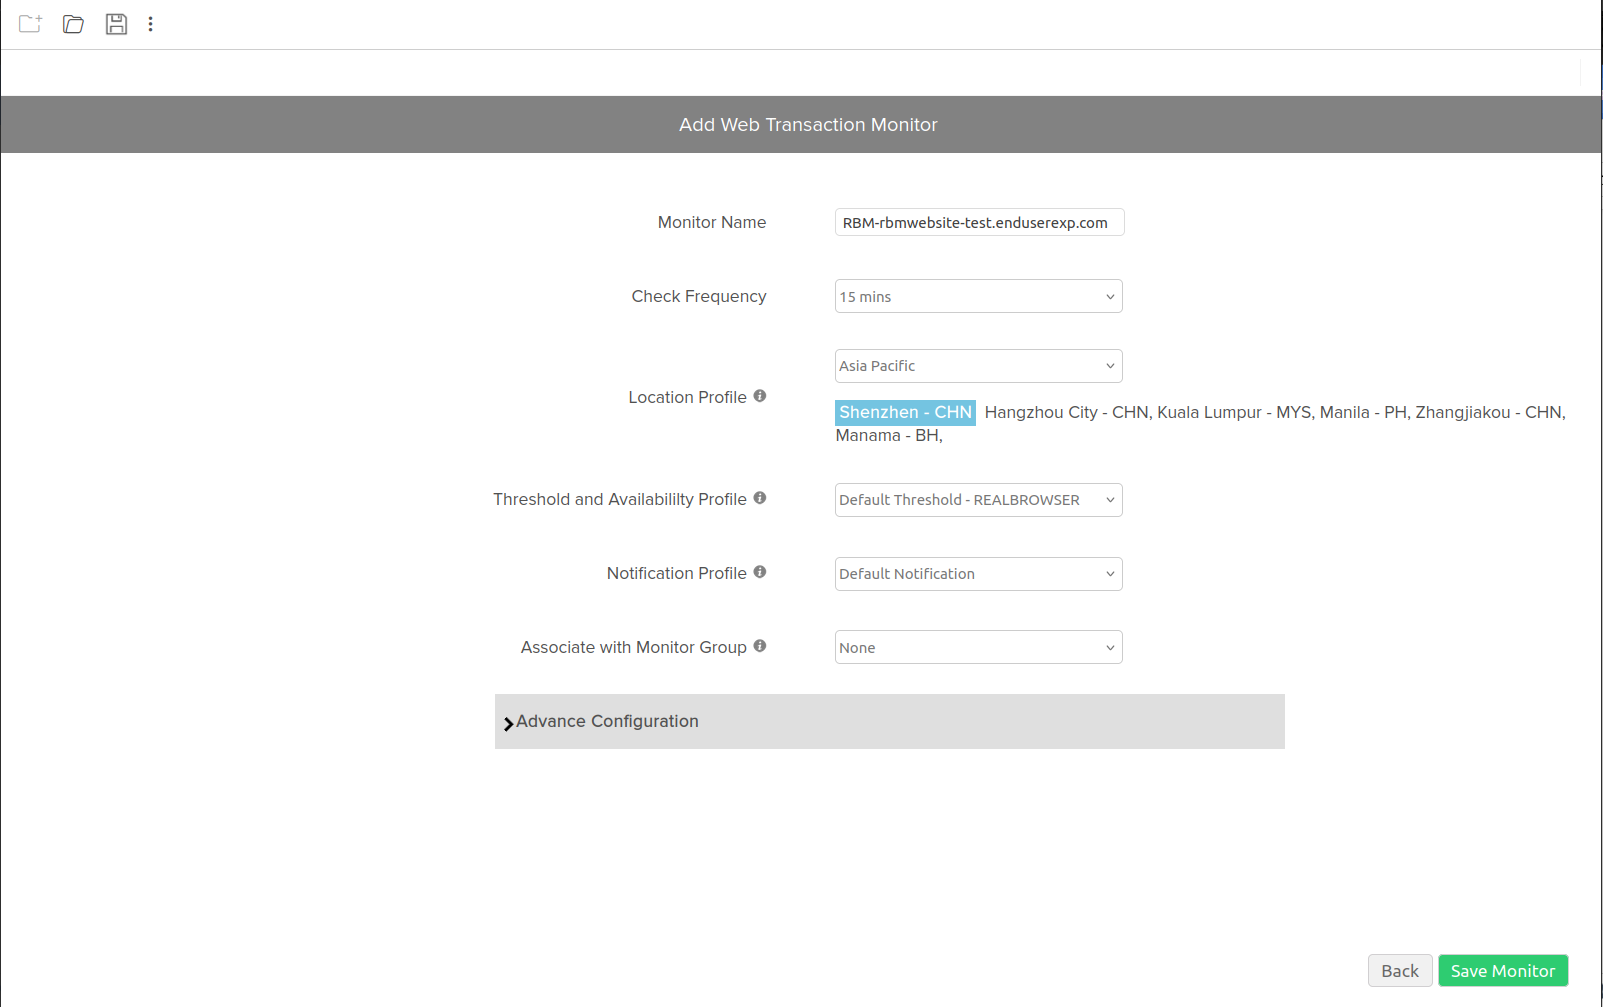
- Provide all the details in the Add Web Transaction Monitor window:
-
Monitor Name: Enter the name of your Web Transaction (Browser) recorder. Save the monitor with this name.
-
Check Frequency: Choose the required polling frequency. The frequency options range from five minutes to one day.
-
Location Profile: Choose a global or private location from the drop-down menu to set up the monitoring of your website from this location. Choose your On-Premise Poller from the drop-down menu to customize your private location. Additionally, customize or create Location Profiles based on your requirements.
NoteLearn more about Location Profiles.
- Threshold and Availability Profile: Select a Threshold Profile from the drop-down menu or choose the default threshold that is available. You will receive notifications when the resources exceed the configured threshold and availability.
NoteLearn how to create a customized Threshold and Availability Profile.
- Notification Profile: Choose a Notification Profile from the drop-down menu or select the default profile. A Notification Profile helps you configure when and who to notify about downtime.
NoteLearn how to create a customized Notification Profile.
- Associate with Monitor Group: You can associate your monitor with multiple Monitor Groups by choosing the relevant ones from the drop-down menu. This enables the logical grouping of your monitors.
NoteLearn how to create a Monitor Group for your monitors.
-
- Specify the following details under Advanced Configuration:
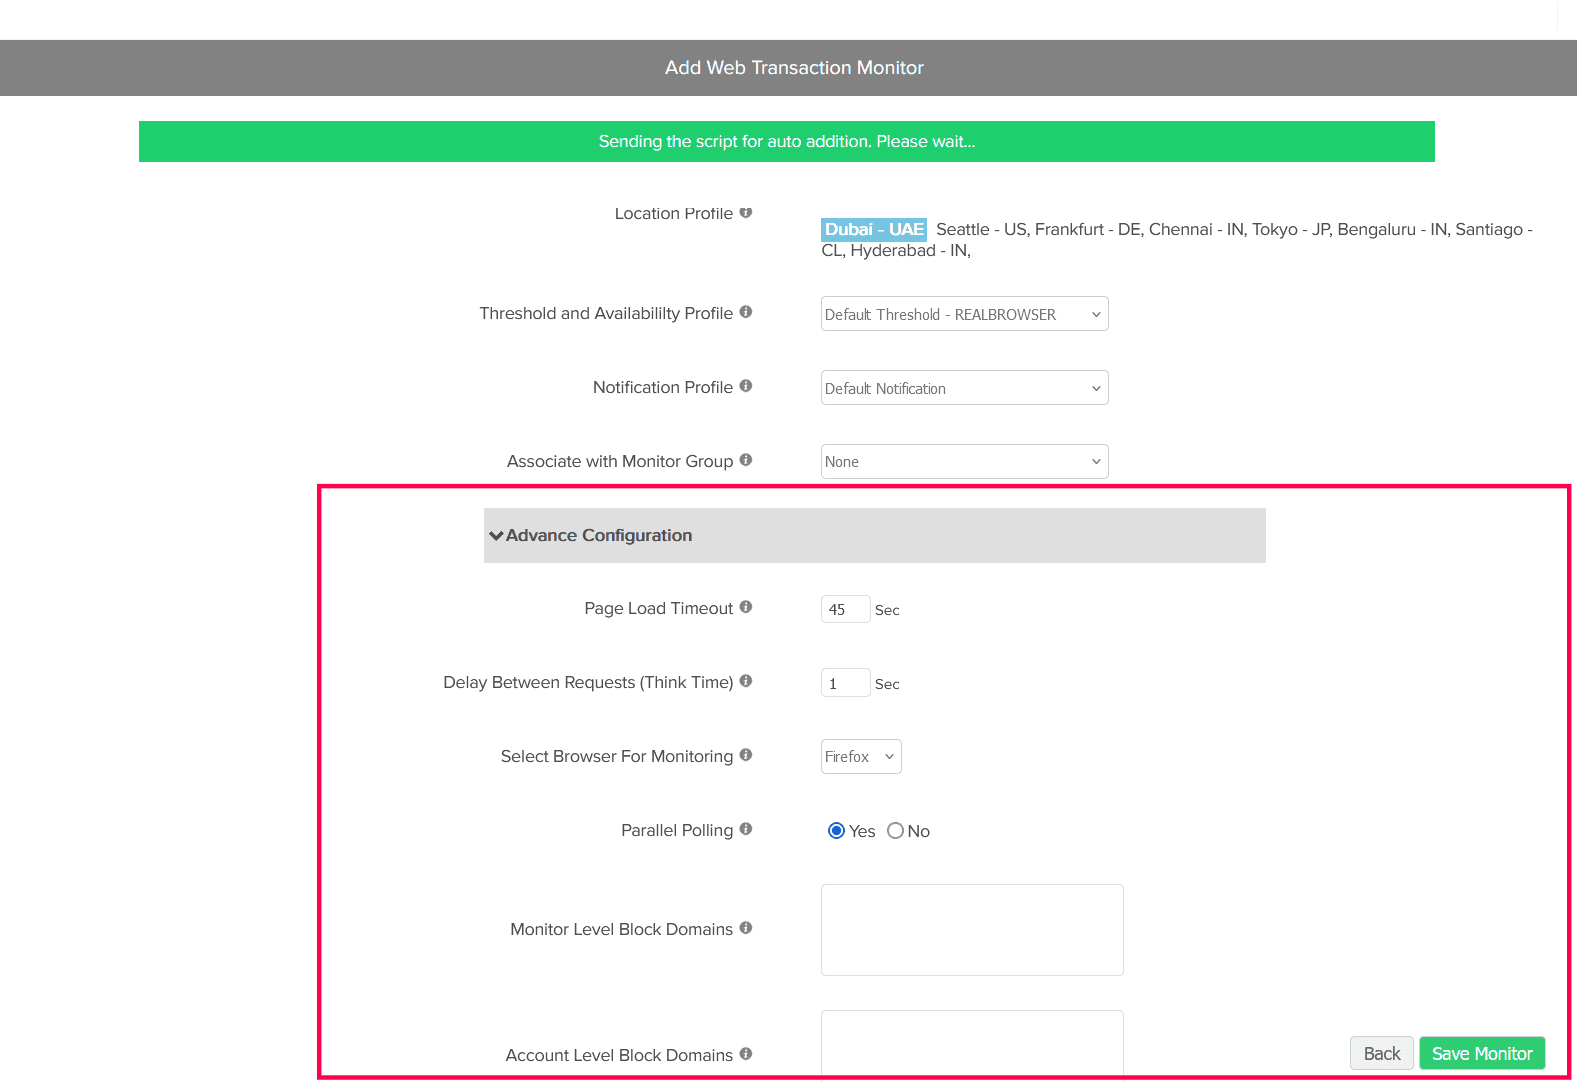
- Page Load Timeout: Specify the estimated time to load HTML and all its associated components, including JavaScript and images. The value can be between one and 60 seconds.
- Delay Between Requests (Think Time): Specify the time to wait before initiating the next step in the transaction while running the test. This is useful when your webpage needs additional time to load all the components correctly (mainly AJAX components). The value can be set between zero and 10 seconds.
- Select Browser For Monitoring: Select Firefox for the test playback.
- Parallel Polling: Enable parallel polling to initiate data collection from all the configured monitoring locations simultaneously during hourly polls. Polling will be handled asynchronously by default.
NoteFor a session-based application, simultaneous polling across multiple locations creates concurrent sessions, which affects monitoring and can lead to failures. Therefore, parallel polling is restricted to hourly polls only.
- Monitor Level Block Domains: If you want to exclude traffic from certain domains while monitoring your web application, add those domains as comma-separated domain names. This list is valid only for this monitor configuration.
- Account Level Block Domains: Add the domains that need to be ignored at the global account level during monitoring. Learn how to block domains while tracking user activity in Google Analytics.
NoteUse a comma-separated domain list to block multiple domains.
- After providing all the details, click the Save Monitor button to receive a message stating that the monitor has been successfully added. Once you receive this message, you can leave the recorder.
NoteAfter you finish recording, the transaction will be available for 30 minutes. If you do not save it within that time, the transaction will be discarded.
- Click the puzzle
Update an existing transaction recorder
If you wish to update an existing monitor:
- Click Update Existing Monitor and choose the relevant monitor from the drop-down menu.
- Then click Test Playback and Update Monitor. During the test playback, the provided script will be cross-checked.
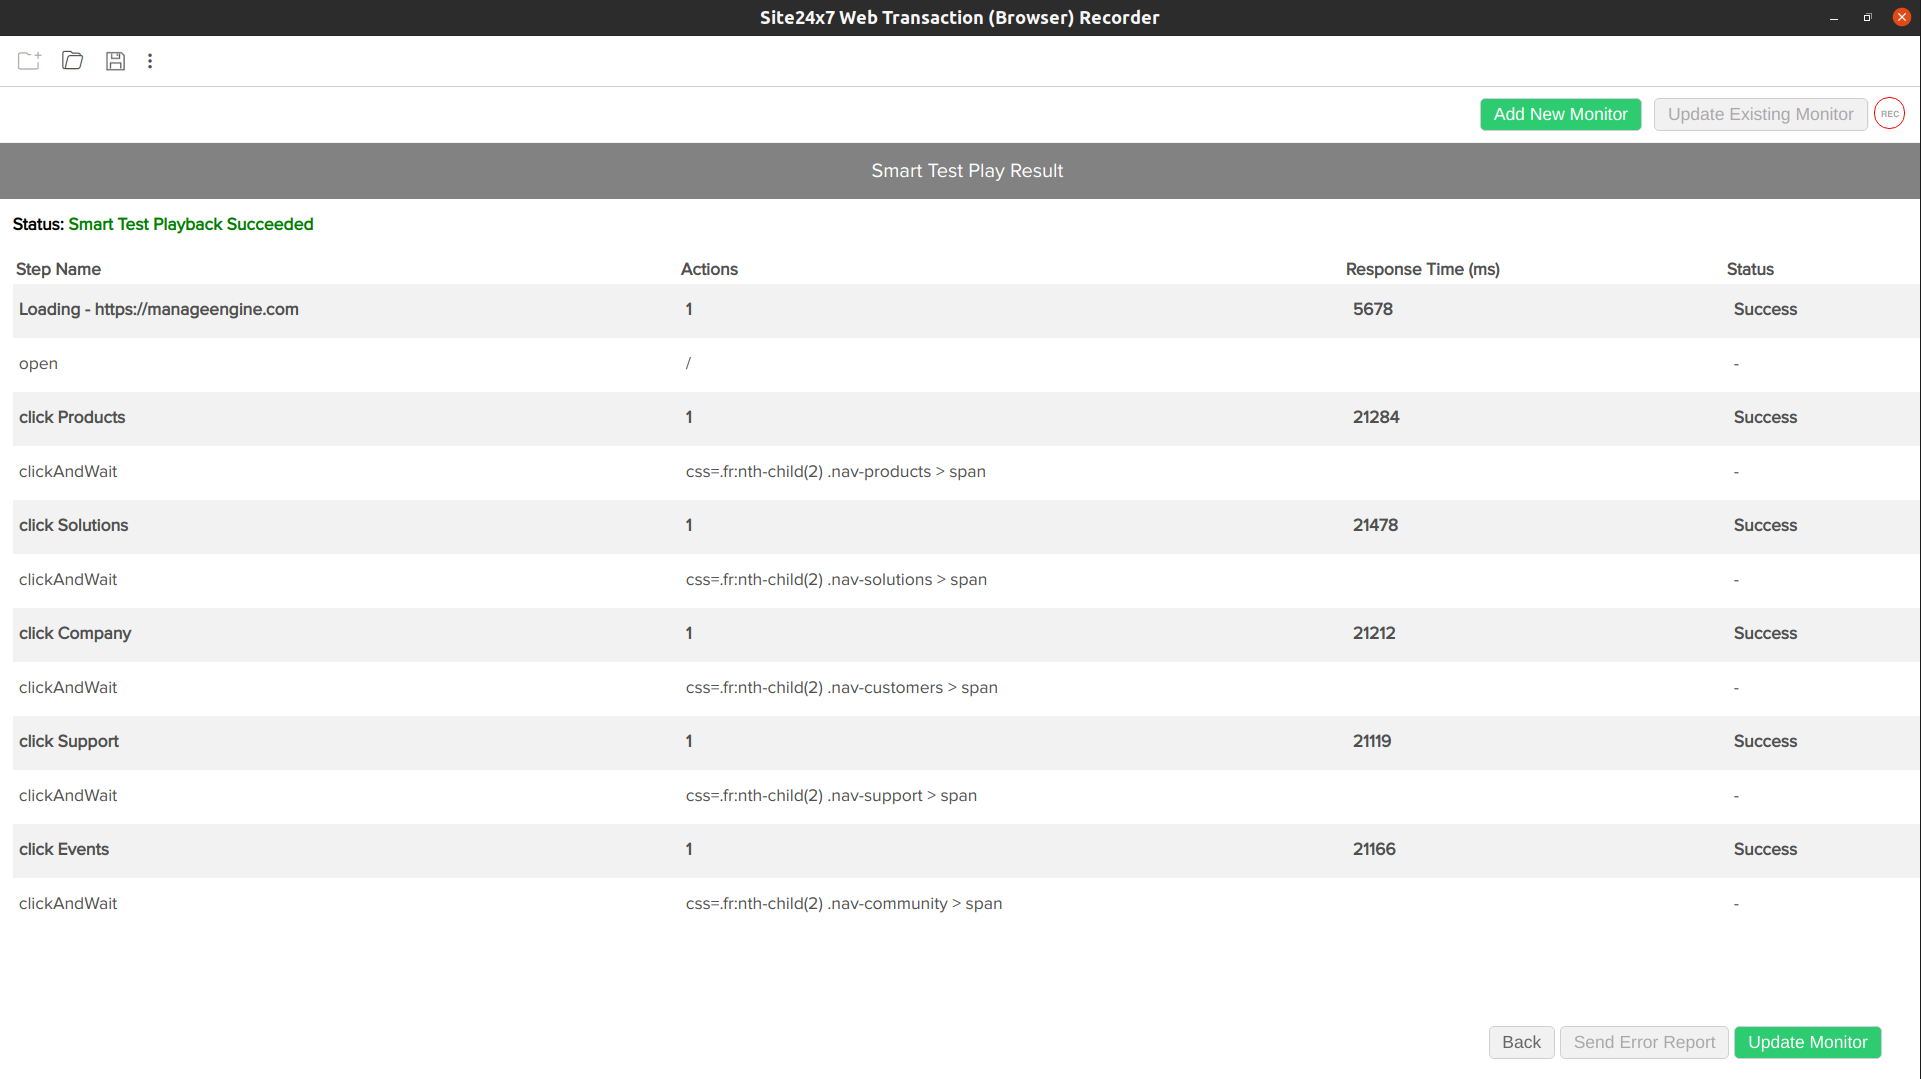
- Once you receive the test playback result, click Update Monitor to update the existing monitor.
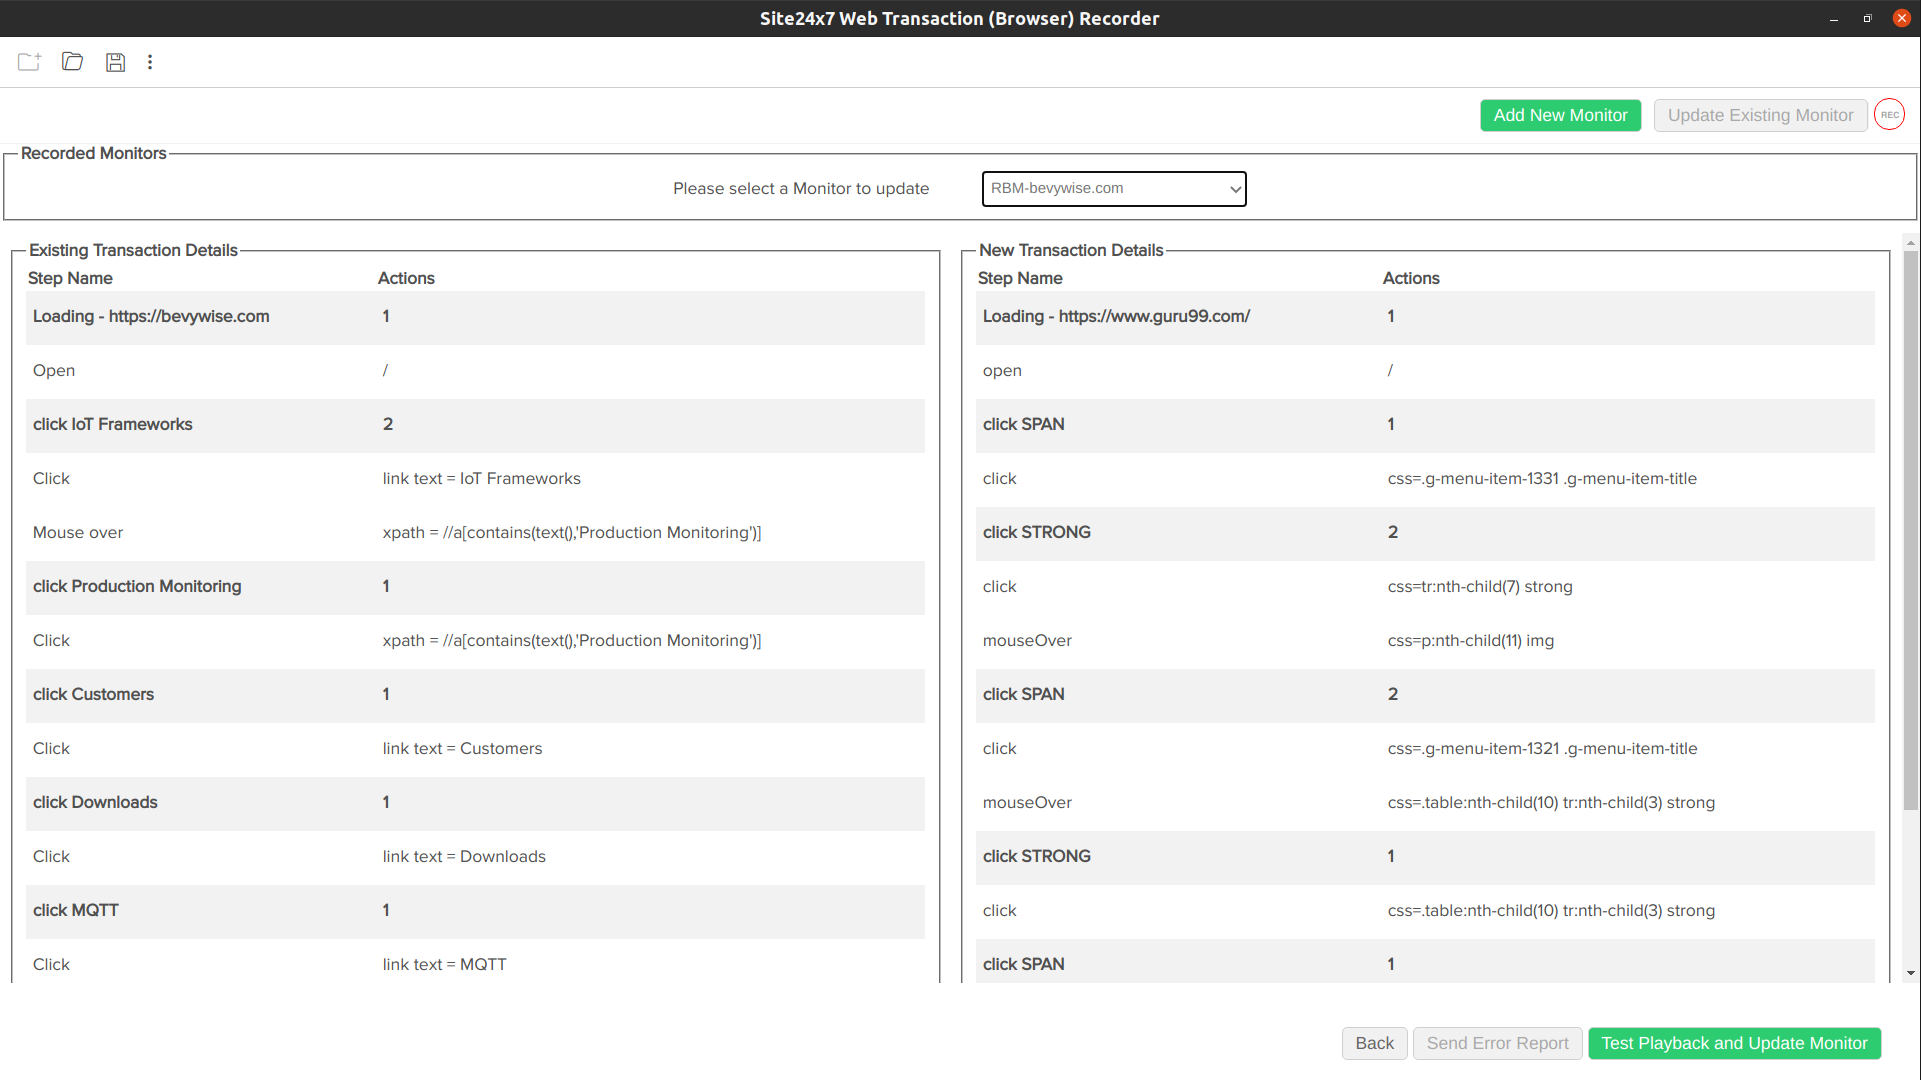
Note- You might encounter a test playback failure at times due to various reasons, such as errors in the script or issues with the location where the test playback is happening. You might also have country-based webpages where the content differs based on the IP address where the website is accessed. In such cases, click Send Error Report and contact support@site24x7.com.
- In the playback results, if there is a keyword failure, the trouble message Keyword check failed will be displayed on the recorder screen.
Edit/modify Web Transaction (Browser) in the web client
To edit the Web Transaction (Browser) monitor, click the hamburger ![]() icon and select Edit.
icon and select Edit.
Provide the following details for editing the transaction monitor:
- Modify the monitor's existing Display Name and Base URL, if required.
- Editing Transaction Details: Modify the existing Transaction Details below.
-
Edit Steps
-
You can update the existing transaction details by modifying the Step Details, Step Actions, Content Checks, and URL Checks for each transaction step. For editing the transaction fields, refer to Recorded Transaction Step.
- Step response time threshold for primary location: You can configure a threshold for each step based on your primary location. When the threshold is exceeded, an alert will be triggered based on the Poll Strategy and Poll Value, and the user will receive a notification labeled Trouble or Critical. Click the Save button present in each step to save your threshold value. You can view these alerts in the Log Report tab.
NoteYou can delete your threshold by clicking the delete icon (
 ).
). - Step response time threshold for secondary locations: You can configure a threshold for each step based on your secondary locations. When the threshold is exceeded, an alert will be triggered based on the Poll Strategy and Poll Value, and the user will receive a notification labeled Trouble or Critical. Click the Save button present in each step to save your threshold value. You can view these alerts in the Log Report tab.
NoteYou can delete your threshold by clicking the delete icon (
 ).
).
- Step response time threshold for primary location: You can configure a threshold for each step based on your primary location. When the threshold is exceeded, an alert will be triggered based on the Poll Strategy and Poll Value, and the user will receive a notification labeled Trouble or Critical. Click the Save button present in each step to save your threshold value. You can view these alerts in the Log Report tab.
-
-
Web Script Editing
- Web Script Editing lets you edit your existing web script, perform test playback, and modify the existing script with an inline editor without having to use the Web Transaction (Browser) recorder.
- Press CTRL to view the list of all the commands available in the transaction. You can use the required commands and modify the scripts.
- You can modify the properties using the inline editor and start the test playback by using the Smart Test playback button. When you do this, a new tab named Smart TestPlay Result will open. The result will be retrieved based on the chosen location and will show the status, collection time, playback location, transaction time, IP address, and the number of successful steps. The result will also display the steps, step time, page load time, and page summary.
- Click View HTML to display the page's HTML content, and click Resources to display the resources in the form of a graph.
- Once you're finished editing, click the Update button, which will save the edited transaction.
Note- To learn more about the web script commands, refer to advanced script editing.
- If you encounter a Test Playback Failure, click the Send Error Report button to send us a report or contact support@site24x7.com.
-
Re-record the transaction
-
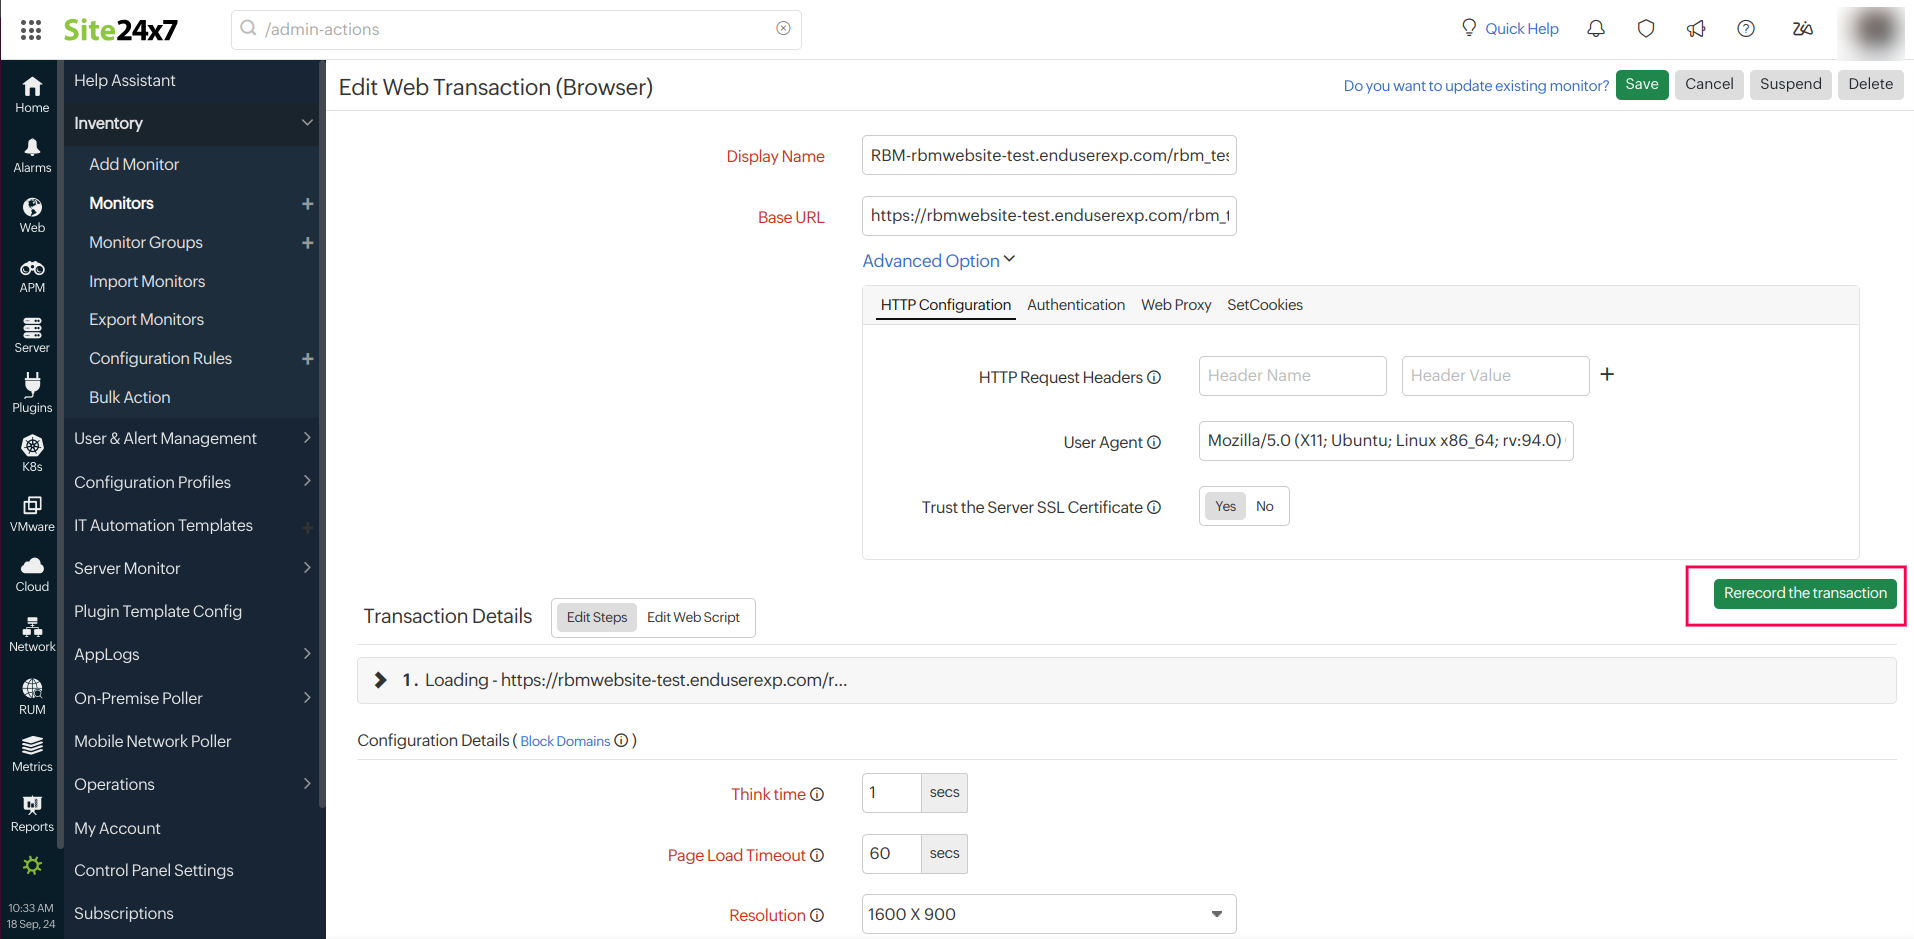
You can re-record your transaction by clicking the Rerecord the transaction button. The entire transaction can be recorded from the beginning. Click the Stop Recording button to stop the transaction. Click Smart Test playback to play back your re-recorded transaction. To save the transaction, click the Update button.
-
-
- Configuration Details:
- Think Time: This is the amount of time to wait before initiating the next step in the transaction while running the test. It is useful when your webpage requires additional time to load all components correctly, especially AJAX components. The value can be set between 0 and 10 seconds. By default, the think time is set to 1 second.
-
Page Load Timeout: Provide the total estimated time taken to load the HTML and all its associated components, including JavaScript and images. You can specify this time between 1 and 60 seconds.
- Resolution: Pick your preferred screen resolution that yields best results during a playback by Site24x7.
The following screen resolutions are supported in Site24x7:
Device Screen Resolution Desktop 1024x768
1366x768
1600x900
1920x1080IPhone 6/7/8 375, 667 IPhone 12/13 + Pro 390, 844 IPhone X 375, 812 Galaxy S20 360, 800 Pixel 2 411, 823 IPad 810, 1080 IPad Pro 1024, 1366 Surface Duo 540, 72
- Select Browser For Monitoring: Choose between Chrome, Firefox or Edge browser for test playback.
- Parallel Polling: Enable parallel polling to initiate data collection from all the configured monitoring locations simultaneously during hourly polls. Polling will be handled asynchronously, by default.
NoteFor session based application, if the polling occurs simultaneously across multiple locations, it will create concurrent sessions and thus affect the monitoring and lead to monitor failure. This is the reason for restricting parallel polling during hourly polls alone.
- Check frequency: Choose the required polling frequency. The frequency can be set from 5 minutes to 1 day.
- Monitoring Locations: Choose a global location or Private location from the dropdown list to setup monitoring of your website from this location. Choose your On-Premise Poller from the drop down to customize your Private location. Additionally, customize and create location profiles based on your requirements.
NoteTo know more, refer Location Profile.
- Associate with Monitor Group(s): You can associate your monitor with multiple monitor groups by selecting the relevant monitor groups from the drop down list. This allows in logical grouping of your monitors.
NoteTo learn how to create a monitor group for your monitors, refer Monitor Groups.
- Dependent on monitor: Select a monitor from the drop-down list to choose it as your dependent resource. Alerts to your monitor will be suppressed based on the Down status of your dependent resource.
Note- Configuring a dependent resource and suppressing alerts based on the dependent resource's status is part of providing you with better false alerts protection. Learn more about alert suppression at monitor level.
- If you select None in the dependent resource field, alerting will progress as per your normal configuration settings. No alerts will be suppressed in this case as the monitor doesn't have any dependent resource.
- Multiple monitor group support for monitors allow a monitor to be associated with multiple dependent resources in different monitor groups. If during a normal monitor status check, any one of these dependent resources' status is identified as DOWN, the alert for the monitor will be automatically suppressed. However, the dependency configuration at monitor level is always given the higher priority over any other monitor group level dependency configuration for suppressing alerts.
Block Domains
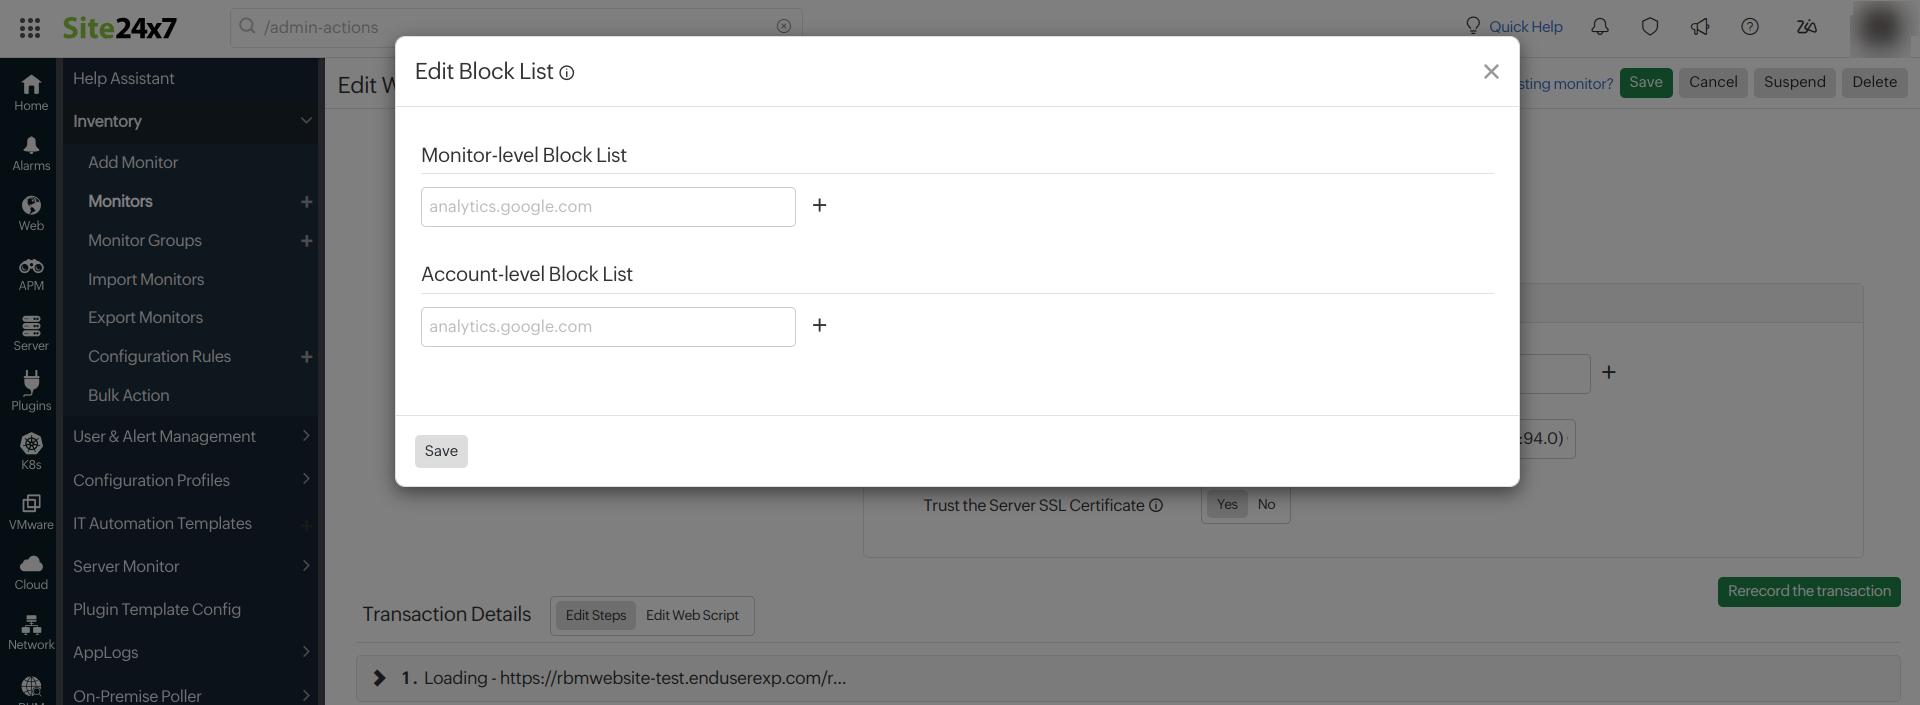
You can create a list of blocked domains to stop monitoring these specific domains. To do this, click Block Domains. In the pop-up window that appears, add the domain(s) at either the monitor level or the account level.
If you add block domain(s) to the Monitor-level Block List, the traffic from the domain will be excluded for that specific monitor only. However, if you add the domain(s) to the Account-level Block List, the traffic from the domain will be excluded globally across all monitors in your Site24x7 account.
- HTTP Configuration:
- HTTP Request Headers: Sometimes, you can customize the default HTTP request header information. In such cases, you can add the additional header name and header value here.
Note
To use a credential profile in HTTP Configurations, type $ and a list of available credential profiles will appear—select the desired one from this list. Learn more about credential profiles.
- User Agent: Configure a customized user agent (web browser) for sending your request and the HTTP headers to data collection.
Learn more about browser versions used in the Synthetic Web Transaction (Browser) monitor.
- HTTP Request Headers: Sometimes, you can customize the default HTTP request header information. In such cases, you can add the additional header name and header value here.
- Configuration Profile:
- Threshold and Availability: Select a threshold profile from the drop-down list or choose the default threshold set available. You will be notified when the resources cross the configured threshold and availability.
NoteTo create a customized threshold and availability profile, refer to Threshold and Availability.
- Tags: Associate your monitor with predefined Tag(s) to help organize and manage your monitors creatively.
NoteLearn how to add tags.
- IT Automation: Select an automation to be executed when the website is down, troubled, up, or has any status or attribute change. The defined action will be executed when the state changes, and the selected user groups will be alerted.
NoteTo automate corrective actions on failure, refer to IT Automation.
- Execute IT Automation during Scheduled Maintenance: Configuring a scheduled maintenance window allows you to suppress alerts for select IT resources during routine maintenance tasks. Select the check box to enable the option to execute IT automations, including script executions, server commands, and more, during this period.
- Threshold and Availability: Select a threshold profile from the drop-down list or choose the default threshold set available. You will be notified when the resources cross the configured threshold and availability.
- Alert Settings:
- User Alert Group: Select the user group that needs to be alerted during an outage. To add multiple users to a group, see User Alert Group.
- On-Call Schedule: This option ensures that notifications are sent to assignees during specific shift hours, helping them respond quickly to alerts or incidents. Choose an On-Call of your preference from the drop-down menu.
- Notification Profile: Choose a Notification Profile from the drop-down menu or select the available default profile. A Notification Profile helps configure when and who needs to be notified in case of downtime.
NoteTo create a customized notification profile, refer to Notification Profile.
- Third-Party Integrations:
Associate your monitor with a preconfigured third-party service. This capability lets you push your monitor alarms to selected services and facilitates improved incident management.
NoteTo set up an integration, navigate to Admin > Third Party Integration. To learn more, refer to Third-Party Integration.
- Click Save to save the edited transaction.
Clone web transaction (browser)
You can replicate an existing Web Transaction (Browser) monitor using the clone option in the Site24x7 web client. Additionally, you can make necessary step changes before cloning your monitor using the Edit Steps option in the web client.
Follow the instructions below to clone a Web Transaction (Browser) monitor successfully:
- Log in to Site24x7.
- Navigate to Admin > Inventory > Monitors
- Select the Web Transaction (Browser) monitor that you wish to clone from the Monitor List. Then, hover over the hamburger
 icon and click Clone.
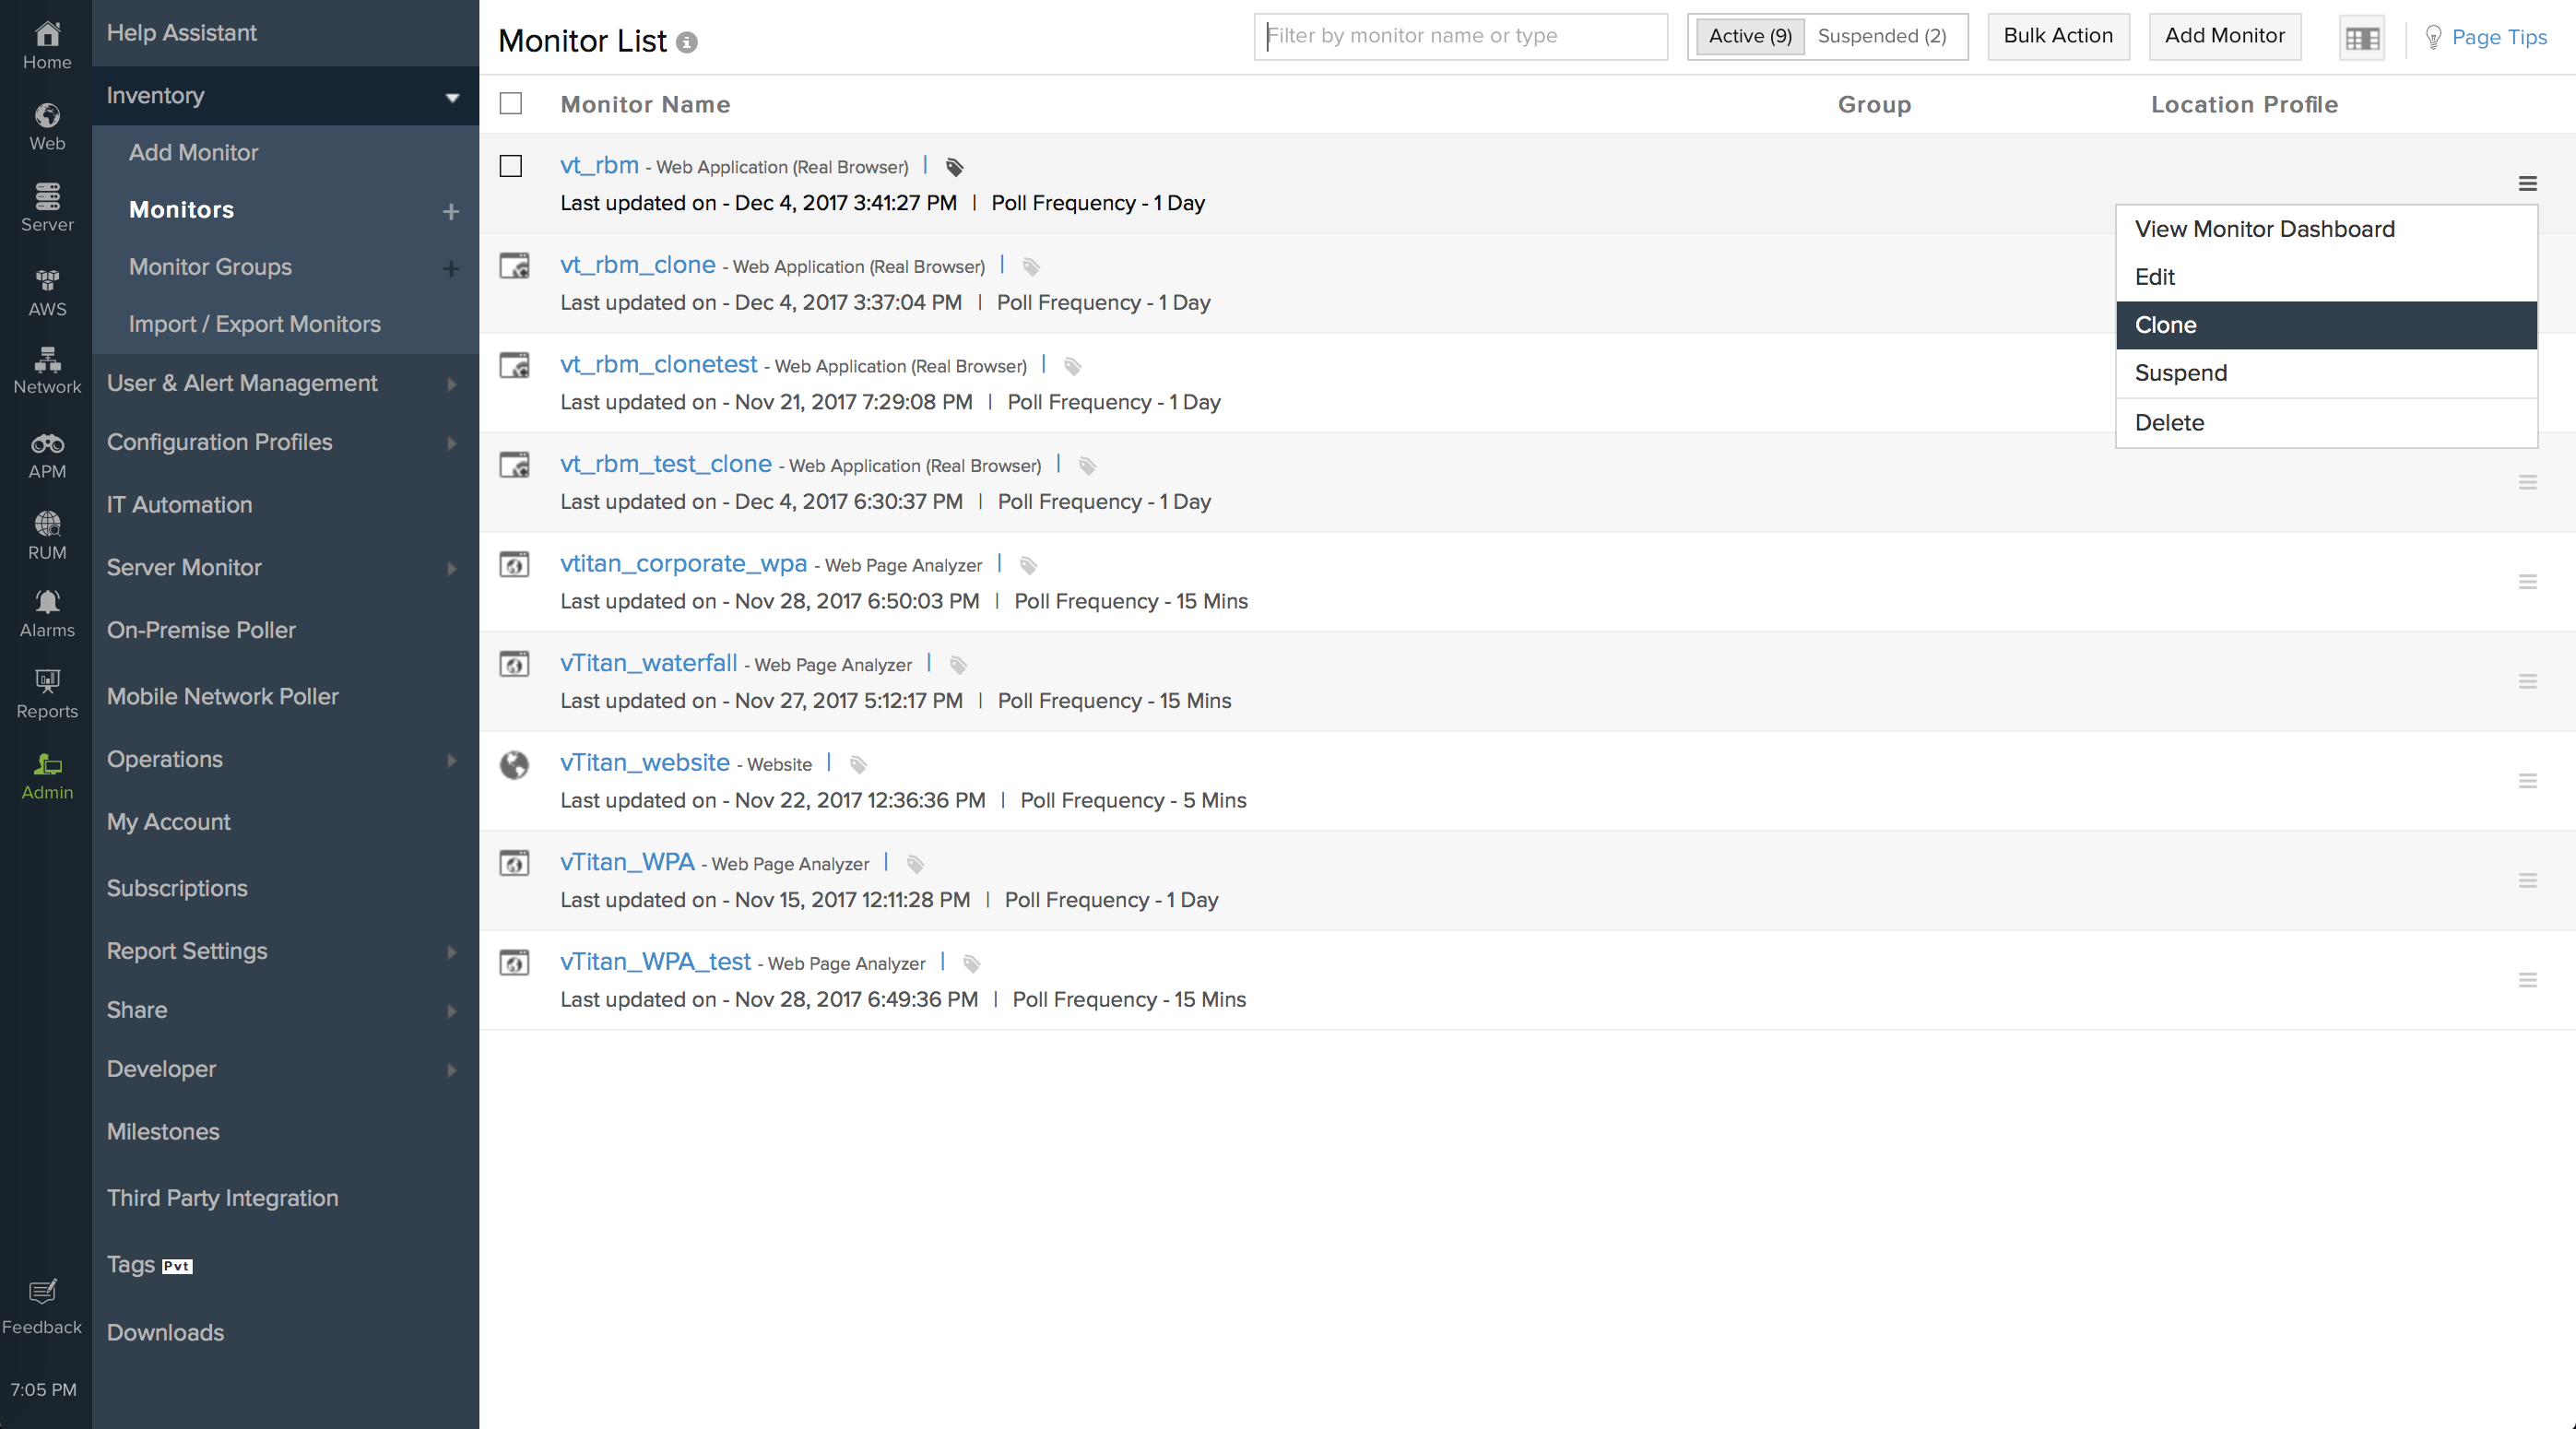
- You will be redirected to the Add Web Transaction (Browser) page. Here, you can make necessary changes to the Display Name, Base URL, Transaction Details, Configuration Details, HTTP Configuration, Configuration Profile, Alert Settings, and Third-Party Integrations.
- Under Transaction Details, you can edit the Step Details, Step Action, Content Checks, and URL Check. Click Save to save the transaction details.
- Click the Save button on the top-right corner of the page to create a Clone of the Web Transaction (Browser) monitor.
How to record applications with MFA and TOTP
Multi-factor authentication (MFA) and time-based one-time password (TOTP) are security measures to protect online accounts. They provide additional authentication to your account beyond the standard username and password.
This feature is only supported if the application is protected by a TOTP. TOTP is a type of two-factor authentication (2FA) method that relies on a mobile app like Google Authenticator, OAuth, or Microsoft Authenticator to generate a random code.
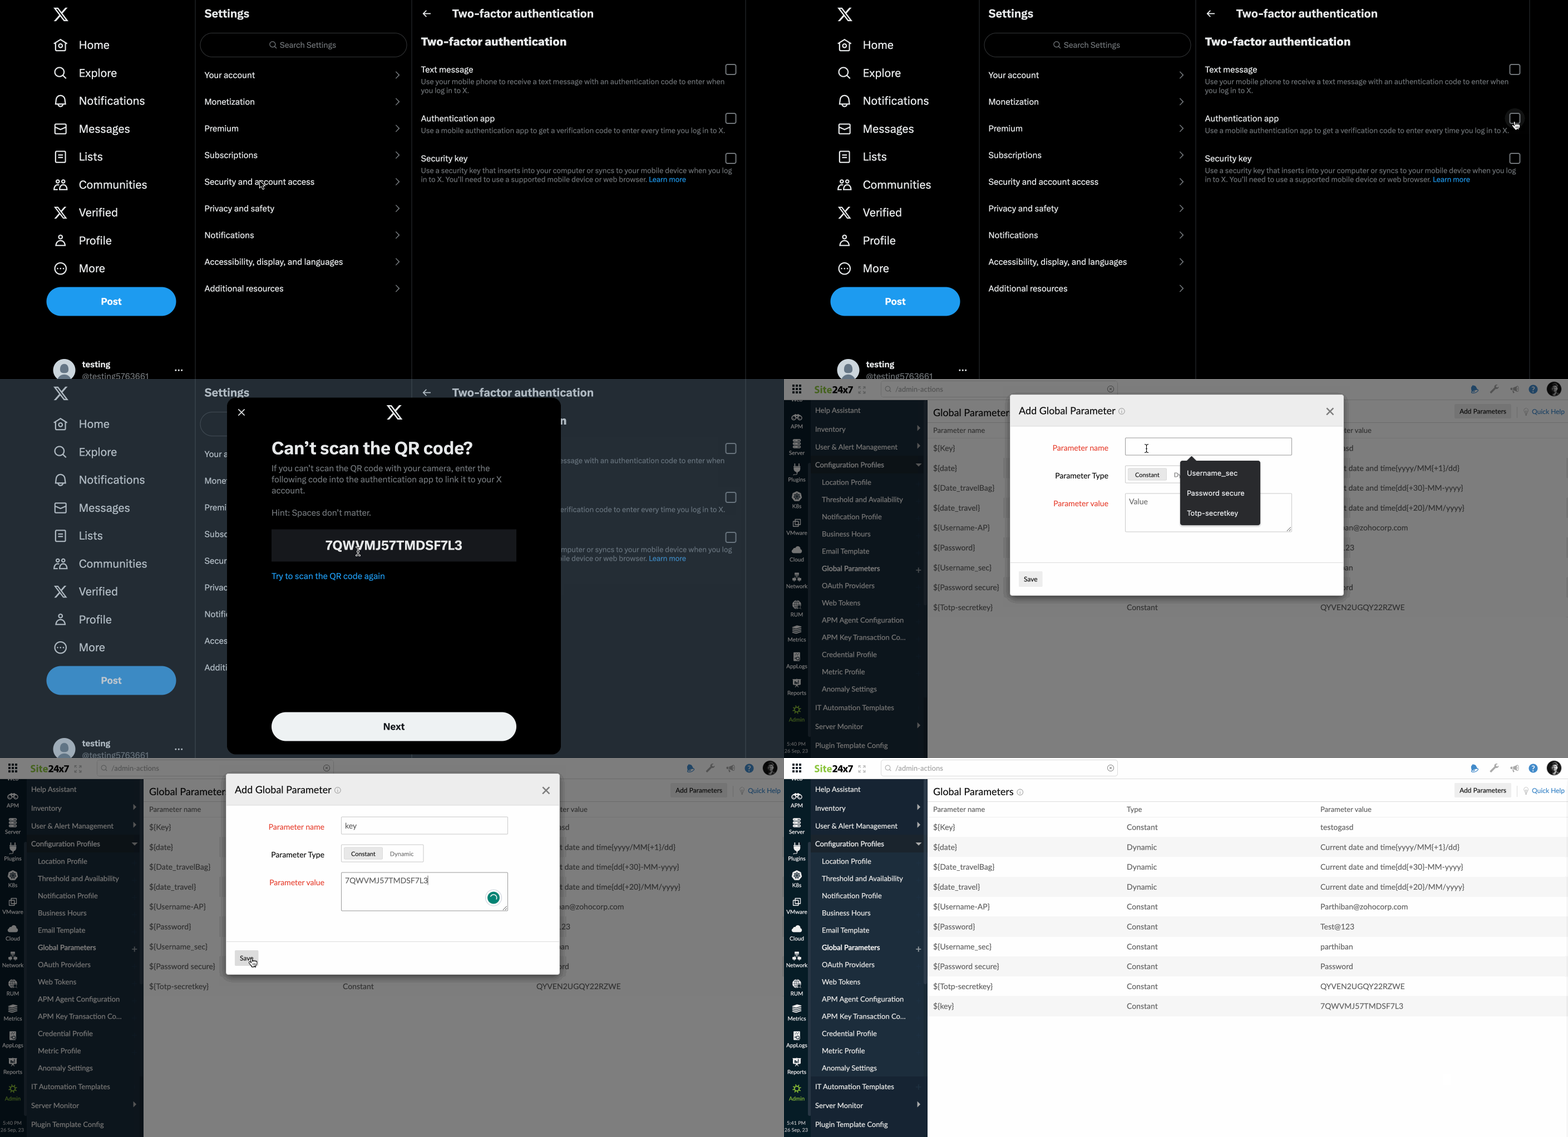
To monitor an application with MFA or TOTP using your recorder, you can copy your account's secret key from the website and add it as a Global Parameter in Site24x7. Ensure that you set the Parameter Type to Constant for seamless integration.
To add the secret key as a parameter, navigate to Admin > Configuration Profiles > Global Parameters. On the Global Parameters page, click the Add Parameters button. In the pop-up that opens, enter the MFA secret key as the Parameter Value.
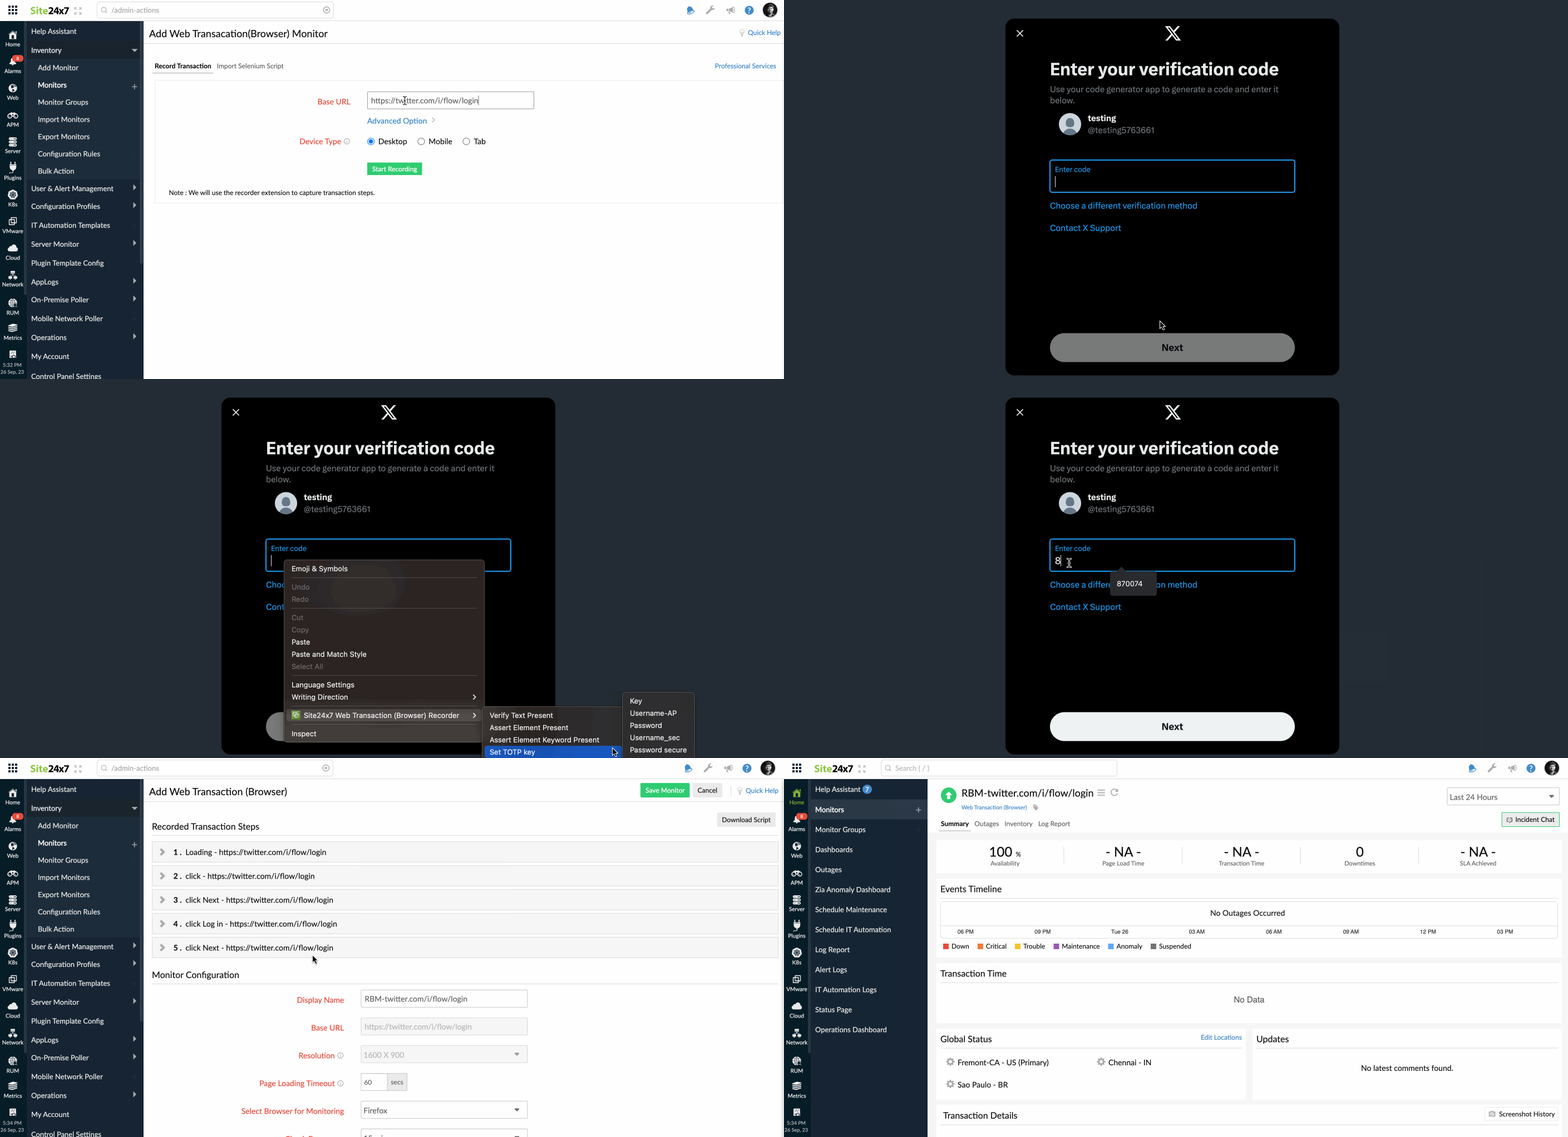
When recording your workflow, if you are prompted to enter the TOTP, perform the following actions:
- Right-click the field where you need to enter the TOTP.
- Select Site24x7 Web Transaction (Browser) Recorder from the list of options.
- Choose Set TOTP Key, and then choose the name of the global parameter you've created for the secret key.
Now, you can record the steps in the transaction and start monitoring.
How to add content checks while recording
A content check is the process of verifying the accuracy and quality of the content from any source before it is published.
You can also add content checks while recording the transaction. This allows you to select the content from the website and add the content check directly from the website.
When recording your workflow while adding or editing the transaction, follow these steps:
- Use your cursor to highlight the content from the website and right-click it.
- Click Site24x7 Web Transaction (Browser) Recorder from the list of options.
- Select Verify Text Present.
- Click Stop Transaction when the workflow is complete.
This will add a command to the web script assert_text_present("Contact us now", "true"), and the keyword will be added to the Transaction Details window in the Keywords to be present field.
Adding a content check is essential for ensuring content validation while performing the transaction recording.
Using Credential Profile in Web Transaction (Browser) monitor
Credential Profiles can be linked to both new and existing Web Transaction (Browser) monitors to securely and centrally manage authentication.
For example, Zylker uses Site24x7 Web Transaction (Browser) monitors to track critical user flows such as login and checkout. These monitors require valid credentials to complete authentication. Since application passwords are rotated periodically, updating hard-coded credentials in each monitor is time-consuming and error-prone.
By associating a Credential Profile with all relevant monitors, Zylker updates credentials in one place. Any change made to the profile is automatically applied to all linked monitors, ensuring consistent authentication and uninterrupted monitoring.
How to use a Credential Profile
Create and associate a Credential Profile for a new monitor
Follow this option to create and associate a Credential Profile while recording a new transaction.
- Log in to Site24x7.
- Navigate to Admin > Inventory > Add Monitor > Web Transaction (Browser).
- Record the transaction by entering the Base URL, username, and password during the login step. You can select Advanced Option to set specific configurations and thresholds for your monitor.
- Select a Device Type, then click Install Recorder.
- Once the monitor has been added, the credentials are captured and saved as a Credential Profile. The profile is automatically associated with the monitor.
Create and associate a Credential Profile for an existing monitor
Follow this option when credentials are already hard-coded in an existing transaction monitor.
- Log in to Site24x7.
- Navigate to Admin > Configuration Profiles > Credential Profile.
- Create a new Credential Profile by clicking the plus icon + next to Credential Profile in the navigation menu, or the Add Credential button in the top-right corner of the page.
- In the pop-up that appears, enter the required username and password, then click Save.
- In the left navigation menu, click the Web icon, then select Web Transaction (Browser).
- Choose the monitor for which you want to associate the Credential Profile, then click the hamburger icon
 and select Edit.
 - Associate the newly created Credential Profile using Edit Steps or Edit Web Script, as described below.
Edit Web Transaction (Browser): Edit Steps
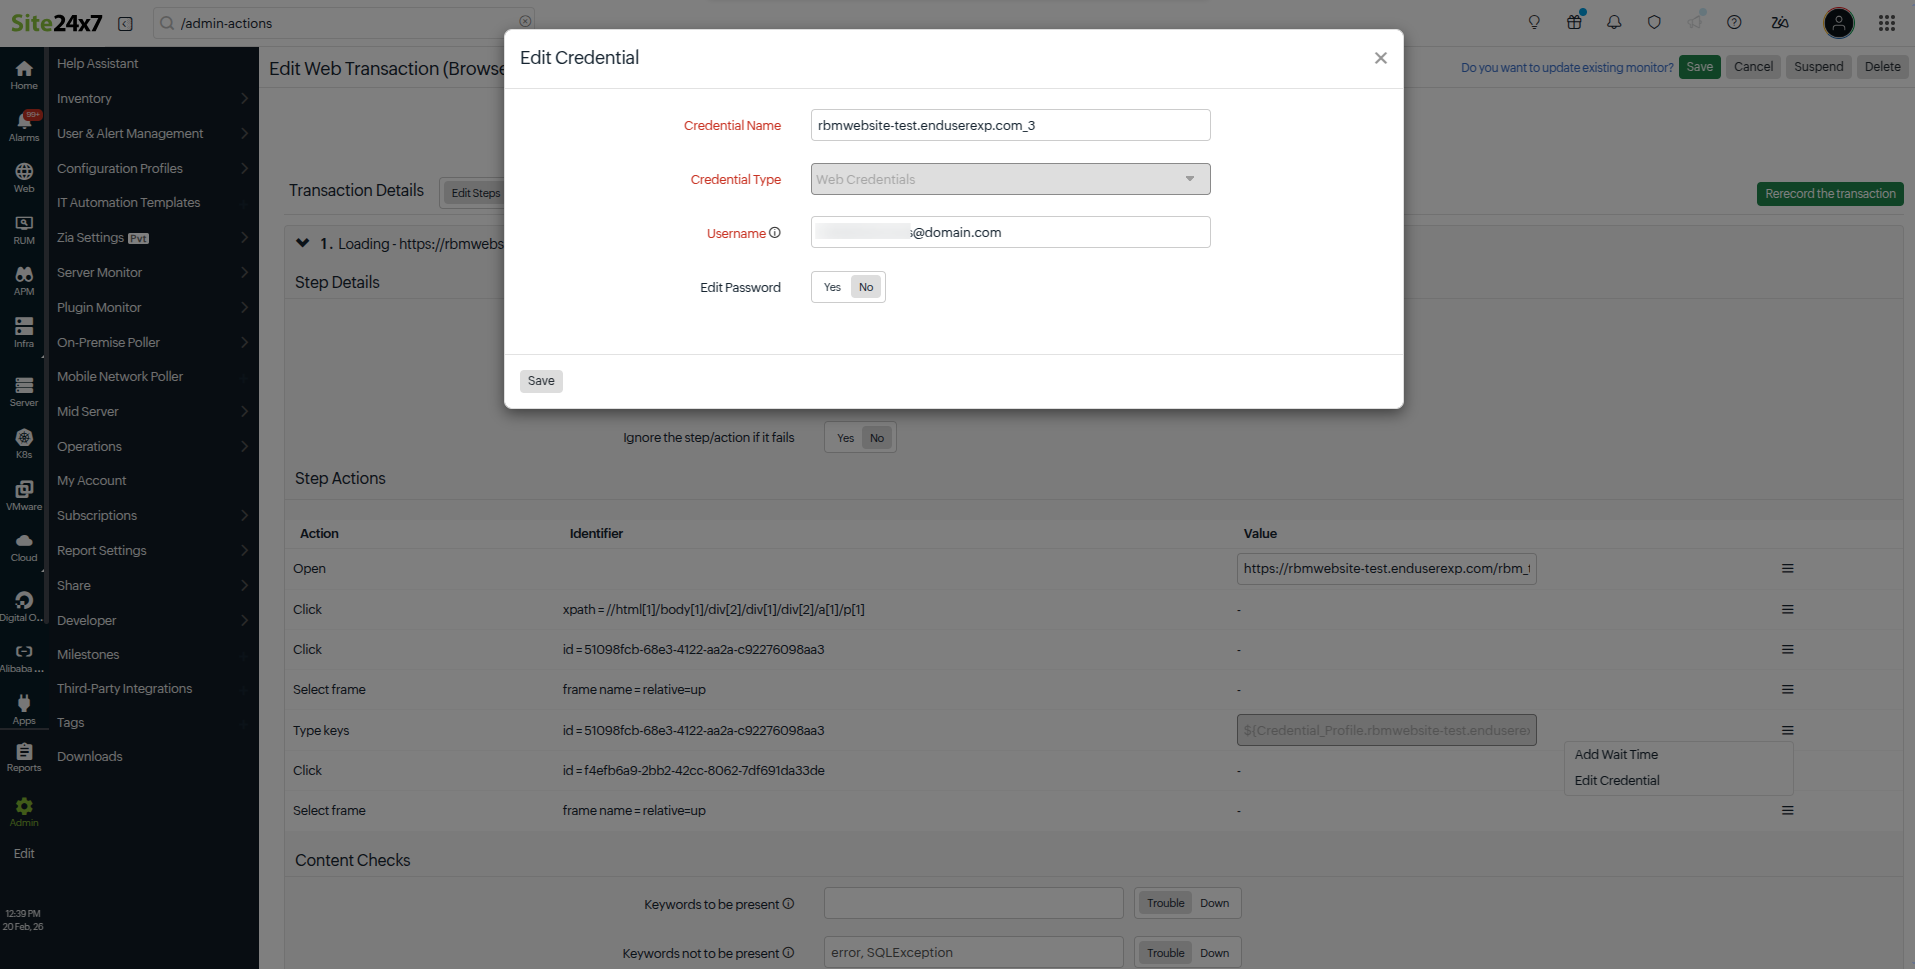
Use the Edit Credential option to associate or update credentials directly from the recorded transaction steps.
- Next to Transaction Details, select Edit Steps.
- Under Step Actions, locate the transaction step in the Action field by navigating to Type keys.
- Click the hamburger icon
 next to the step and select Edit Credentials.
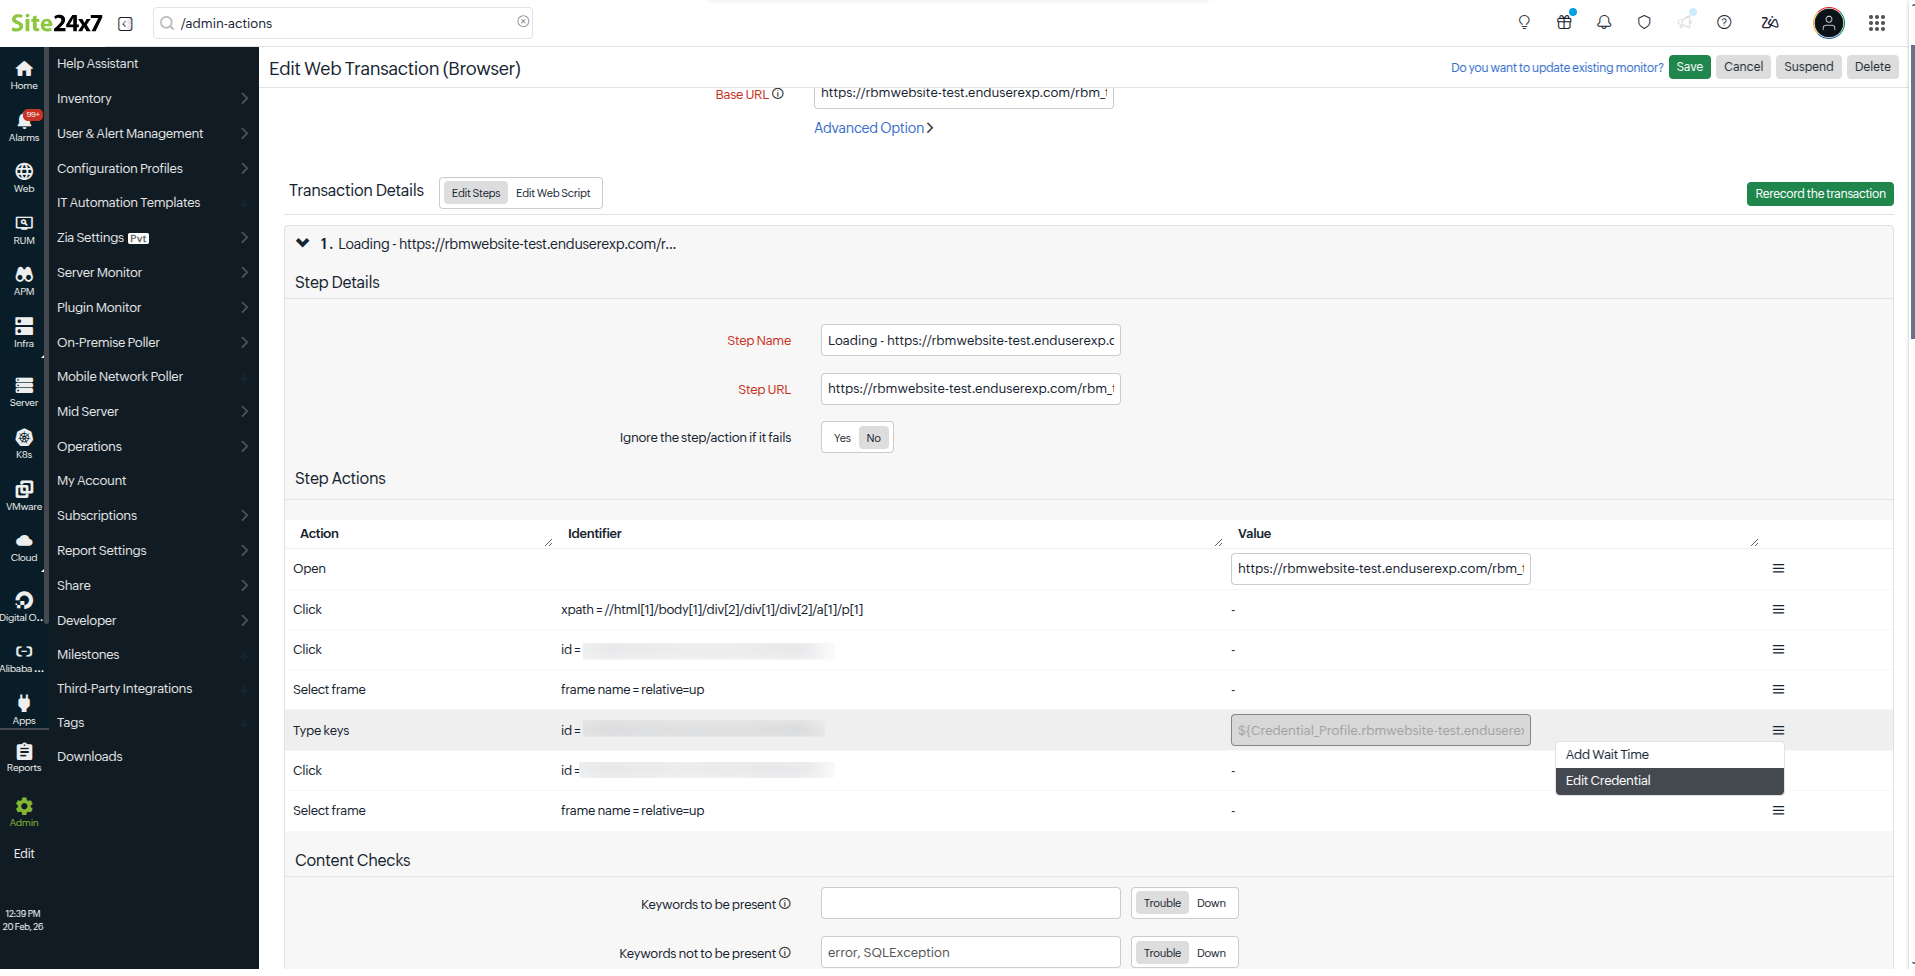
- In the Edit Credential pop-up, update the credential details and click Save.
Use the Edit Credential option to replace hard-coded credentials in the web script with a Credential Profile.- Next to Transaction Details, select Edit Web Script.
- Locate the hard-coded username and password values in the script. You can do this by searching for type_keys_by_id.
- Replace them with the appropriate Credential Profile variables.
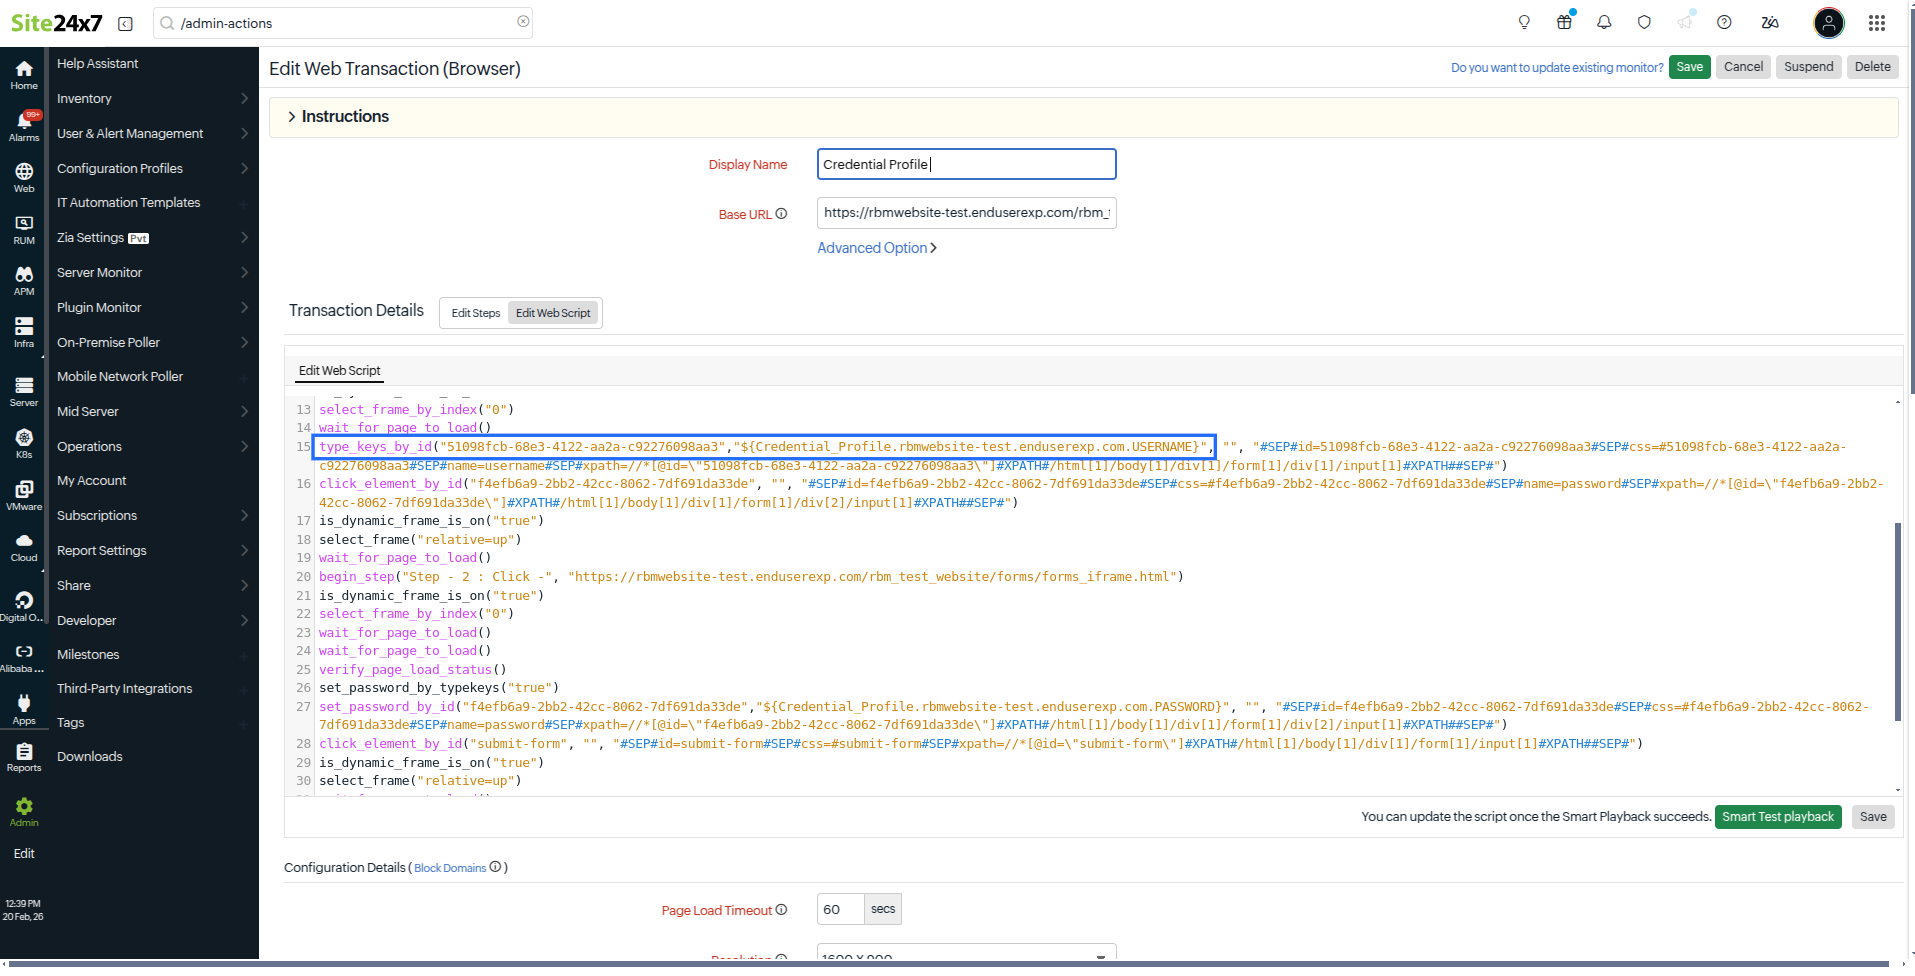
- Click Smart Test playback to check if the profile works.
- Once verified, click Save to save the monitor.
- All Credential Profiles can be used in a monitor by using the $ symbol. When you click $, a list of available Credential Profiles is displayed from which you can select the required one.
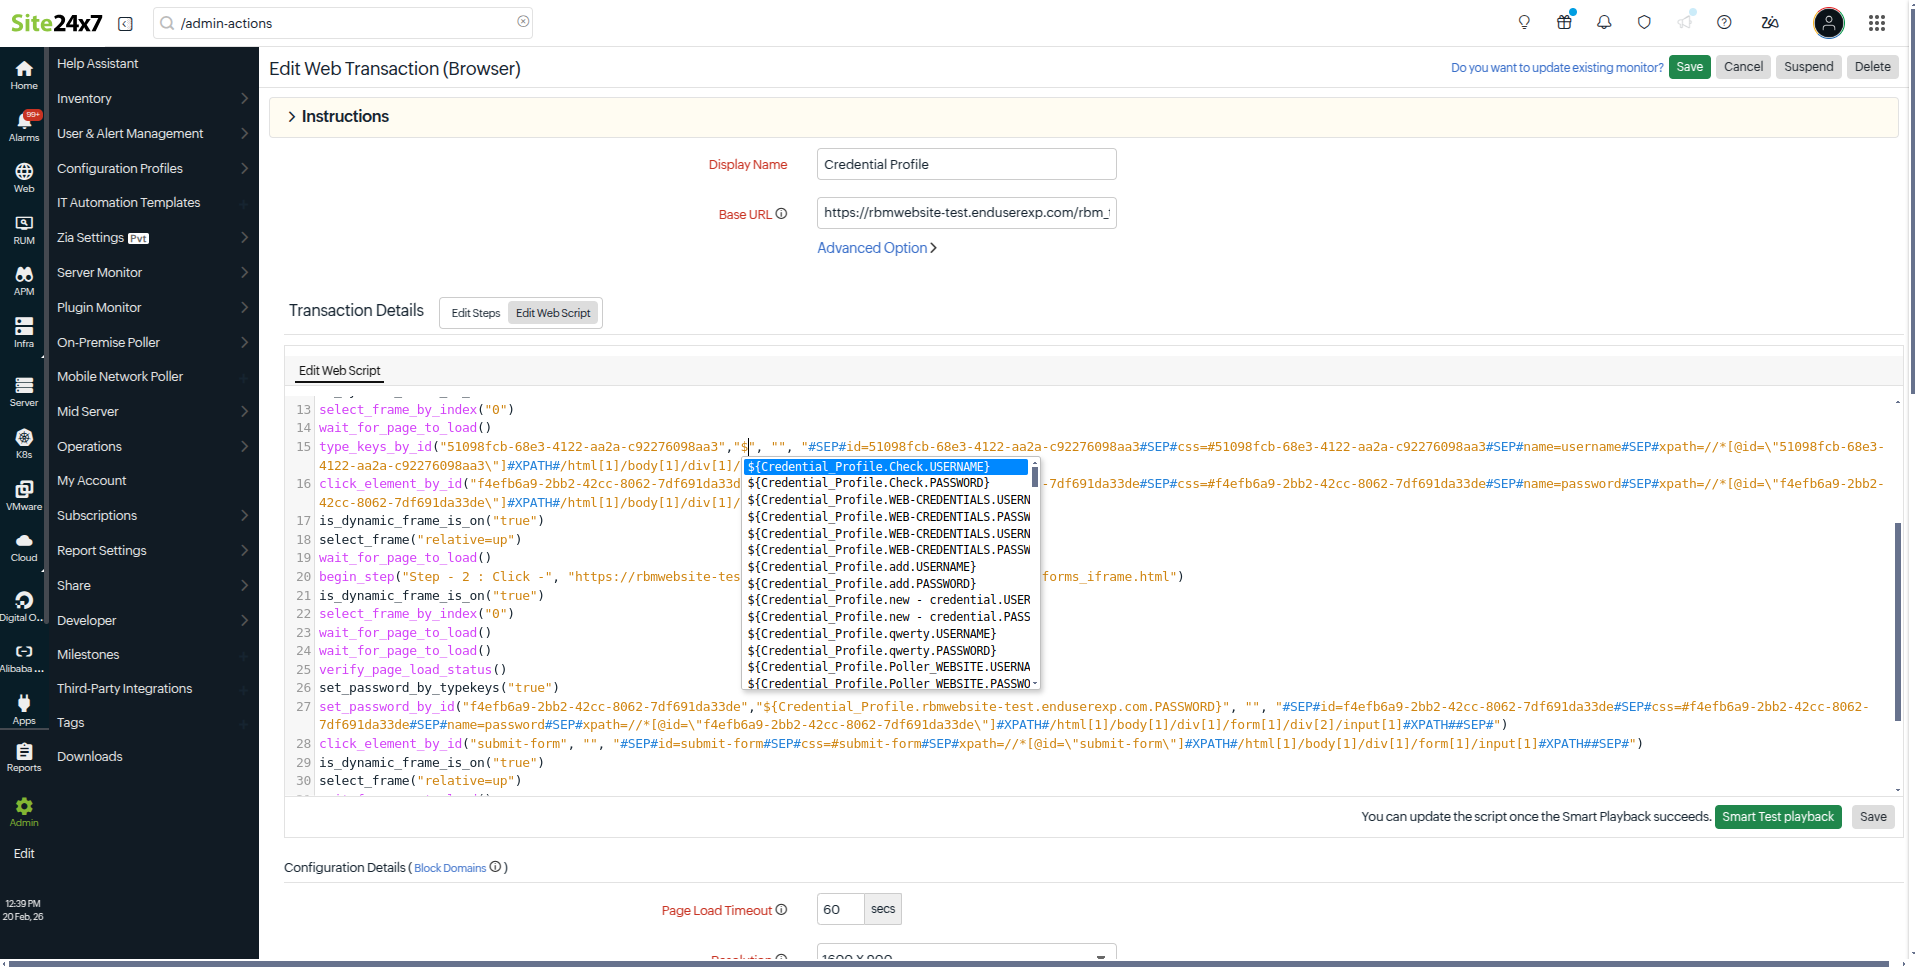
- All newly created Credential Profiles follow this naming format:
- $credential_
.USERNAME - $credential_
.PASSWORD
- $credential_
- This format allows credentials to be easily identified and reused across all monitors.
- To use credentials from a Credential Profile on an existing monitor, navigate to the Advanced Web Script section and select the required Credential Profile.
- Learn more about the various performance metrics of a Web Transaction (Browser).
- Learn more about synthetic monitoring.
Troubleshooting tips
- Open/import webscript to Web Transaction (Browser)
- Trouble in getting started with the Web Transaction (Browser) Recorder
- Can the page load time be increased beyond 45 seconds on the Web Transaction (Browser) monitor
- Monitor randomly changing attributes of my HTML elements using Web Transaction (Browser)
-
On this page
- How does it work?
- Use case
- Adding web transactions for Chrome and Edge
- Browser Add-ons (Firefox)
- Edit/modify Web Transaction (Browser) in the web client
- Edit Steps
- Web Script Editing
- Re-record the transaction
- Block Domains
- Clone web transaction (browser)
- How to record applications with MFA and TOTP
- How to add content checks while recording
- Using Credential Profile in Web Transaction (Browser) monitor
- Troubleshooting tips
