SOAP Web Service
The SOAP Web Service Monitor regularly checks the availability and performance of your SOAP based Web Services. It alerts you, whenever the response (XML) does not bear the specified SOAP attribute name or when the SOAP attribute value provided in response validation, does not validate against its corresponding SOAP attribute name. Now you can also monitor your dual stack infrastructure with Site24x7.
Add SOAP Web Service Monitor
- Login to Site24x7.
- Click Admin > Inventory > Monitors > Add Monitor.
- Select SOAP Web Service Monitor in Add Monitor page.
- Specify the following details to add the SOAP Web Service Monitor:
- Display Name: Provide an appropriate name for the web service which you desire to monitor.
- Endpoint URL: Type the SOAP web service endpoint URL which needs to be monitored. Click Get Operations to set-up and initiate the SOAP Wizard.
- SOAP message: Add the SOAP request xml data that is being used to invoke the web service. Once the SOAP XML response is successfully validated in the SOAP Wizard, click Save to Monitor to add the request XML data automatically to the Request Body.
- Check Frequency: Choose the required polling frequency. The frequency can be set from 30 seconds to 1 day. 30 secs can be configured if you're using Enterprise, Enterprise Web, Enterprise Plus Web, Elite and Elite Web Packs. For all other users 1 minute will be the minimum supported check frequency.
Note
Configuring 30 seconds check frequency will be consuming the license of two basic monitors.
- Monitoring Locations: Select a location profile from the dropdown list from where the webservice will be monitored. To know more, refer Location Profile.
- Specify the following details for Advance Configuration:
- Connection Timeout: Specify the time in seconds needed to establish a connection with the target server. If the connection is not established within the specified time, the website will be reported as down with "Could not establish connection" as the reason.
- Prefer IPv6: If you want to monitor your SOAP Web Service over IPv6 enabled locations, simply move the rocker button to "YES" when creating or editing a monitor form.
Note
- Site24x7 lets you monitor your dual-stacked IPv4/IPv6 based infrastructure as per you need. IPv4 will be enabled as the default protocol. You'll be able to monitor your IPv6 infrastructure, once you enable the rocker button to IPv6. If the connectivity over IPv6 fails, it will not fall back to IPv4 automatically. Read more.
- Enabling IPv6 in the monitoring form doesn't make it compatible to monitor IPv4, by default. If you want to monitor a resource, which is compatible with both IPv4 and IPv6–you'll have to set up two separate monitor checks for this.
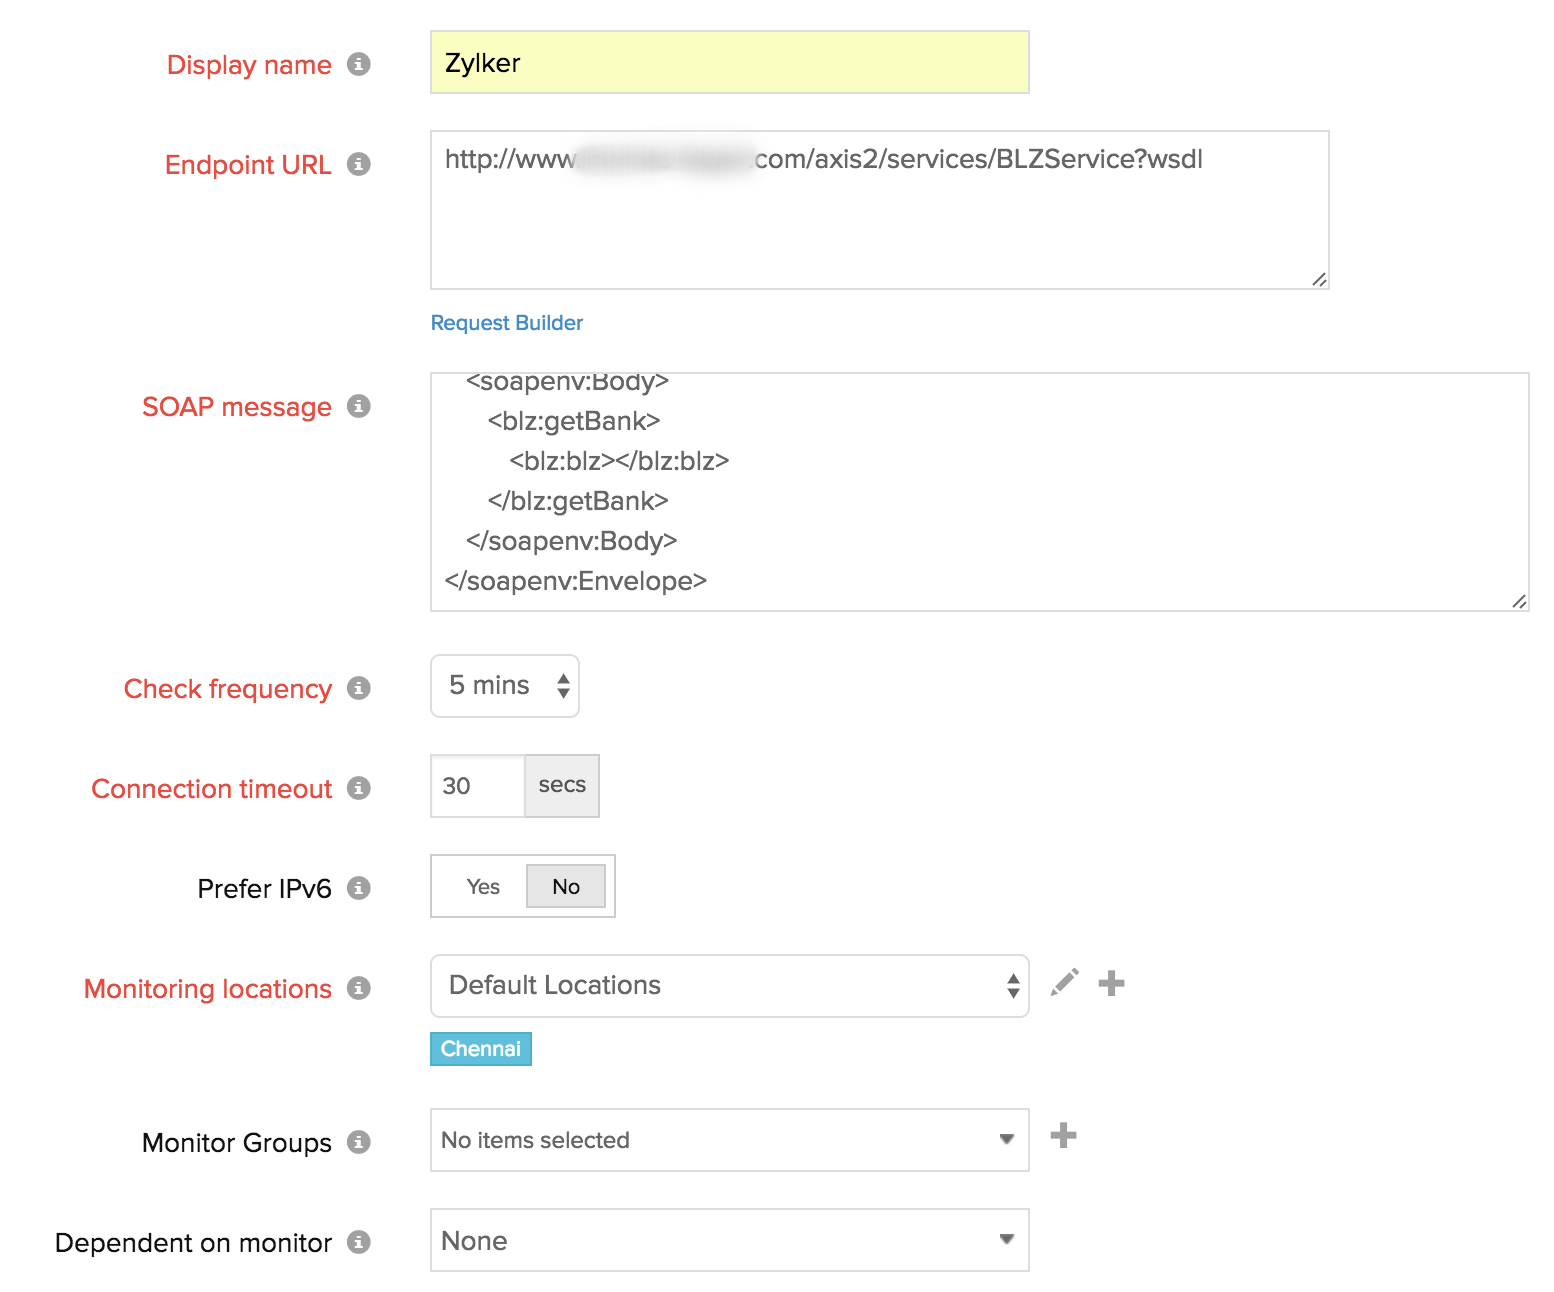
- Monitor Groups: You can associate your monitor with multiple monitor groups by selecting the relevant monitor groups from the drop down list. This allows in logical grouping of your monitors.
To learn how to create a monitor group for your monitors, refer Monitor Groups. - Dependent on Monitor: Select a monitor from the drop-down list to choose it as your dependent resource. You can add up to 5 monitors as dependent resources. Alerts to your monitor will be suppressed based on the DOWN status of your dependent resource.
Note- Configuring a dependent resource and suppressing alerts based on the dependent resource's status is part of providing you with better false alerts protection. Learn more about alert suppression at monitor level.
- If you select "None" in the dependent resource field, alerting will progress as per your normal configuration settings. No alerts will be suppressed in this case as the monitor doesn't have any dependent resource.
- Multiple monitor group support for monitors allow a monitor to be associated with multiple dependent resources in different monitor groups. If during a normal monitor status check, any one of these dependent resources' status is identified as DOWN, the alert for the monitor will be automatically suppressed. However, the dependency configuration at monitor level is always given the higher priority over any other monitor group level dependency configuration for suppressing alerts.
- SOAP Wizard: SOAP wizard takes a WSDL URL as an input and makes all operations supported in the web service. It generates a SOAP request XML, Endpoint URL and required request headers for a selected operation and also permits you to test its response. Define the following details to successfully undertake the test operation:
- Enter WSDL URL: Type the WSDL URL which requires to be monitored. Click Get Operations.
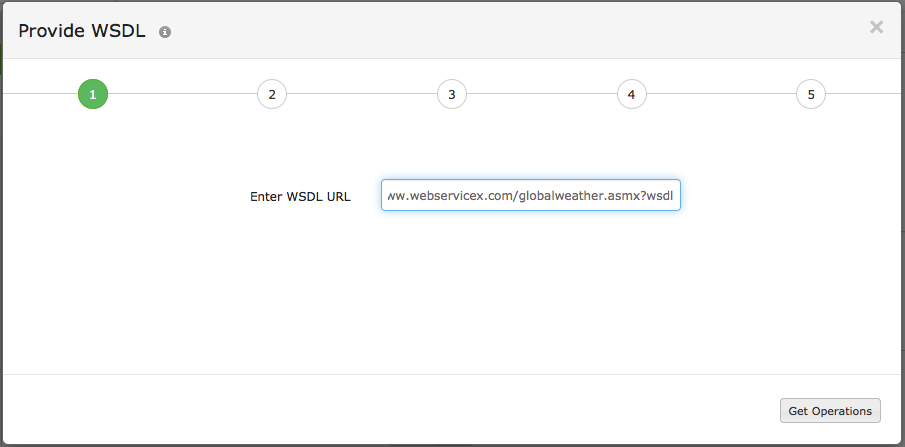
- Operations: Choose the required Operation from the drop down and click Show Request Inputs.

- Configure Input Values: Add requisite value against its corresponding parameter and click Generate SOAP Request XML.
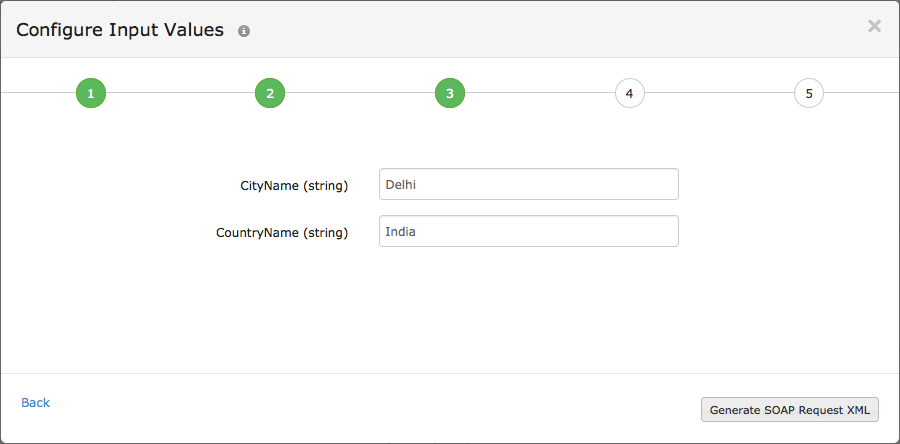
- Initiate Request: Click Test Operation to validate the SOAP Request XML.
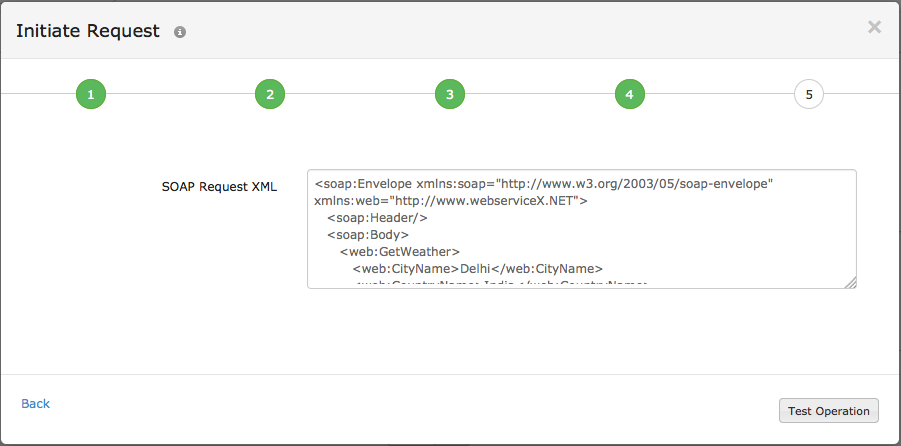
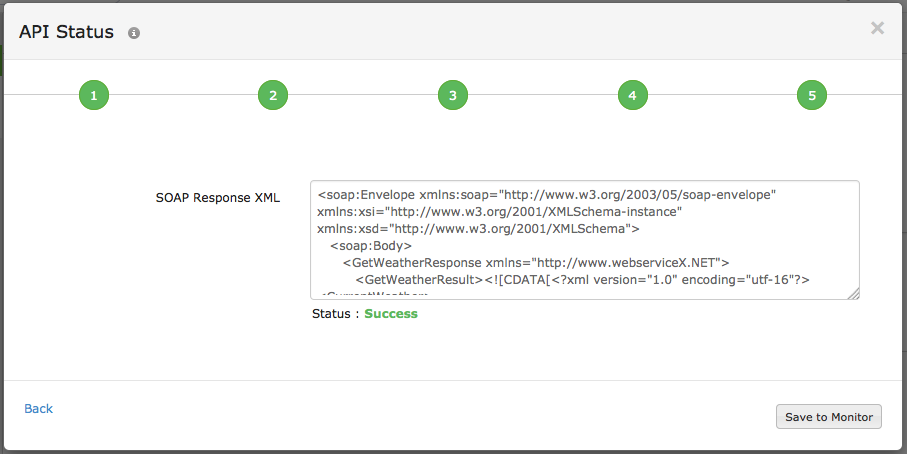
- API Status: At one time the SOAP Response XML is successfully validated, click Save to Monitor to add the request XML data to the Request Body.
- Enter WSDL URL: Type the WSDL URL which requires to be monitored. Click Get Operations.
- Specify the following details for HTTP Configuration:
- HTTP Request Headers: Sometimes, you might want to customize the default HTTP request header information. In such cases, the additional header name and header value can be added here.
Note
To use a credential profile in HTTP Configurations, type $ and a list of available credential profiles will appear—select the desired one from this list. Learn more about credential profiles.
- User Agent: Set a customized user agent (web browser) for sending your request and the HTTP headers. You can choose from the available user agents.

- Authentication Method: Manage multiple authorization methods for your monitors.
- Basic/NTLM: Configure your Basic/NTLM-based authorization. Windows NTLM is the authentication protocol used on systems running on Windows.
- Web Credentials: Choose your web credentials for URLs requiring Basic/NTLM-based authentication from the drop-down. Learn how to add/ edit credentials.
- OAuth: Pick the OAuth radio button if you're monitoring a resource that is secured by the OAuth framework.
- OAuth Provider Name: Select the OAuth Provider Name from your preconfigured list or create a new OAuth profile by clicking the + button.
NoteLearn how to configure an OAuth Provider.
- OAuth Provider Name: Select the OAuth Provider Name from your preconfigured list or create a new OAuth profile by clicking the + button.
- Kerberos/Negotiation: If you are monitoring a resource secured by Kerberos authentication, select the Kerberos/Negotiation radio button.
- Kerberos Authentication: Select the Kerberos credential profile from your preconfigured list or create a new Kerberos authentication profile by clicking the (+) button.
NoteKerberos authentication is supported only for On-Premise Poller locations.
Learn how to configure a Kerberos credential profile.
- Kerberos Authentication: Select the Kerberos credential profile from your preconfigured list or create a new Kerberos authentication profile by clicking the (+) button.
- Client Certificate: For websites that require client certificate authentication, upload the client certificate (has to be a PKCS#12 file.)

- Basic/NTLM: Configure your Basic/NTLM-based authorization. Windows NTLM is the authentication protocol used on systems running on Windows.
- Query Authoritative Name Server: Use the toggle button to decide if you want to resolve your domain name by an authoritative name server.
- Accepted HTTP Status Codes: Provide a comma-separated list of HTTP status codes that indicate a successful response. You can specify individual status codes, as well as ranges separated with a colon. Learn more about Accepted HTTP Status Codes.
- SSL Protocol: Specify the version number of the TLS/SSL protocol (TLSv1.3, TLSv1.2, TLSv1.1, TLSv1, and SSLv3 supported) to validate proper SSL handshake. Use Auto mode to enable automatic detection and negotiation.
Note
SSL Protocol validation works only for HTTPS domains. If you've specified a different SSL protocol version than the actual one, the monitor status fails during the poll.
- HTTP Protocol: Choose the preferred version of the application-layer protocol (HTTP/1.1 or HTTP/2) to be used for negotiation.
- Enable ALPN: Enable ALPN to ensure that only supported application protocols are sent as part of the TLS handshake and ensure reduced round trip time. By default, it'll be set to Yes. Enable ALPN option isn't supported by On-Premise Poller. We'll be extending the support in the next update.
- HTTP Request Headers: Sometimes, you might want to customize the default HTTP request header information. In such cases, the additional header name and header value can be added here.
- Specify the following details for Content Checks:
- XML node or attribute: Configure the expected SOAP Attribute Name and SOAP Attribute Value to validate the expected XML response.
- Alert severity: Use the toggle button to trigger a trouble or down alert.

- Should contain HTTP Response Header(s): Enter the desired response header and values for your HTTP request and verify whether the HTTP headers are present or the values match with the desired response. Trigger a trouble or down alert during a check failure.
While configuring the response header check, you must add values based on the following conditions:- You can add multiple headers and each header can accept multiple values.
- A single value can be configured with/without any double quotes (eg.: keep-alive or "keep-alive").
- In case you have multiple header values configured, you will have to separate them with a space and also use double quotes for each of them. (eg., "gzip" "br").
- Header value can also support regex validation. The regex pattern should be "${
}". For example : ${\d{4}} can be used to search for four continuous digit numerical value in the value of the header configured in the header name.
-
HTTP Response Header Severity : Use the toggle button to specify the Alert Severity as DOWN or TROUBLE. When the test fails an alert will be automatically triggered.

- Specify the following details for Configuration Profiles:
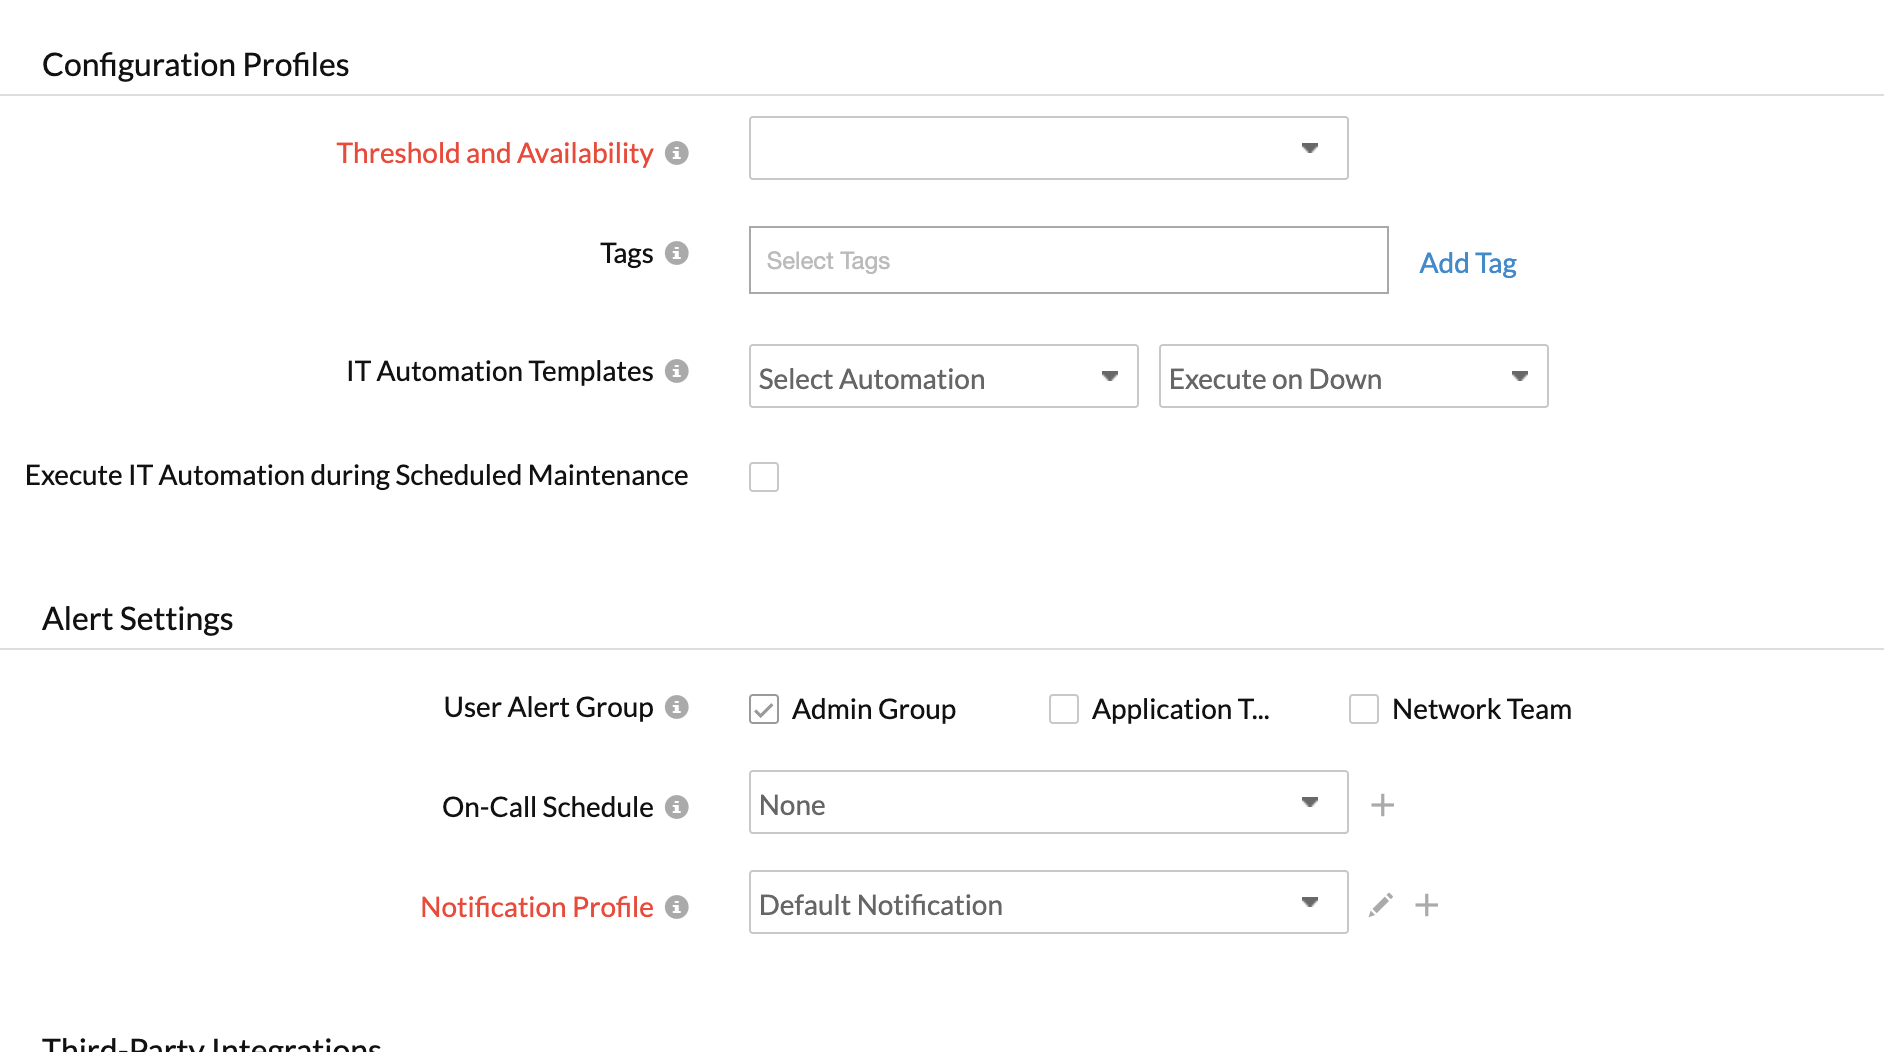
- Threshold and Availability: Select a threshold profile from the drop down list or choose the default threshold set available and get notified when the resources cross the configured threshold and availability.
To create a customized threshold and availability profile, refer Threshold and Availability. - Tags: Associate your monitor with predefined Tag(s) to help organize and manage your monitors creatively. Learn how to add Tags.
- IT Automation Templates: Select an automation to be executed when the website is down/trouble/up/any status change/any attribute change. The defined action gets executed when there is a state change and selected user groups are alerted.
To automate corrective actions on failure, refer IT Automation. - Exclude IT Automation during Scheduled Maintenance: Use the check box to enable this option and to exclude automation during maintenance.
- Threshold and Availability: Select a threshold profile from the drop down list or choose the default threshold set available and get notified when the resources cross the configured threshold and availability.
- Alert Settings:
- User Alert Group: Select the user group that need to be alerted during an outage. To add multiple users in a group, see User Groups.
- On-Call Schedule: The On-Call Schedule option helps you to ensure that the notifications are sent to assignees in specific shift hours helping them to quickly respond to alerts or incidents. Choose an On-Call of your preference from the drop-down.
- Notification Profile: Choose a notification profile from the drop down or select the default profile available. Notification profile helps to configure when and who needs to be notified in case of downtime. Refer Notification Profile to create a customized notification profile.
NoteYou can receive alerts if the monitors are associated to user groups irrespective of the On-Call shift you've configured.
- Third-Party Integrations: Associate your monitor with a pre-configured third-party service. It lets you push your monitor alarms to selected services and facilitate improved incident management.
NoteIf you haven't setup any integrations yet, navigate across to ”Admin > Third Party Integration” to create one. Tell me more.
- Click Save.
NoteOnce the monitor setup is completed, Site24x7 deep discovery wizard scans your domain and auto detects all related internet resources for your domain that can be added to your account for a comprehensive internet services monitoring. Explore more about internet services deep discovery.
Learn more about the various performance metrics of a SOAP Web Service Monitor.
