Website Management | North America
Key Findings
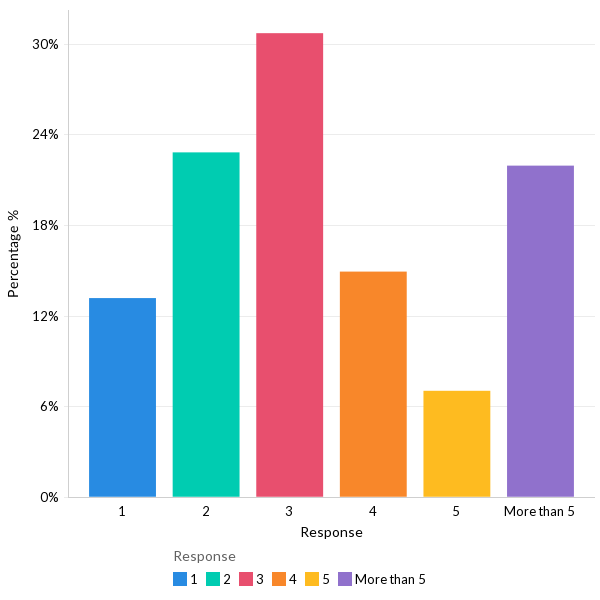
Average number of domains #
34% of respondents reported that they manage less than five domains.
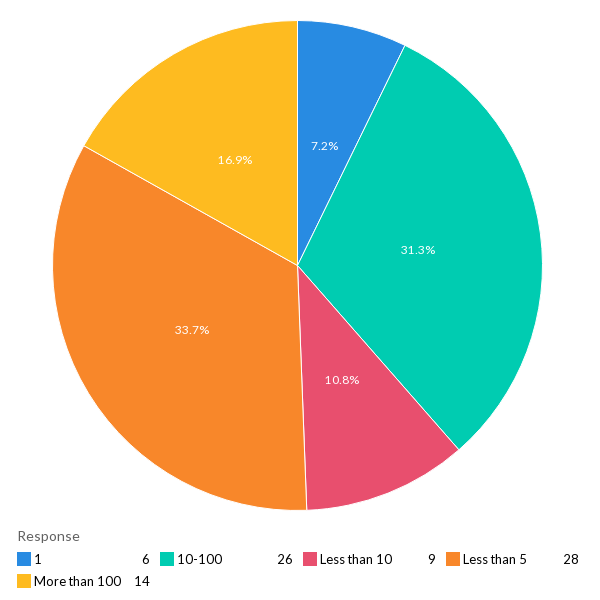
DNS Services #
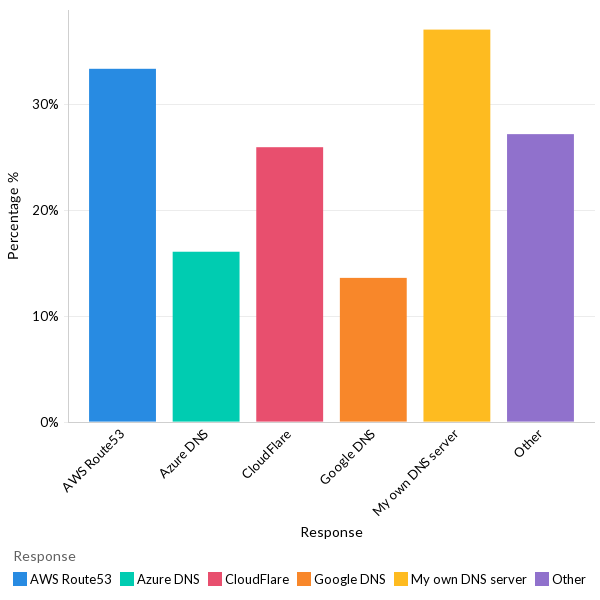
37% of the respondents reported that they run their DNS servers, closely followed by Amazon Route 53 (33%).
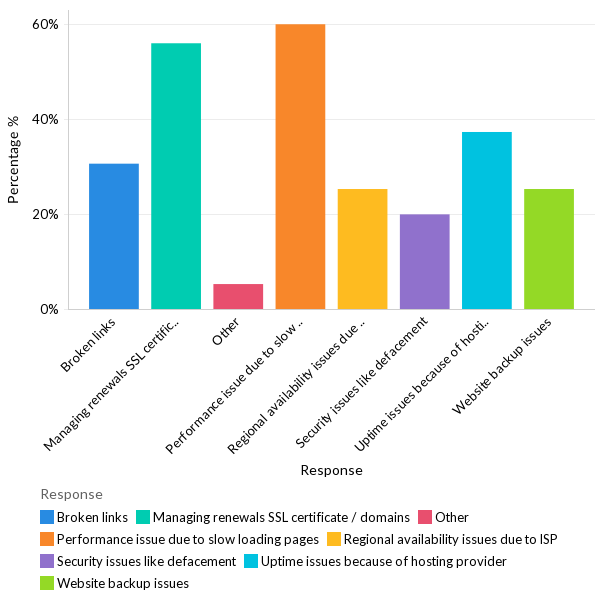
Website hosting issues #
60% of respondents reported slow-loading pages as the primary issues faced during website hosting, closely followed by renewing SSL certificates/domains (56%).
Importance of website monitoring #
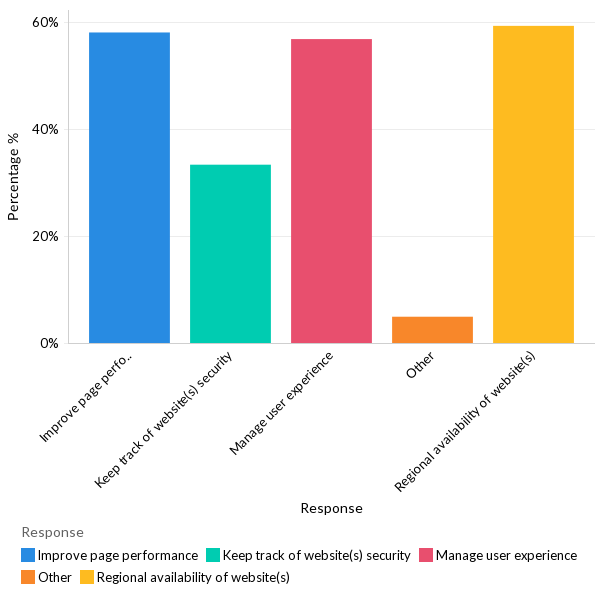
Improving page load performance, ensuring regional availability, and managing user experience received an equal number of responses.
Infrastructure Management | North America
Key Findings
Infrastructure provisioning #
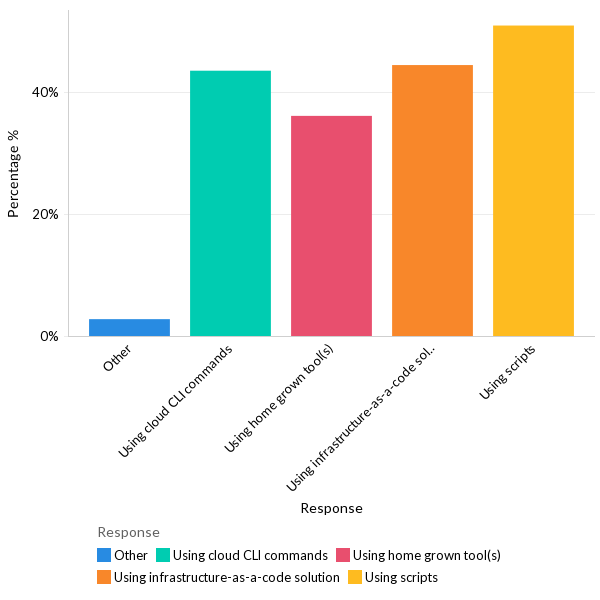
51% of respondents reported scripts as the preferred way of provisioning infrastructure, closely followed by infrastructure as code (IaC) tools and CLI commands (44%).
Container orchestration services #
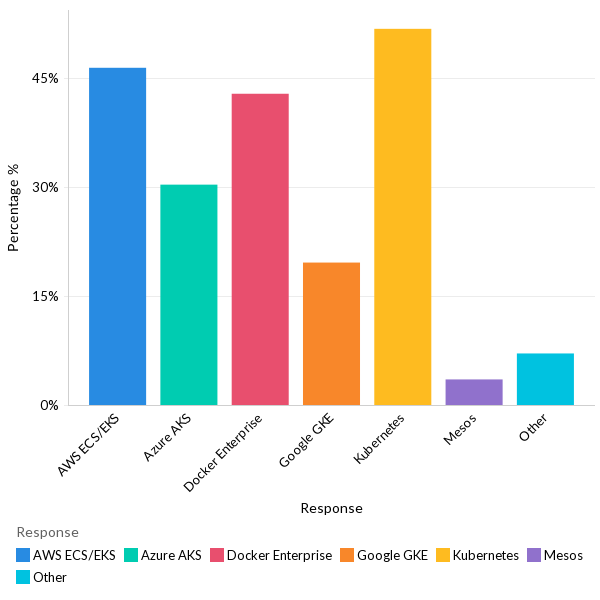
52% of respondents reported Kubernetes as the container service used in production, followed by AWS ECS/EKS (46%) and Docker Enterprise (43%).
Container technology adoption #
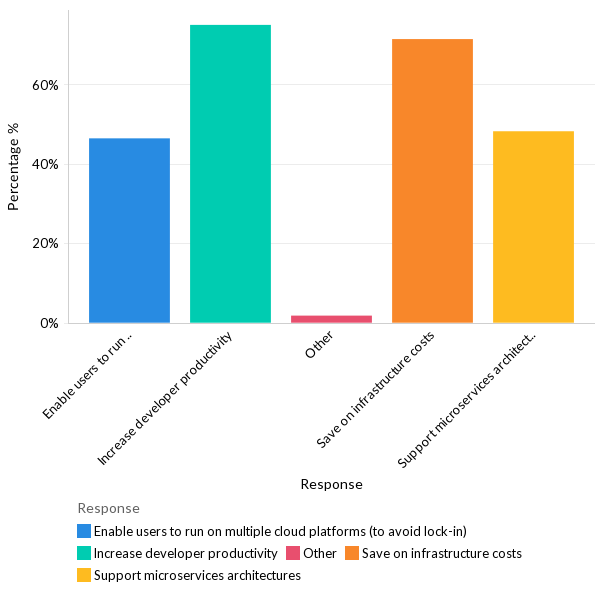
Developer productivity improvements and infrastructure cost savings are both (75%) the primary reasons for adopting container technology.
Containerization challenges #
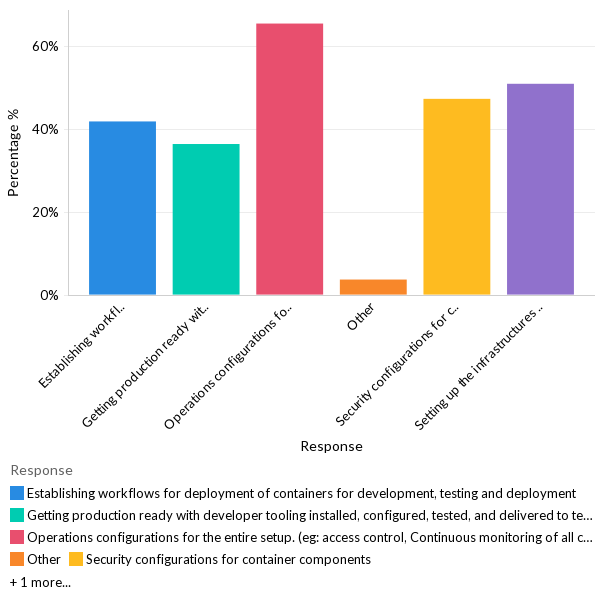
65% of respondents reported setting up operational configurations as the primary challenge of containerization, followed by setting up infrastructure (51%).
Patch Management #
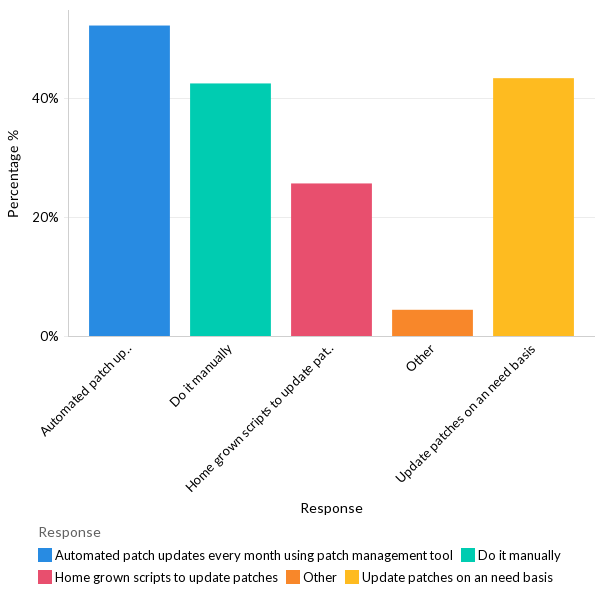
52% of respondents reported that they apply updates to the software every month using an automated patch management tool.
Data backup techniques #
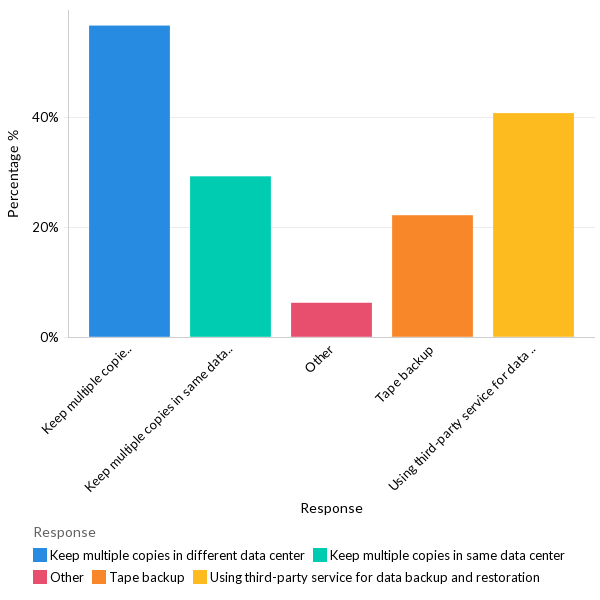
57% of respondents reported storing copies of data on multiple data centers. 41% said they use a third-party solution for scheduling and automating backups.
Application Management | North America
Key Findings
Version control software #
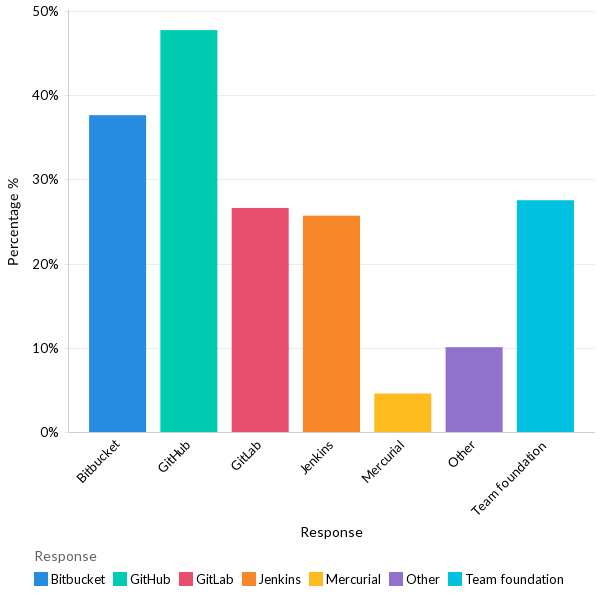
48% of respondents use GitHub as version control, with more than 37% using Bitbucket.
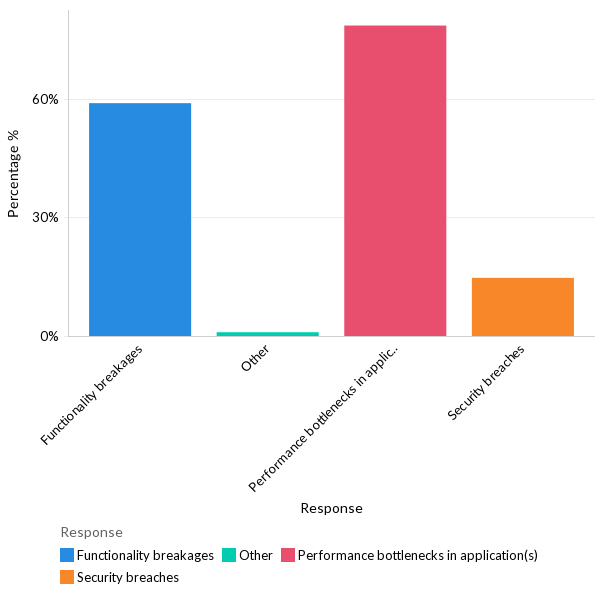
performance issues in production #
78% of respondents reported performance bottleneck as the major issue faced in production applications, followed by functionality breakages (59%).
Ensuring app performance #
58% of the respondents reported identifying infrastructure bottlenecks as the top method to ensure consistent application performance, closely followed by monitoring end-user experience (56%).

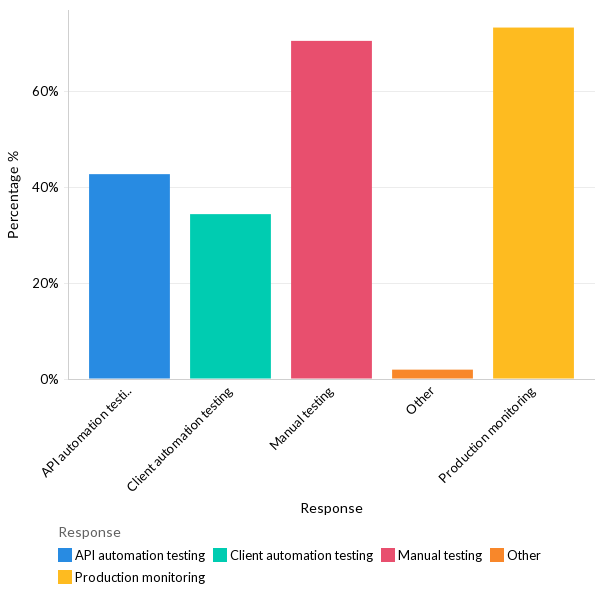
Managing breaking changes #
73% of respondents reported production monitoring as the best method to manage breaking changes, closely followed by manual testing (70%).
IT Ops Management | North America
Key Findings
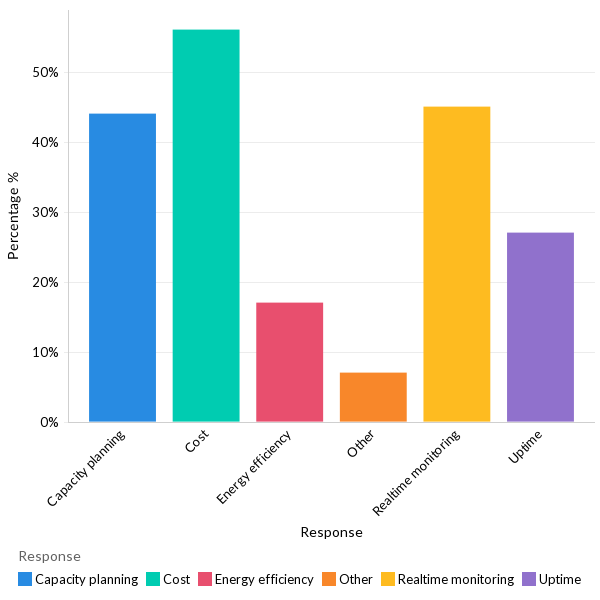
Data center challenges #
56% of respondents reported reducing operating costs as the top challenge faced in data center management, followed by real-time monitoring (45%) and capacity planning (44%).
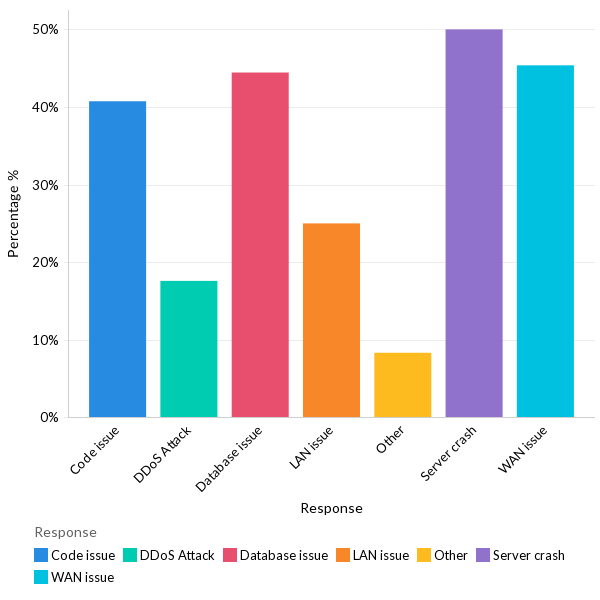
Data center outages #
50% of respondents reported server crashes as the top reason for data center outage, followed by WAN issues (45%) and database issues (44%).
Common WAN issues #
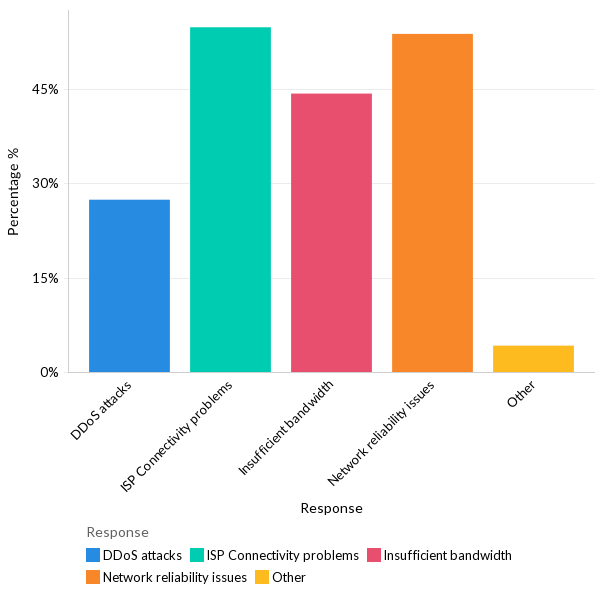
Network reliability issues and ISP connectivity problems are both (55%) the top WAN issues faced.
Improvement areas #
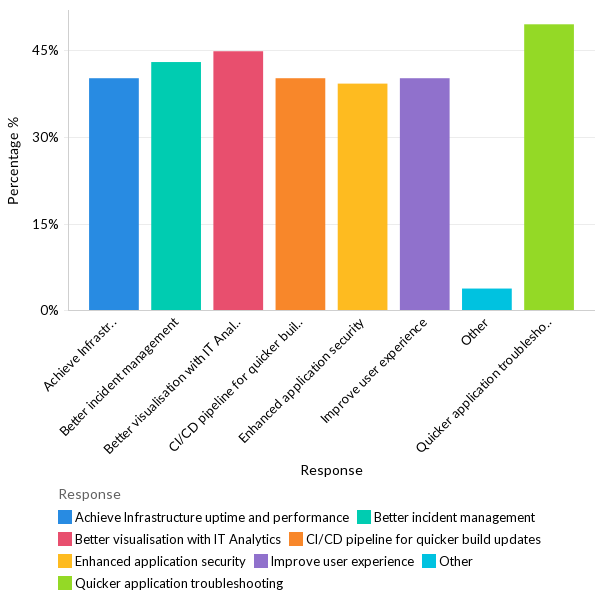
50% of the respondents reported application troubleshooting as an area of improvement, closely followed by visualization (45%), incident management (43%), and infrastructure uptime (40%).
Impact of AIOps #
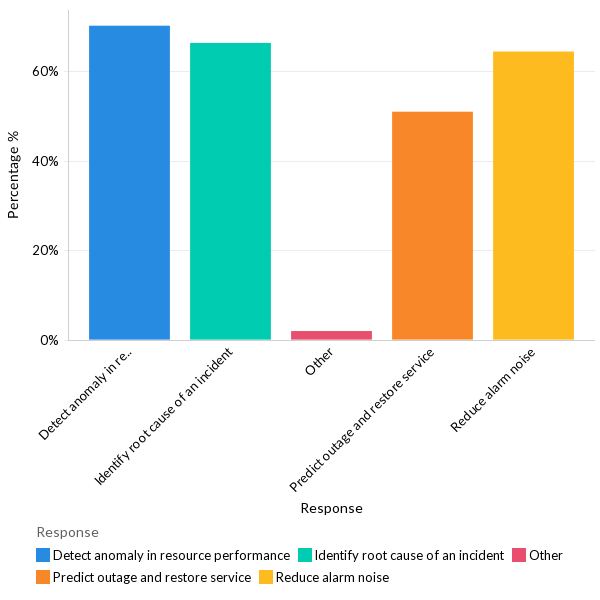
70% of the respondents reported anomaly detection as the main benefit of AIOps, followed by identifying the root cause (66%) and reducing alarm noise (64%).
Monitoring expectations #
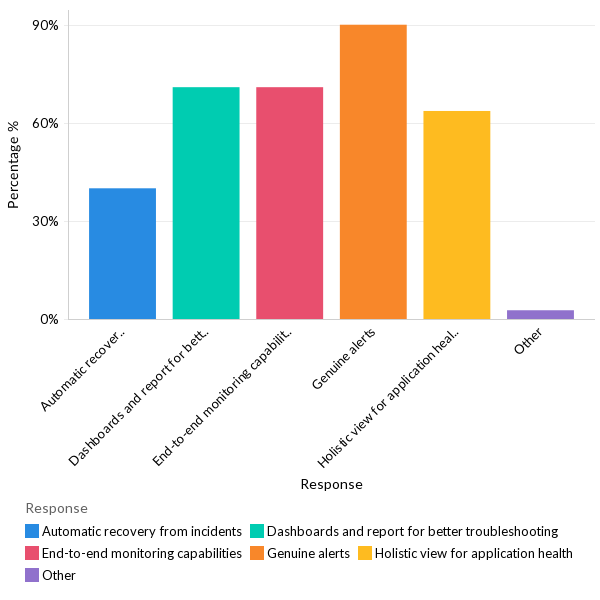
90% of the respondents reported genuine alerts as the chief expectation of a monitoring tool, followed by dashboards and reports for troubleshooting and end-to-end monitoring capabilities (71%).
Average no of monitoring tools
34% of respondents reported they use three monitoring tools.
