Website Management | Middle East & Africa
Key Findings
Average number of domains #
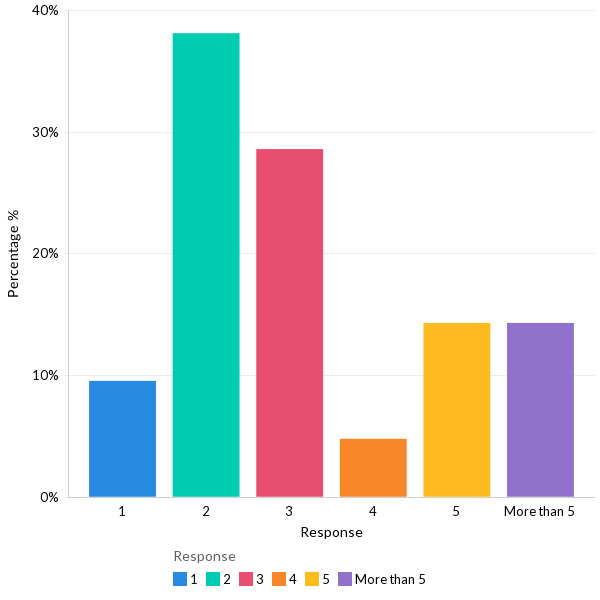
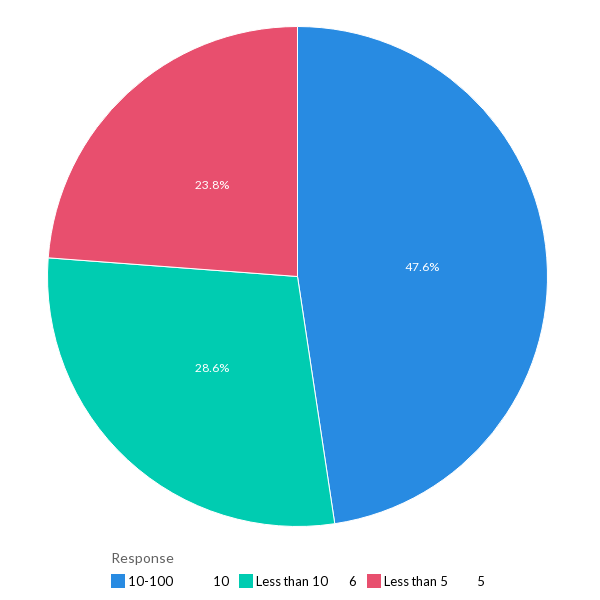
48% of respondents reported that they manage anywhere between 10-100 domains.
DNS Services #
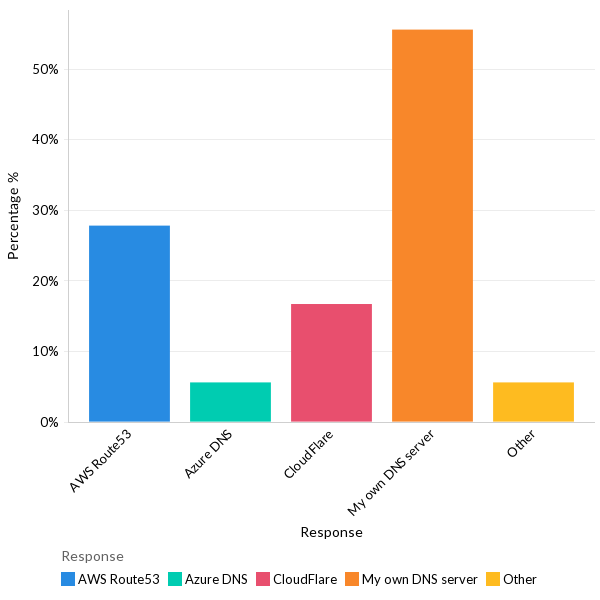
56% of the respondents reported that they run their DNS servers.
Website hosting issues #
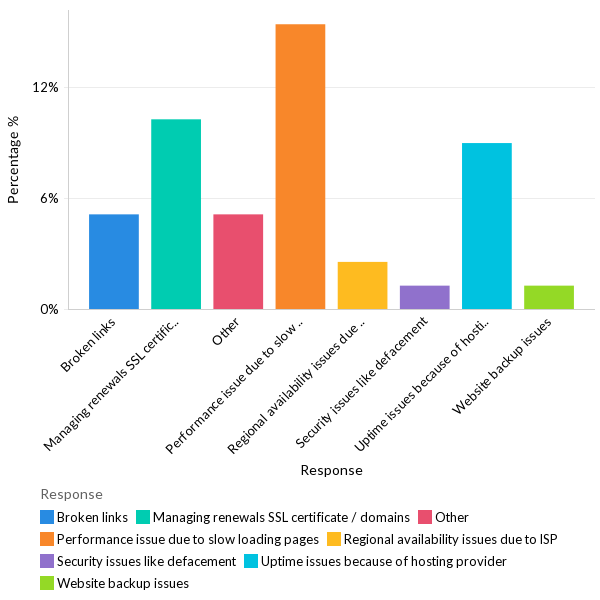
60% of respondents reported slow-loading pages as the primary issues faced during website hosting.
Importance of website monitoring #
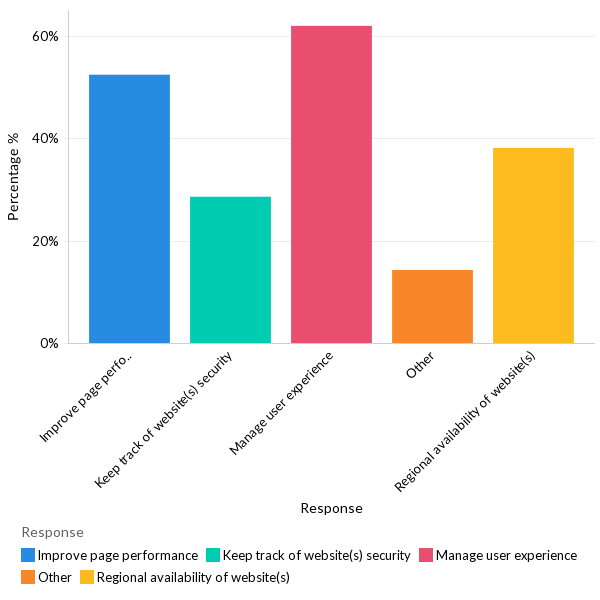
62% of respondents reported managing user experience as the primary reason for using website monitoring solutions, followed by improving page load performance (52%).
Infrastructure Management | Middle East & Africa
Key Findings
Infrastructure provisioning #
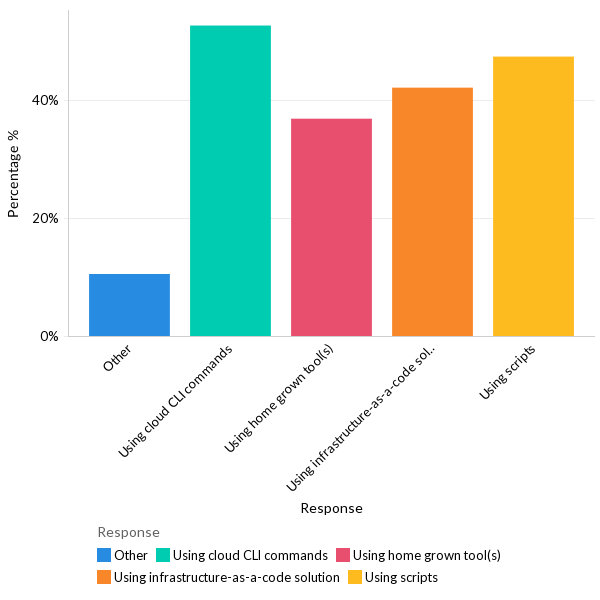
53% of respondents reported CLI commands as the preferred way of provisioning infrastructure, closely followed by scripts (47%) and infrastructure as code (IaC) tools (42%).
Container orchestration services #
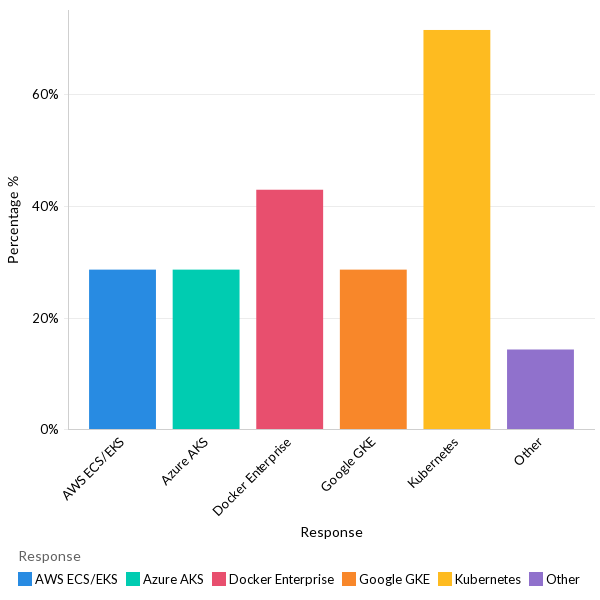
71% of respondents reported Kubernetes as the container service used in production.
Container technology adoption #
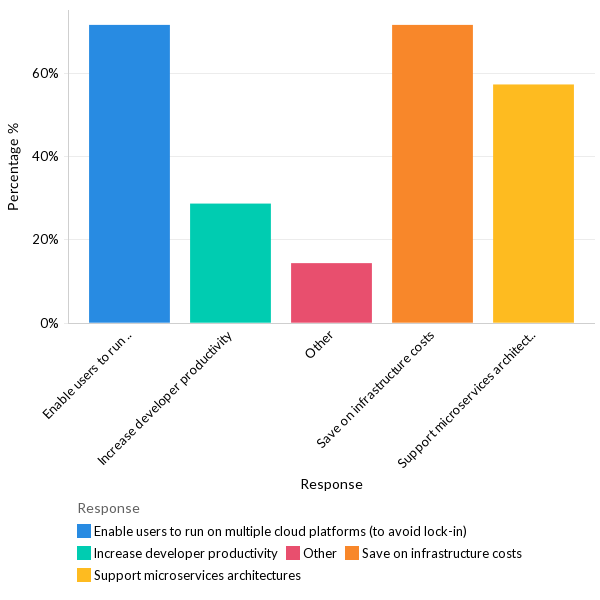
The ability to run on multiple cloud platforms and infrastructure cost savings are both (71%) the primary reasons for adopting container technology.
Containerization challenges #
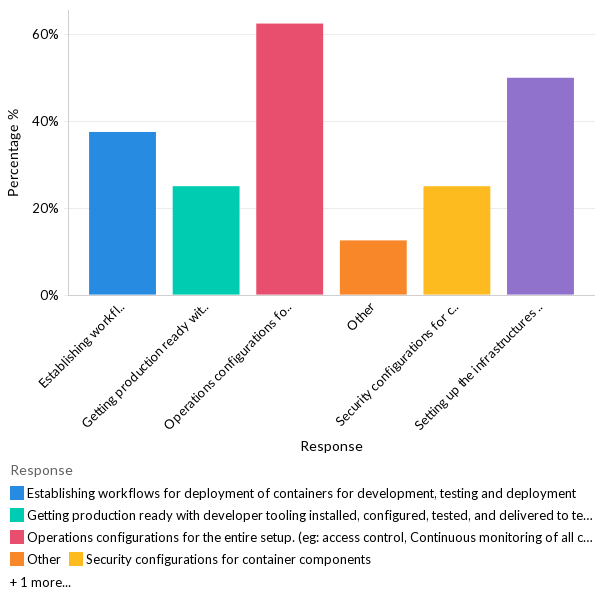
63% of respondents reported setting up operational configurations as the primary challenge for container management.
Patch Management #
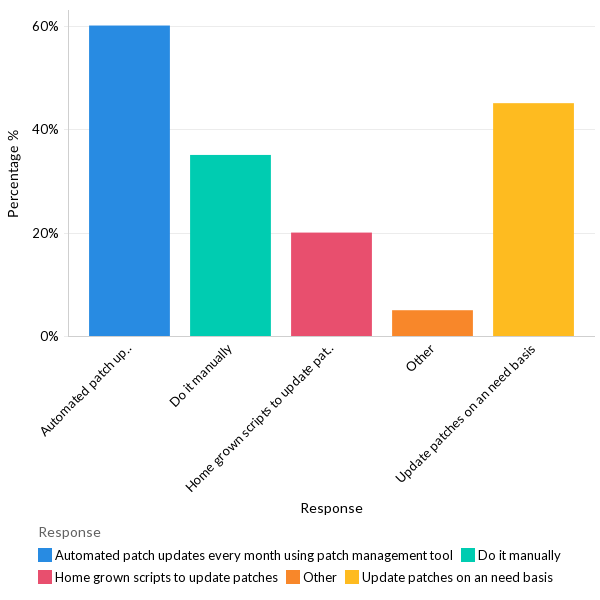
60% of respondents reported that they follow a monthly patching practice using an automated patch management tool.
Data backup techniques #
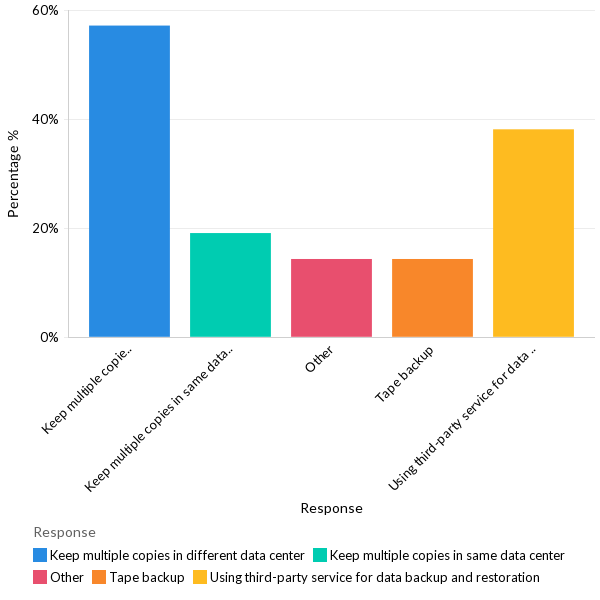
57% of respondents reported storing copies of data on multiple data centers. 38% said they use a third-party solution for scheduling and automating backups.
Application Management | Middle East & Africa
Key Findings
Version control software #
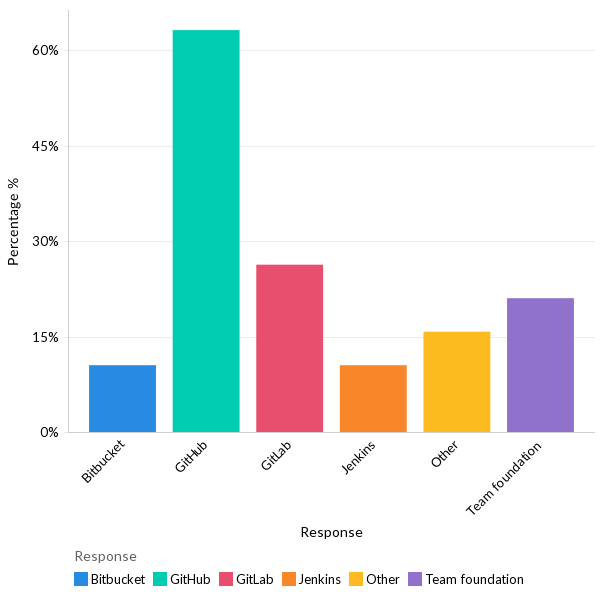
63% of respondents use GitHub as version control, with more than 26% using GitLab.
performance issues in production #
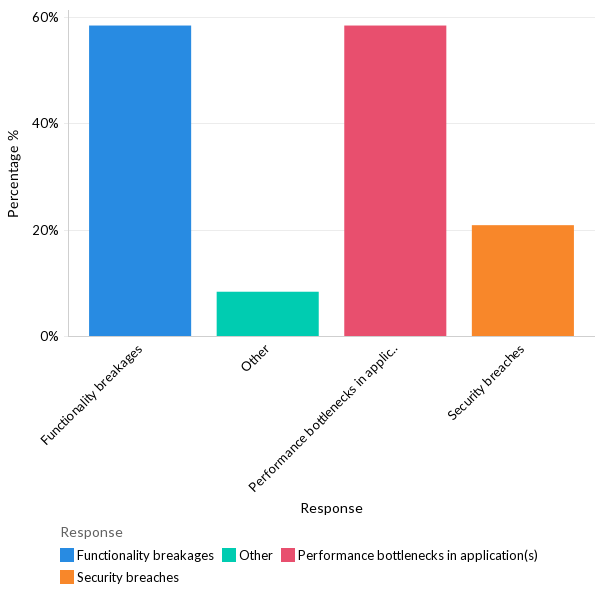
78% of respondents reported performance bottleneck as the major issue faced in production applications, followed by functionality breakages (56%).
Ensuring app performance #
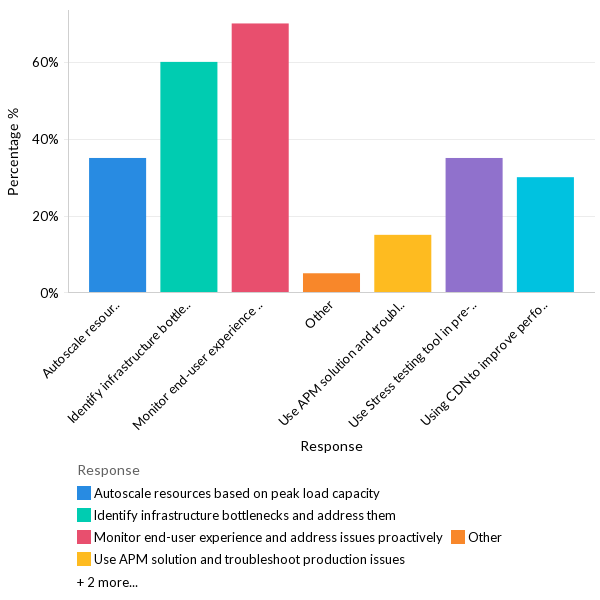
70% of respondents reported monitoring end-user experiences as the top method to ensure consistent application performance, followed by identifying infrastructure bottlenecks (60%).
Managing breaking changes #
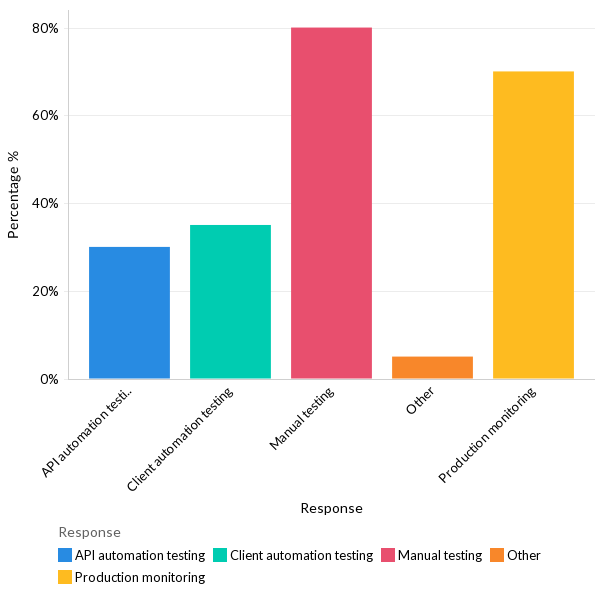
80% of respondents reported manual testing as the best method to manage breaking changes, followed by production monitoring (70%).
IT Ops Management | Middle East & Africa
Key Findings
Data center challenges #
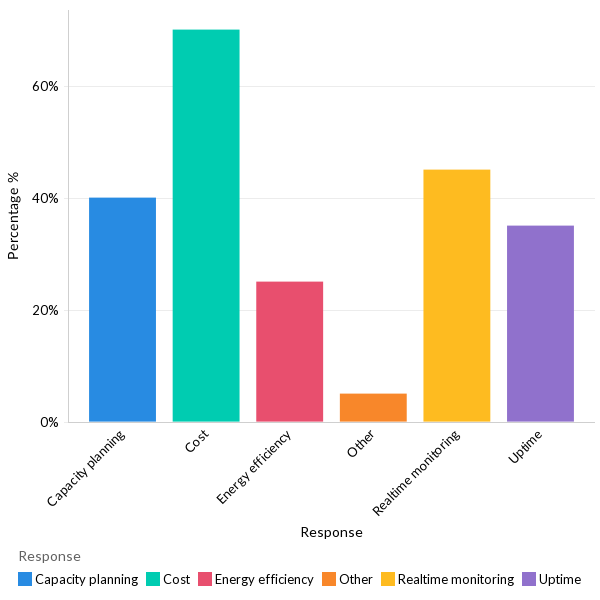
70% of respondents reported reducing operating costs as the top challenge faced in data center management, followed by real-time monitoring (45%) and capacity planning (40%).
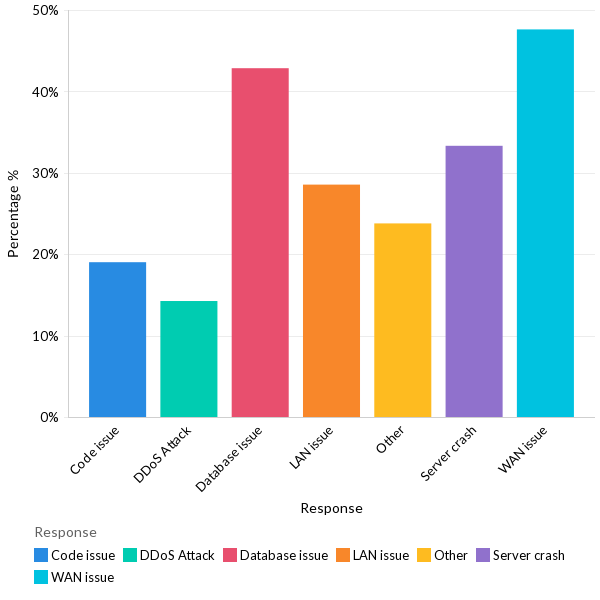
Data center outages #
48% of respondents reported WAN issues as the top reason for data center outage, followed by database issues (43%) and server crashes (33%).
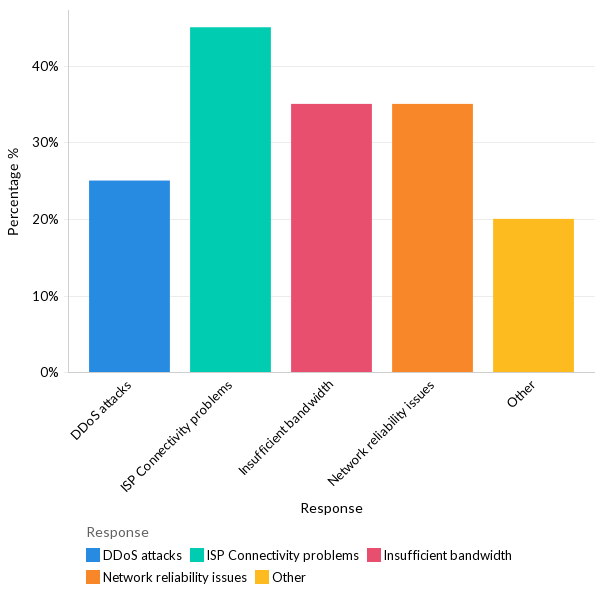
Common WAN issues #
45% of respondents reported ISP connectivity as the top WAN issue faced, followed by insufficient bandwidth and network reliability issues (35%)
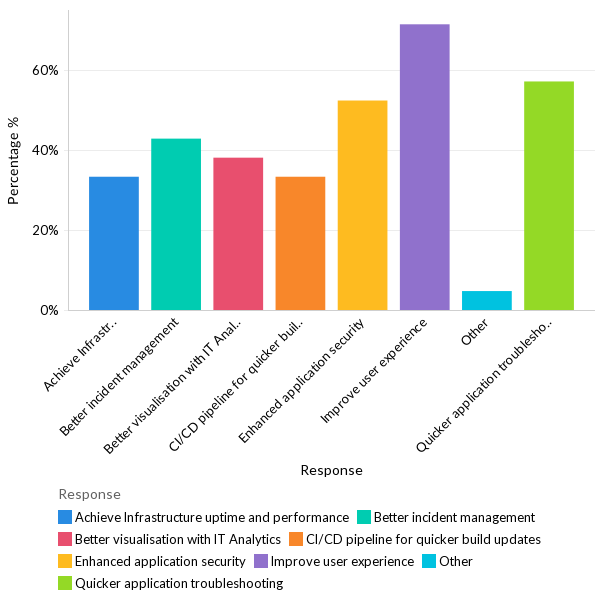
Improvement areas #
71% of the respondents reported digital user experience as an area of improvement, followed by application troubleshooting (57%) and application security (52%).
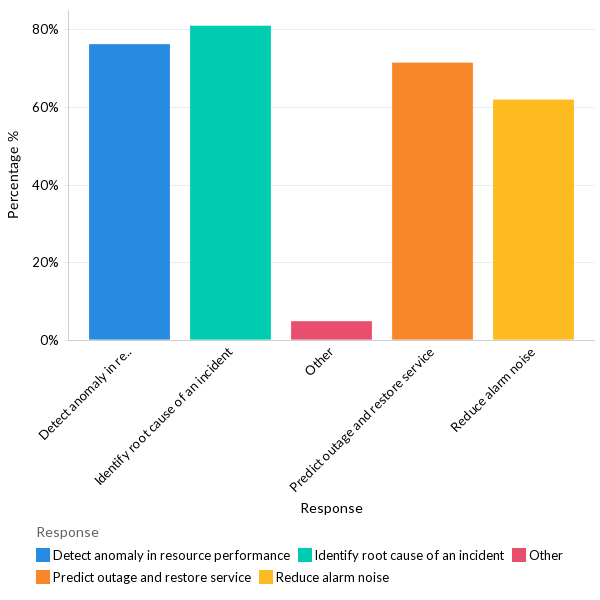
Impact of AIOps #
81% of the respondents reported identifying the root cause of an incident as the main benefit of AIOps, followed by detecting anomalies (76%) and predicting outages (71%).
Monitoring expectations #
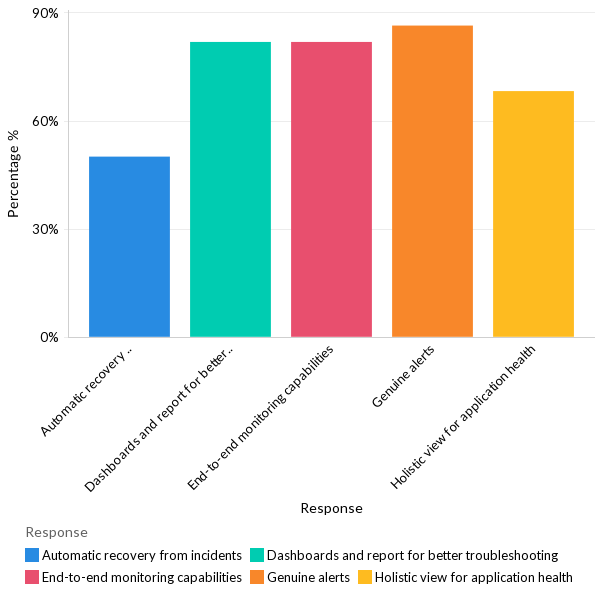
86% of the respondents reported genuine alerts as the chief expectation of a monitoring tool, closely followed by dashboards and reports for troubleshooting and end-to-end monitoring capabilities (82%).
Average no of monitoring tools #
38% of respondents reported they use two monitoring tools.
