Website Management | Europe
Key Findings
Average number of domains #
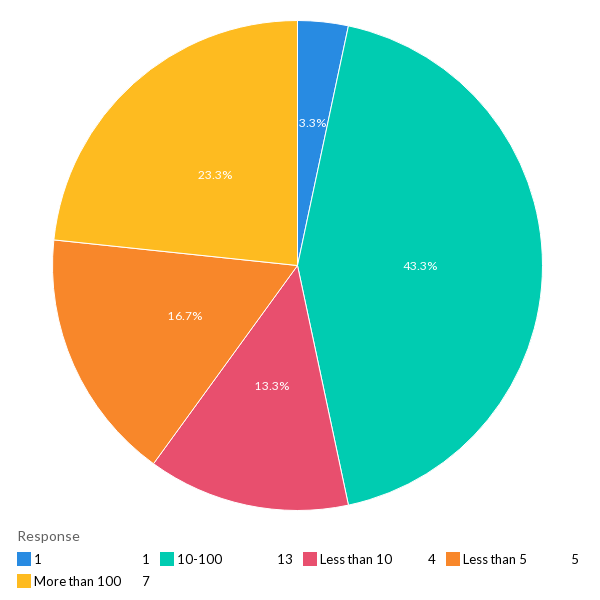
43% of respondents reported that they manage anywhere between 10-100 domains.
DNS Services #
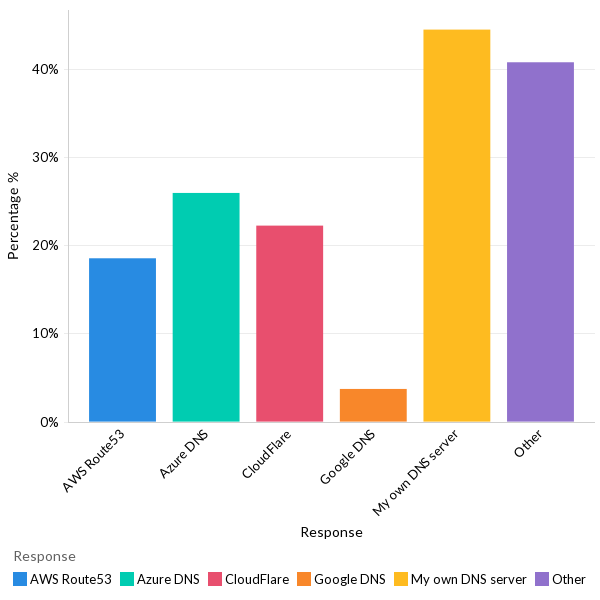
44% of the respondents reported that they run their DNS servers.
Website hosting issues #
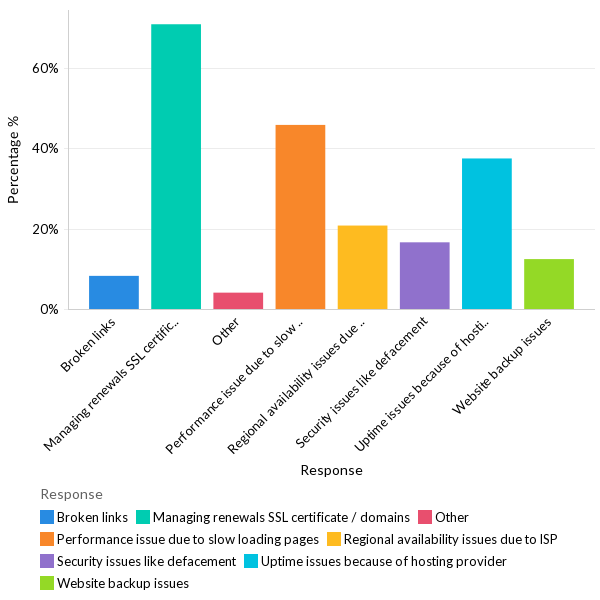
71% of respondents reported renewing SSL certificates/domains as the primary issue faced during website hosting.
Importance of website monitoring #
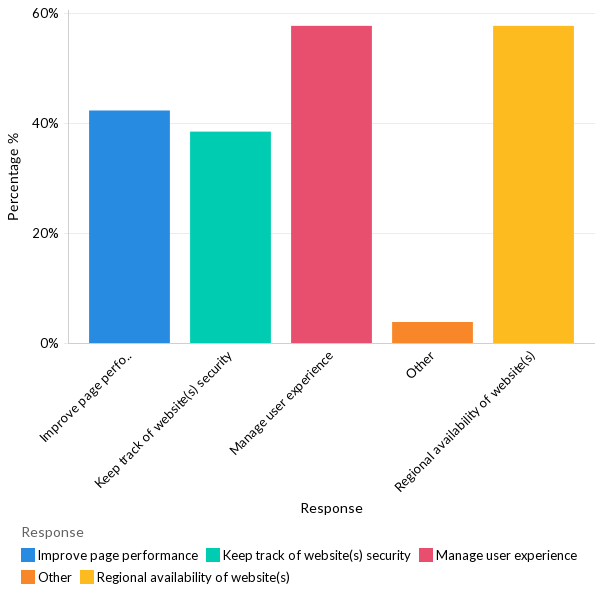
Managing user experience and ensuring regional availability are both (58%) the primary reasons for using website monitoring solutions.
Infrastructure Management | Europe
Key Findings
Infrastructure provisioning #
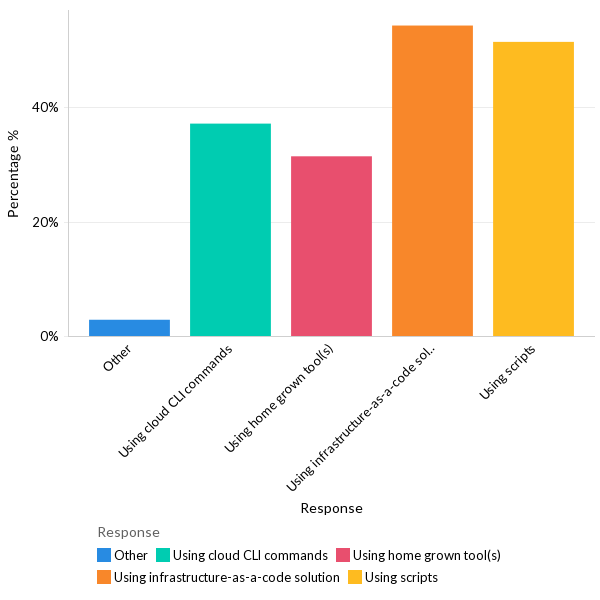
54% of respondents reported infrastructure as code (IaC) as the preferred way of provisioning infrastructure, closely followed by scripts (51%).
Container orchestration services #
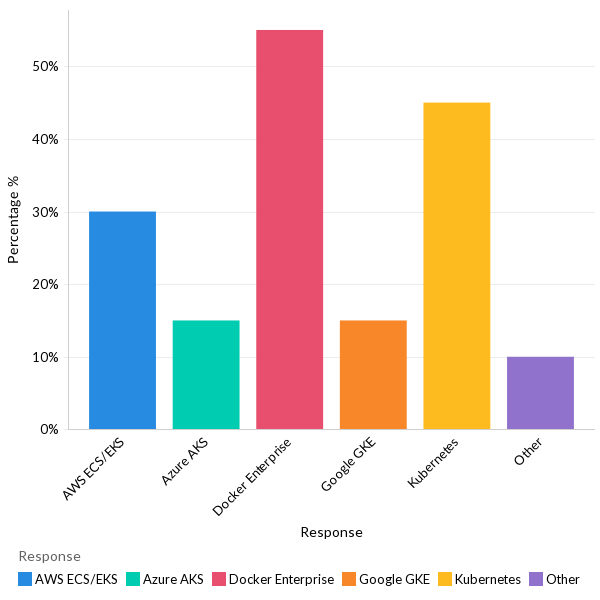
Docker Enterprise (55%) is the top-used container service in production, followed by Kubernetes (45%).
Container technology adoption #
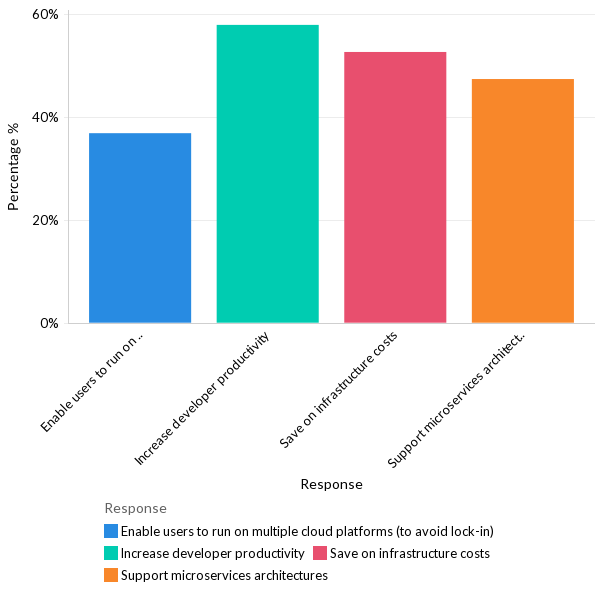
58% of respondents reported developer productivity improvement as the primary reason for adopting container technology, followed by infrastructure cost savings (53%).
Containerization challenges #
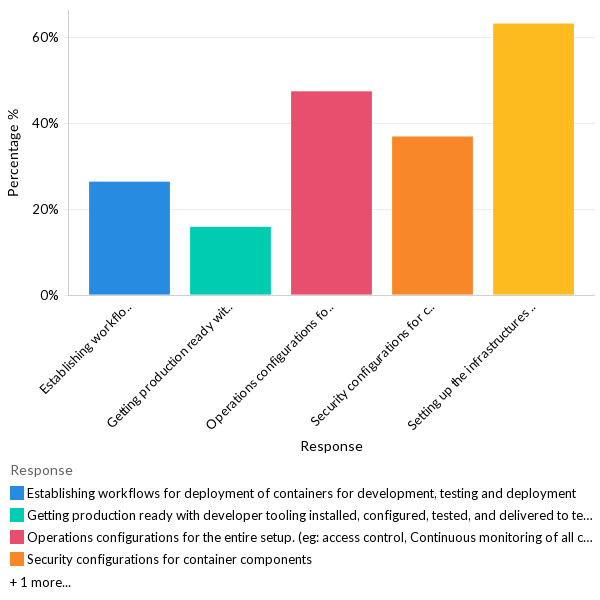
63% of respondents reported infrastructure set up as the primary challenge for container delivery pipelines.
Patch Management #
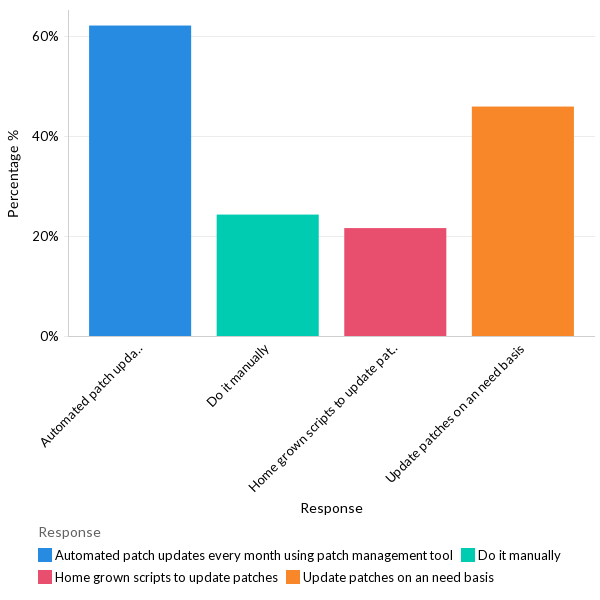
62% of respondents reported that they apply updates to the software every month using an automated patch management tool.
Data backup techniques #
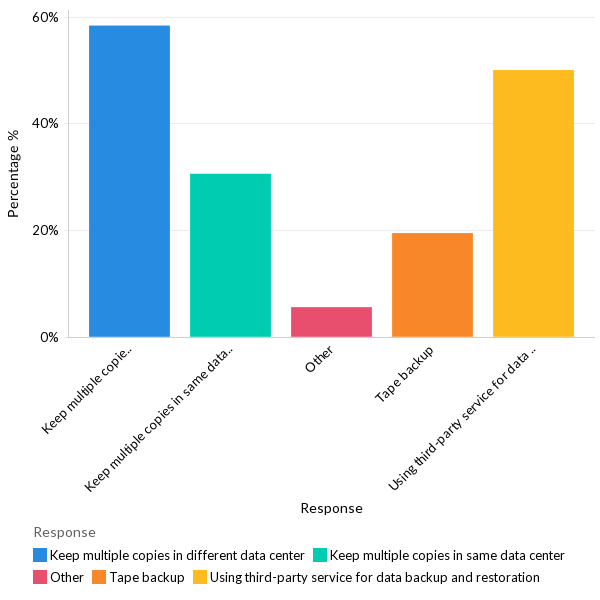
58% of respondents reported storing copies of data on multiple data centers. 50% said they use a third-party solution for scheduling and automating backups.
Application Management | Europe
Key Findings
Version control software #
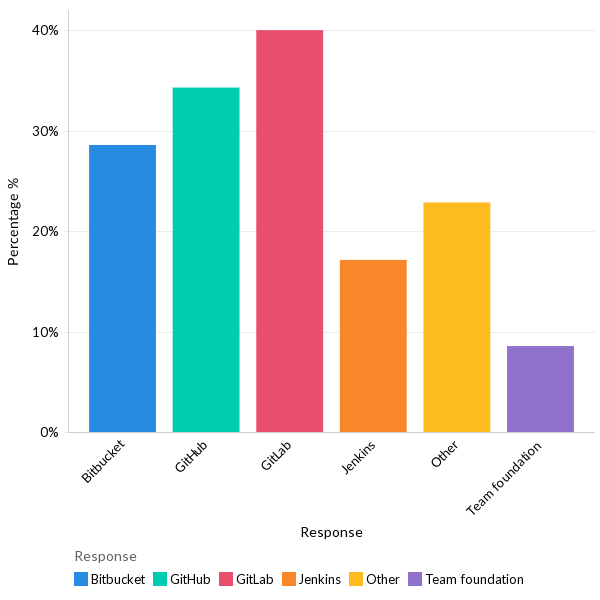
40% of respondents use GitLab as version control, with more than 34% using GitHub.
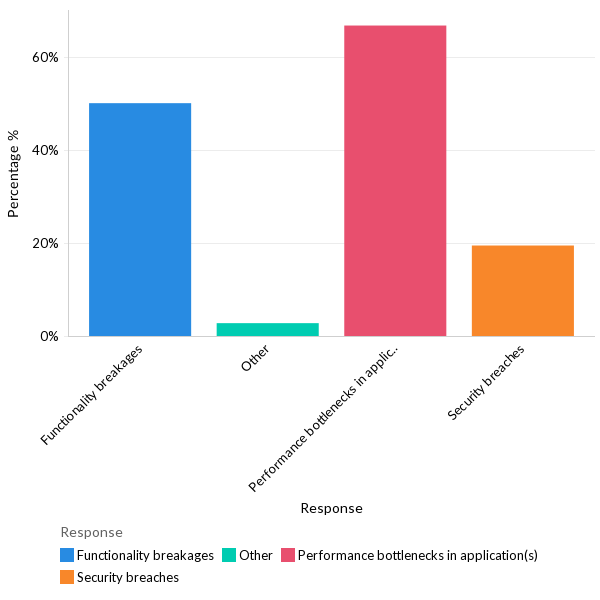
performance issues in production #
67% of respondents reported performance bottleneck as the major issue faced in production applications, followed by functionality breakages (50%).
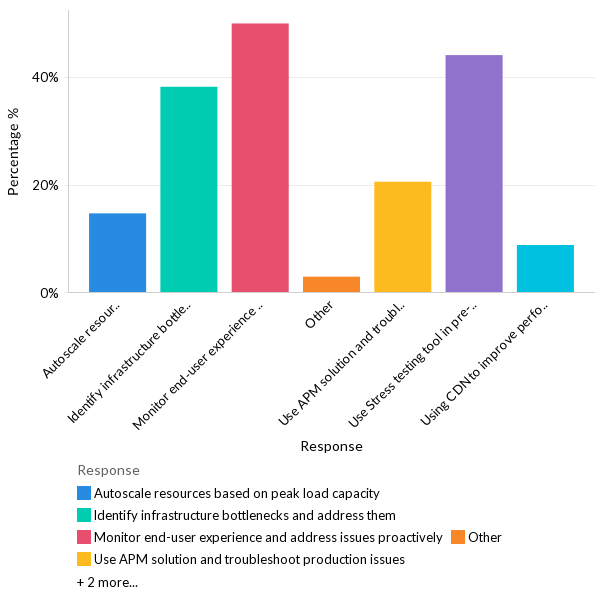
Ensuring app performance #
50% of respondents reported monitoring end-user experiences as the top method to ensure consistent application performance, followed by load testing tools (44%), identifying infrastructure bottlenecks (38%).
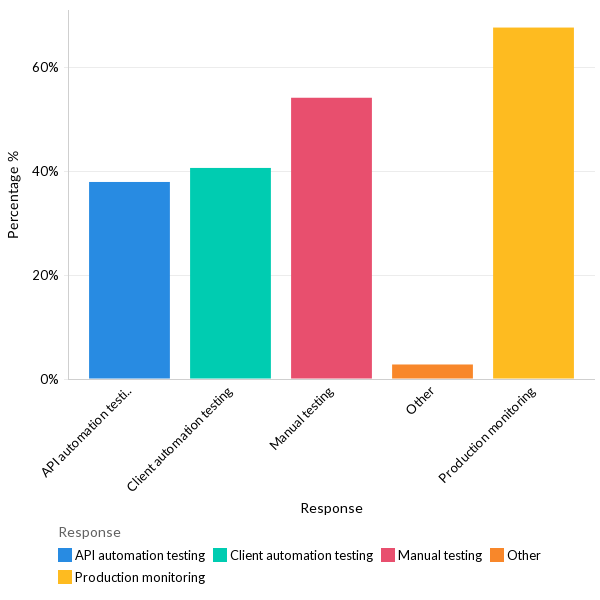
Managing breaking changes #
68% of respondents reported production monitoring as the best method to manage breaking changes, followed by manual testing (54%).
IT Ops Management | Europe
Key Findings
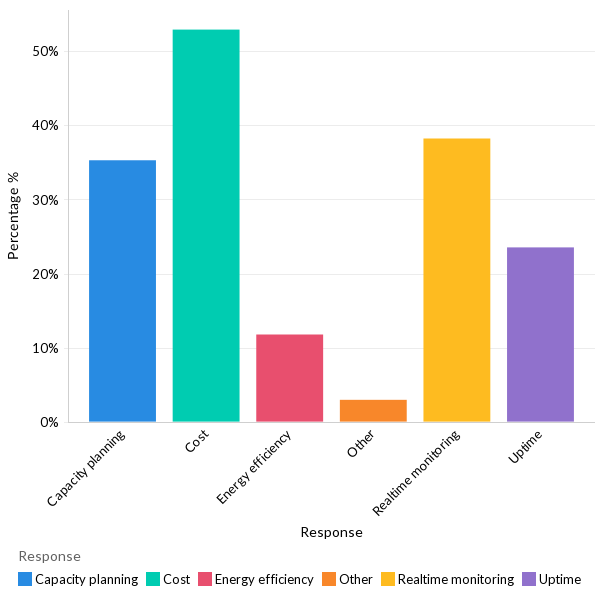
Data center challenges #
53% of respondents reported reducing operating costs as the top challenge faced in data center management, followed by real-time monitoring (38%) and capacity planning (35%).
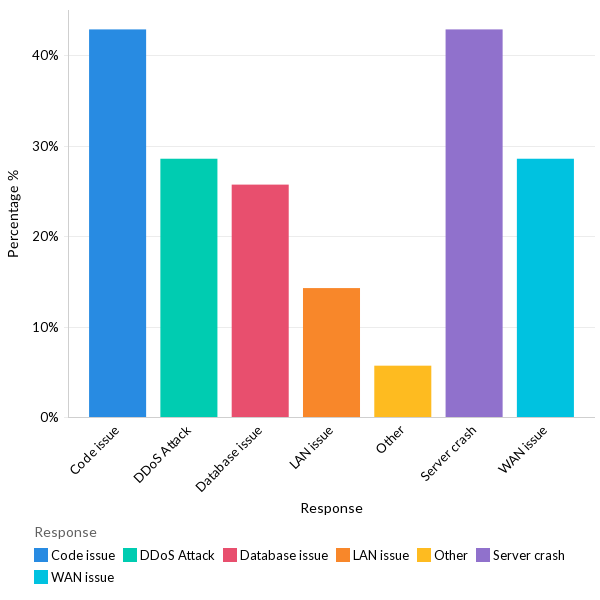
Data center outages #
Server crashes and code issues are both (43%) the top reason for data center outages.
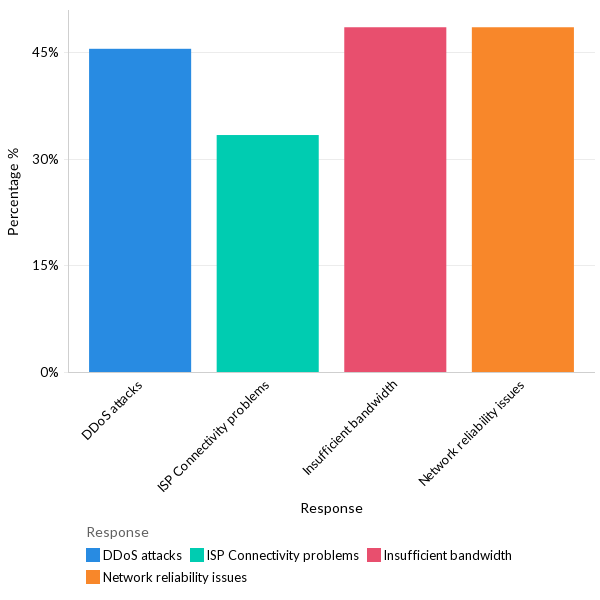
Common WAN issues #
Insufficient bandwidth and network connectivity problems are both (48%) the top WAN issues faced.
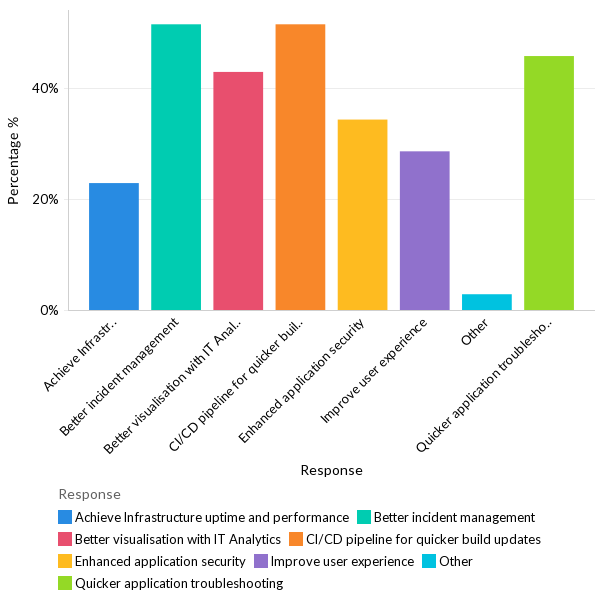
Improvement areas #
Incident management and CI/CD pipelines are both (51%) areas that require the most improvement.
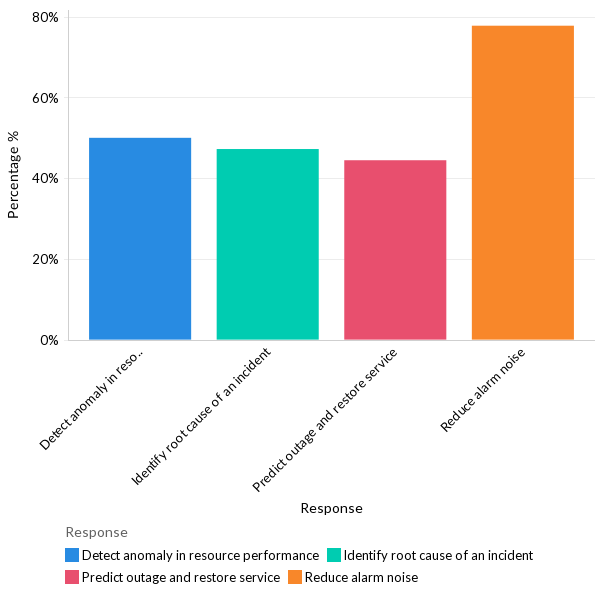
Impact of AIOps #
78% of the respondents reported that AIOps reduce alarm noise.
Monitoring expectations #
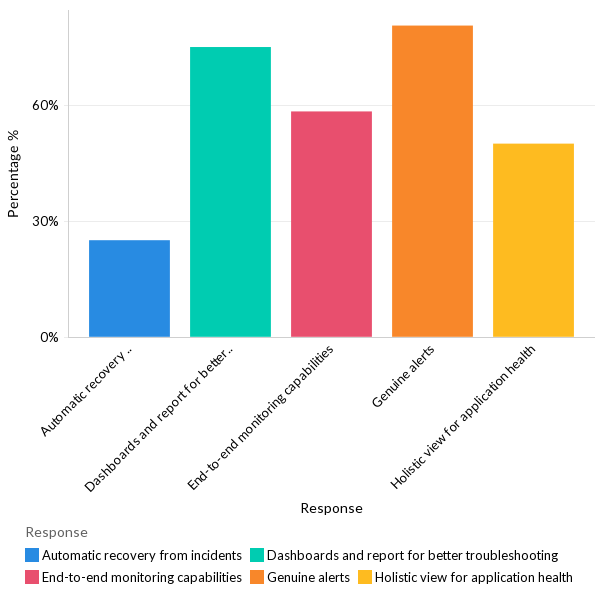
81% of the respondents reported genuine alerts as the chief expectation of a monitoring tool, closely followed by dashboards and reports for troubleshooting (75%).
Average no of monitoring tools #
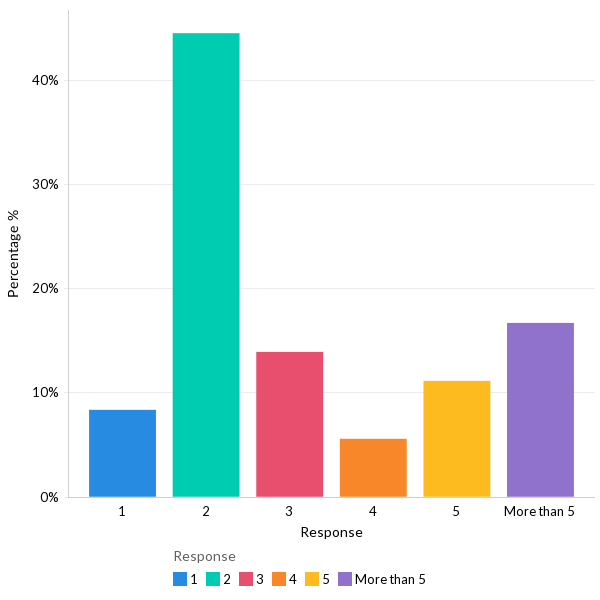
44% of respondents reported they use two monitoring tools.
