IIS Access Logs
Site24x7 AppLogs enhances IIS access logs monitoring experience by enabling search queries over IIS access log data. For your convenience the log information has been pre-refined into related fields such as date & time, serverIP, method, stemURI, server port, query URI, user name, client IP, user agent, referrer, status code, sub status code, Windows status code, and time taken. Learn more about log management with Site24x7.
Getting started
- Log in to your Site24x7 account.
- Download and install the Site24x7 Server Monitoring agent (Windows).
- Go to Admin > AppLogs > Log Profile and Add Log Profile.
Logs file path
Each application writes logs in different folders and files. By default, IIS access logs will be sourced from the below mentioned folder path for the respective Operating System. If have logs in a different folder, you can mention it under the File Path to source them from that particular folder while creating a log profile.

Log file path given here is for reference ONLY. By default Site24x7 runs a script to find the specific file path.
Log pattern
$DateTime:date$ $ServerIP$ $Method$ $StemURI$ $QueryURI$ $ServerPort$ $UserName$ $ClientIP$ $UserAgent$ $Referer$ $StatusCode:number$ $SubStatusCode:number$ $WindowsStatusCode:number$ $TimeTaken:number$
This is the default pattern defined by Site24x7 for parsing IIS access logs based on the sample mentioned below.
Sample log
2017-06-07 04:35:28 ::1 GET / - 9090 - ::1 Mozilla/5.0+(Windows+NT+6.3;+WOW64;+rv:44.0)+Gecko/20100101+Firefox/44.0 - 403 14 0 8780
The above sample log can be separated into 14 fields, each of which will take its respective value from here and will then be uploaded to Site24x7.
| Field name | Field value |
| Date Time | 2017-06-07 04:35:28 |
| ServerIP | ::1 |
| Method | GET |
| StemURI | / |
| QueryURI | - |
| Server Port | 9090 |
| User Name | - |
| Client IP | ::1 |
| User Agent | Mozilla/5.0+(Windows+NT+6.3;+WOW64;+rv:44.0)+Gecko/20100101+Firefox/44.0 |
| Referer | - |
| Status Code | 403 |
| Sub Status Code | 14 |
| Windows Status Code | 0 |
| Time Taken | 8780 |
- You can also monitor the availability and performance of IIS servers using Site24x7 IIS server monitoring.
- To filter the bot traffic from your access logs, you can configure filters on the User Agent field using the Filter Log Lines at Source option available on the log type page.
IIS access logs dashboard
Here is a how-to video to search your logs using the query language in AppLogs:
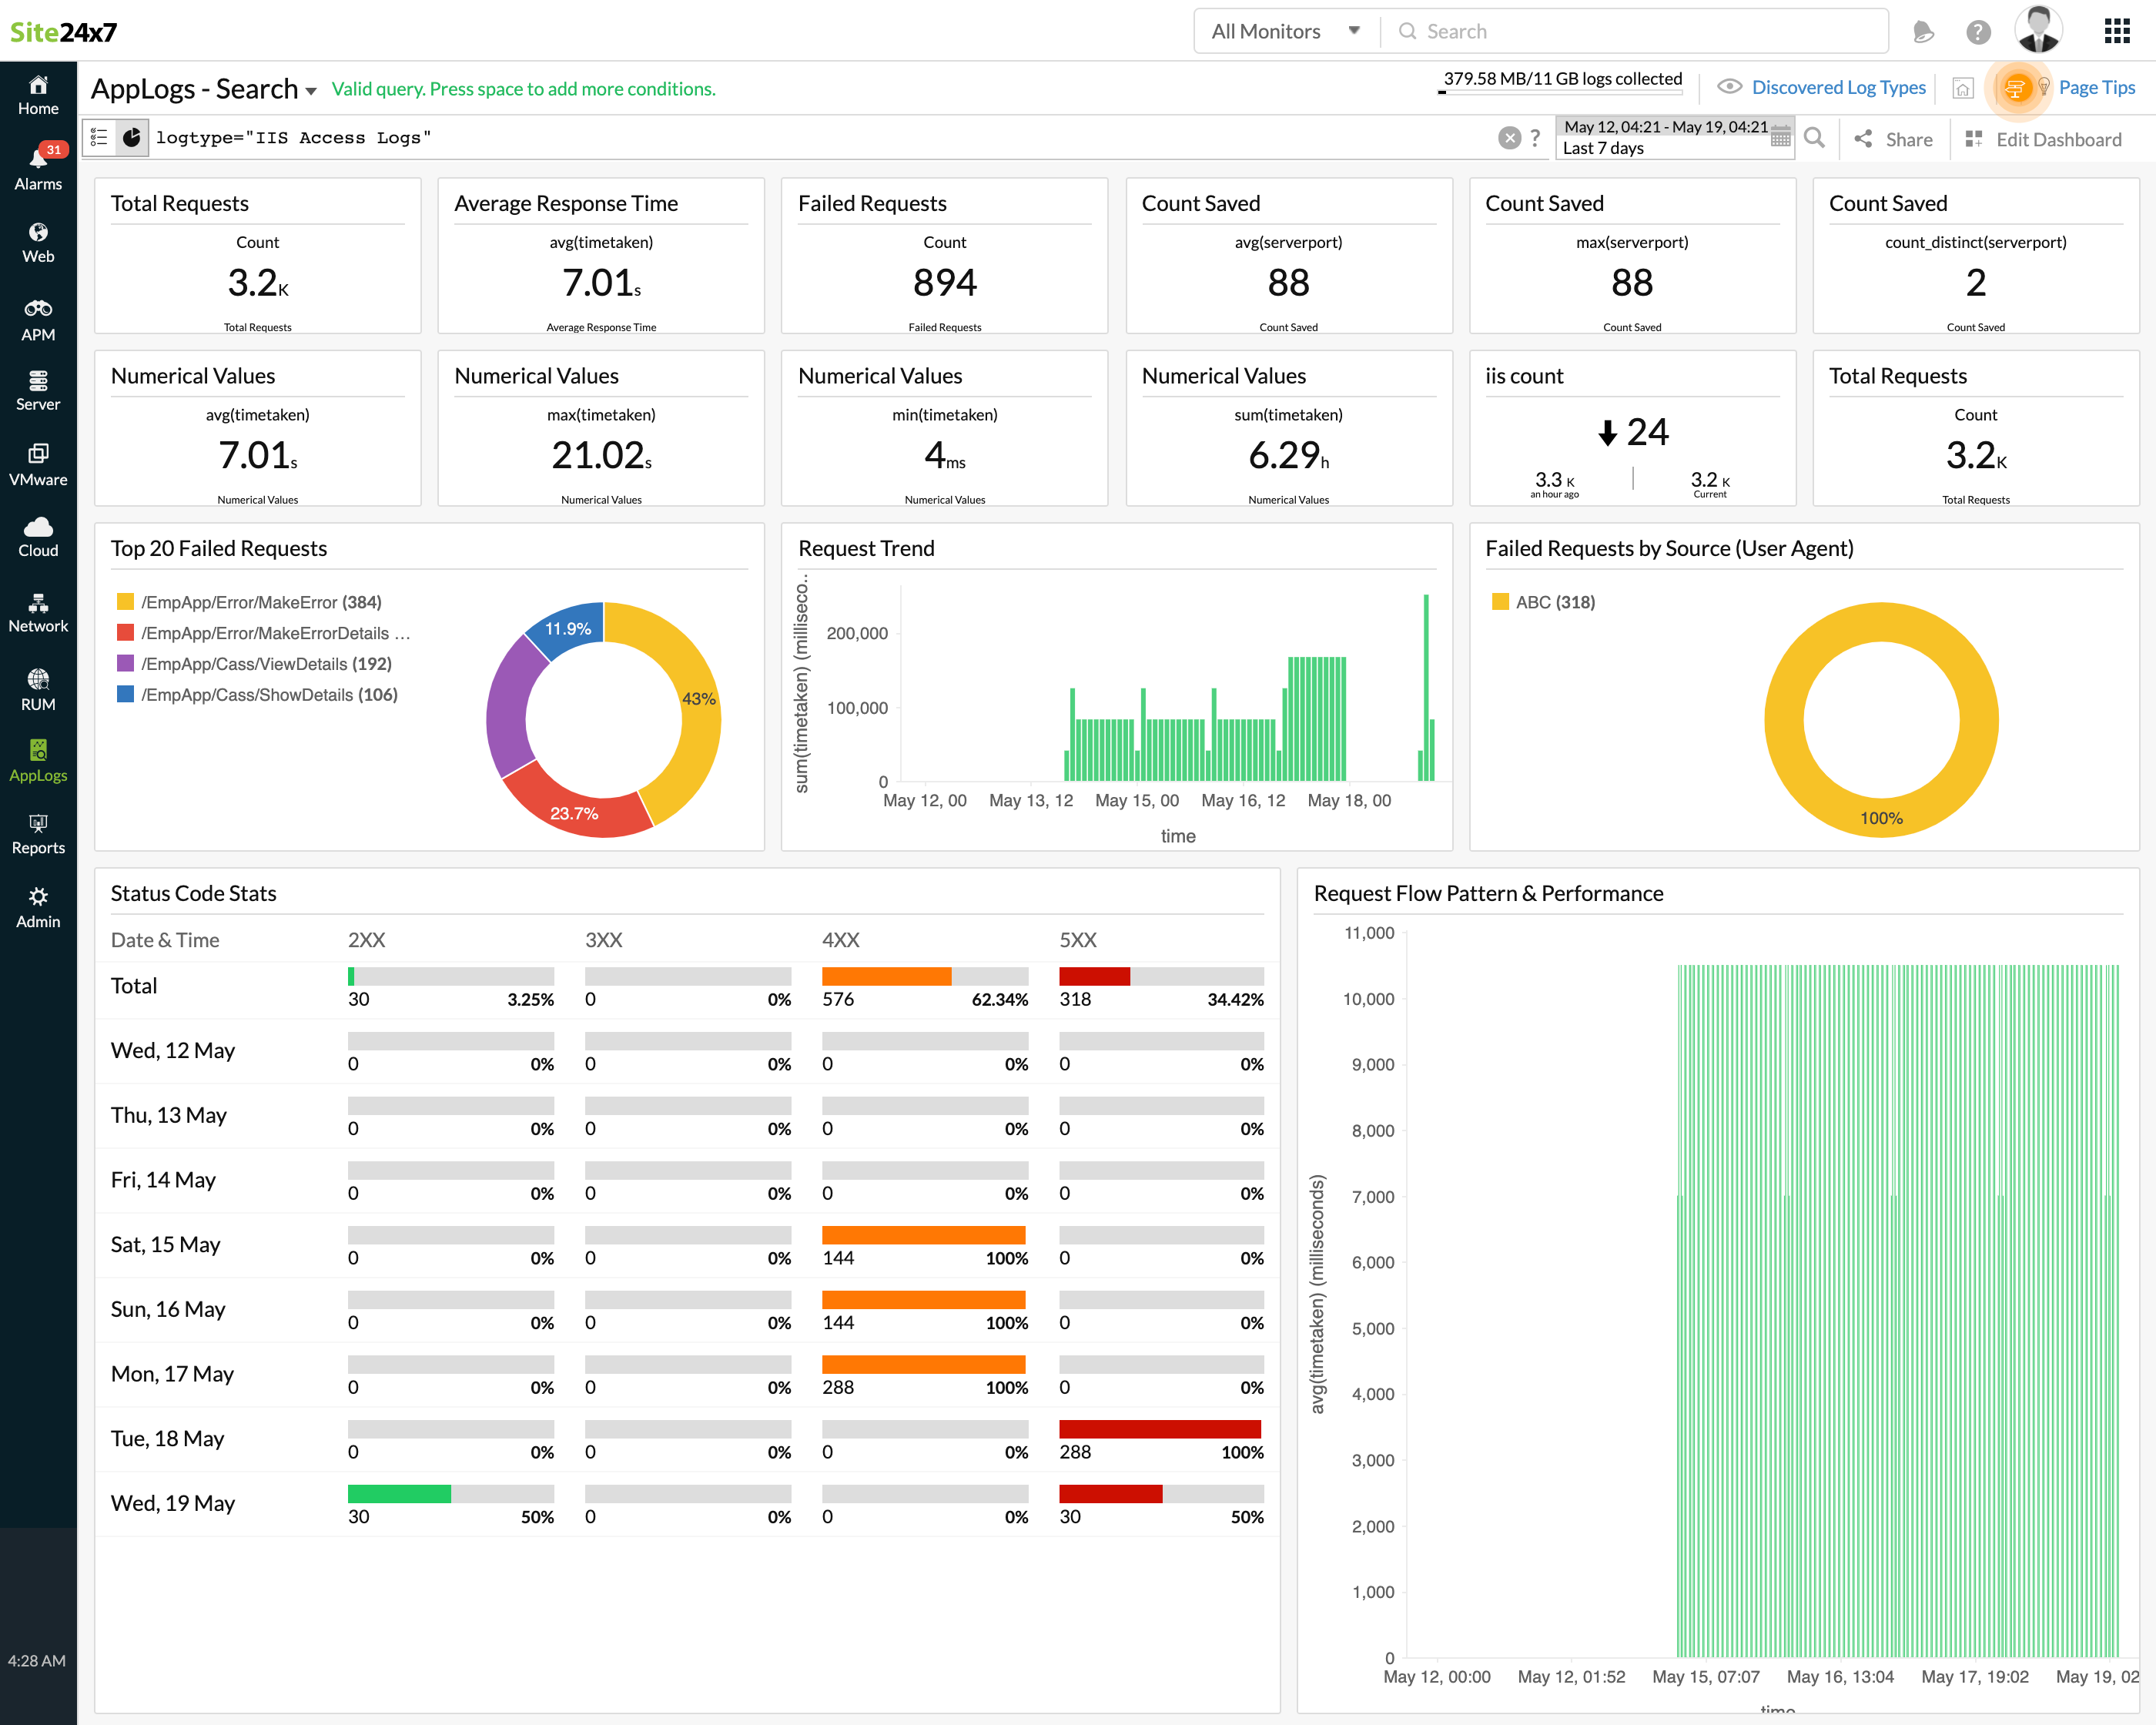
AppLogs creates an exclusive dashboard for every Log Type, and shows a few widgets by default. Here's a list of the widgets available in the IIS access logs dashboard:
- Total Requests
- Average Response Time
- Failed Requests
- Top 20 Failed Requests
- User Agent Stats
- Request Trend
- Status Code Stats
- Response Time Stats
- Top 50 Successful Requests
- Failed Requests by Source (User Agent)
- Top 20 Slowest Requests

In addition to the default widgets, your saved searches will also be added to the dashboard automatically.
Related log types
Further reading
Blog: Three ways to debug IIS web server failures using logs
Solution article: Optimize IIS web server and application performance with proven log monitoring strategies
