FTP Server
Analyze the availability and response time of your FTP Servers and receive instant notifications in the event of a downtime. You can check the connectivity to your FTP Servers. Now you can also monitor your dual stack infrastructure with Site24x7.
Add an FTP Server Monitor
- Click Admin > Inventory > Monitors > Add Monitor.
- Select FTP Server from Add Monitor page.
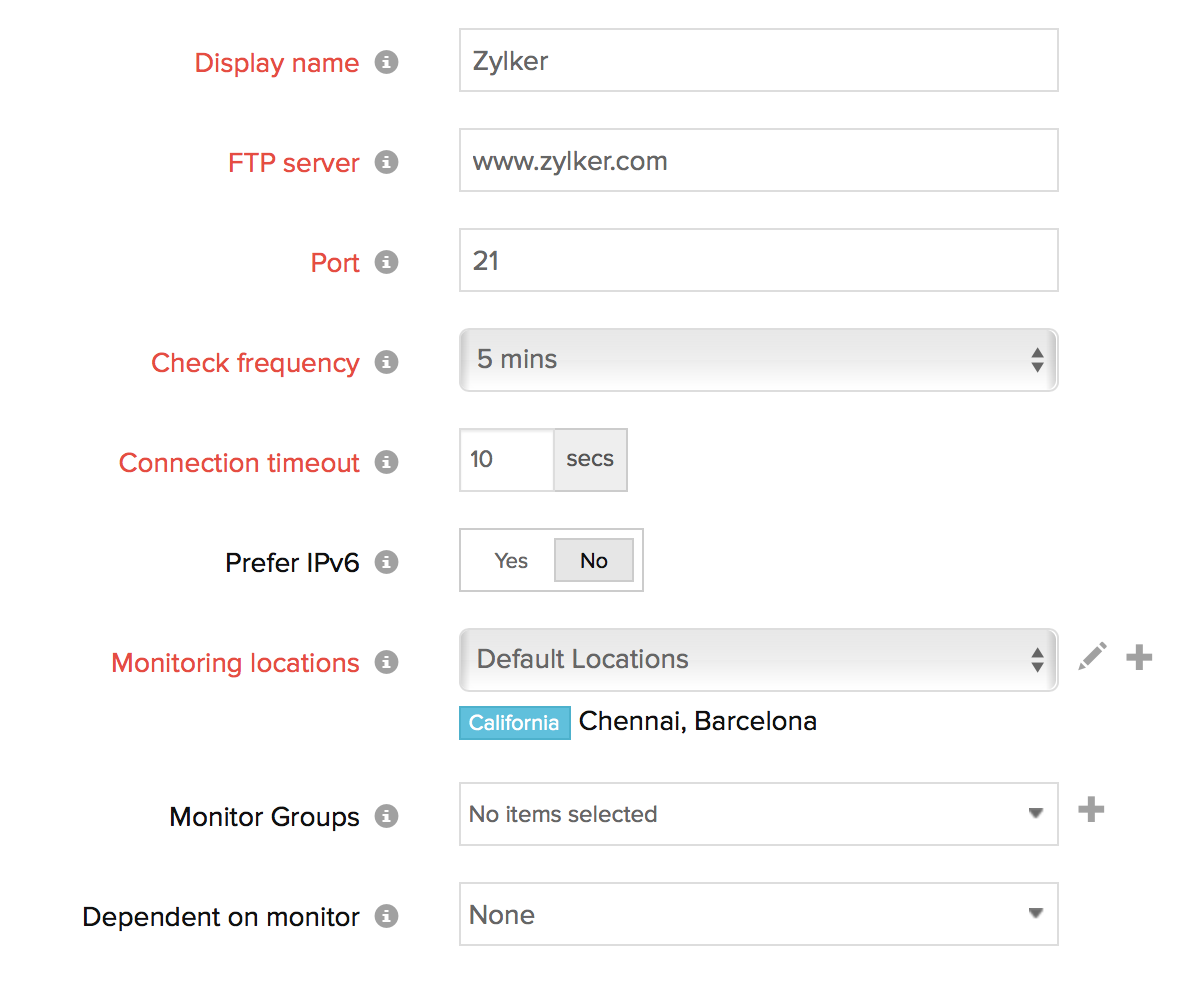
- Specify the following FTP server information to add the monitor:
- Display Name: Provide a display name to identify the FTP Server.
- FTP server: Specify the IP address or domain name of the FTP Server to connect to.
- Port: Provide the port number through which the server can be accessed.
- Check Frequency: Choose the required poll frequency. The frequency can be set from 10 seconds to one day. The frequencies of 10, 15, and 30 seconds can be configured if you're using Enterprise, Enterprise Web, Enterprise Plus Web, Elite, Elite Web Packs, Team 2024, Team, Team Web, and MSP. For all other users, one minute will be the minimum supported check frequency.
Note
- Configuring a 30-second check frequency will consume the license of two basic monitors.
- Configuring a 15-second poll frequency will consume the license of four basic monitors and can be configured only with the On-Premise Poller locations.
- Configuring a 10-second poll frequency will consume the license of six basic monitors and can be configured only with the On-Premise Poller locations.
- Connection Timeout: Specify the time in seconds needed to establish a connection with the target server. The value should be between 10 to 60 seconds. If the connection is not established within the specified time, a "Connection Error" message will be reported.
- Prefer IPv6: If you want to connect to your FTP Server over IPv6 enabled locations, simply move the rocker button to "YES" when creating or editing a monitor form.
Note
- Site24x7 lets you monitor your dual-stacked IPv4/IPv6 based infrastructure as per you need. IPv4 will be enabled as the default protocol. You'll be able to monitor your IPv6 infrastructure, once you enable the rocker button to IPv6. If the connectivity over IPv6 fails, it will not fall back to IPv4 automatically. Read more.
- Enabling IPv6 in the monitoring form doesn't make it compatible to monitor IPv4, by default. If you want to monitor a resource, which is compatible with both IPv4 and IPv6–you'll have to set up two separate monitor checks for this.
- Monitoring Locations: Set a location profile from the drop down list where the server can be accessed from the selected location. The monitors with 10-second and 15-second poll frequencies will be supported only with On-Premise Poller locations.
To know more, refer Location Profile.

- Monitor Groups: You can associate your monitor with multiple monitor groups by selecting the relevant monitor groups from the drop down list. This allows in logical grouping of your monitors.
To learn how to create a monitor group for your monitors, refer Monitor Groups. - Dependent on Monitor: Select a monitor from the drop-down list to choose it as your dependent resource. You can add up to 5 monitors as dependent resources. Alerts to your monitor will be suppressed based on the DOWN status of your dependent resource.
Note
- Configuring a dependent resource and suppressing alerts based on the dependent resource's status is part of providing you with better false alerts protection. Learn more about alert suppression at monitor level.
- If you select "None" in the dependent resource field, alerting will progress as per your normal configuration settings. No alerts will be suppressed in this case as the monitor doesn't have any dependent resource.
- Multiple monitor group support for monitors allow a monitor to be associated with multiple dependent resources in different monitor groups. If during a normal monitor status check, any one of these dependent resources' status is identified as DOWN, the alert for the monitor will be automatically suppressed. However, the dependency configuration at monitor level is always given the higher priority over any other monitor group level dependency configuration for suppressing alerts.
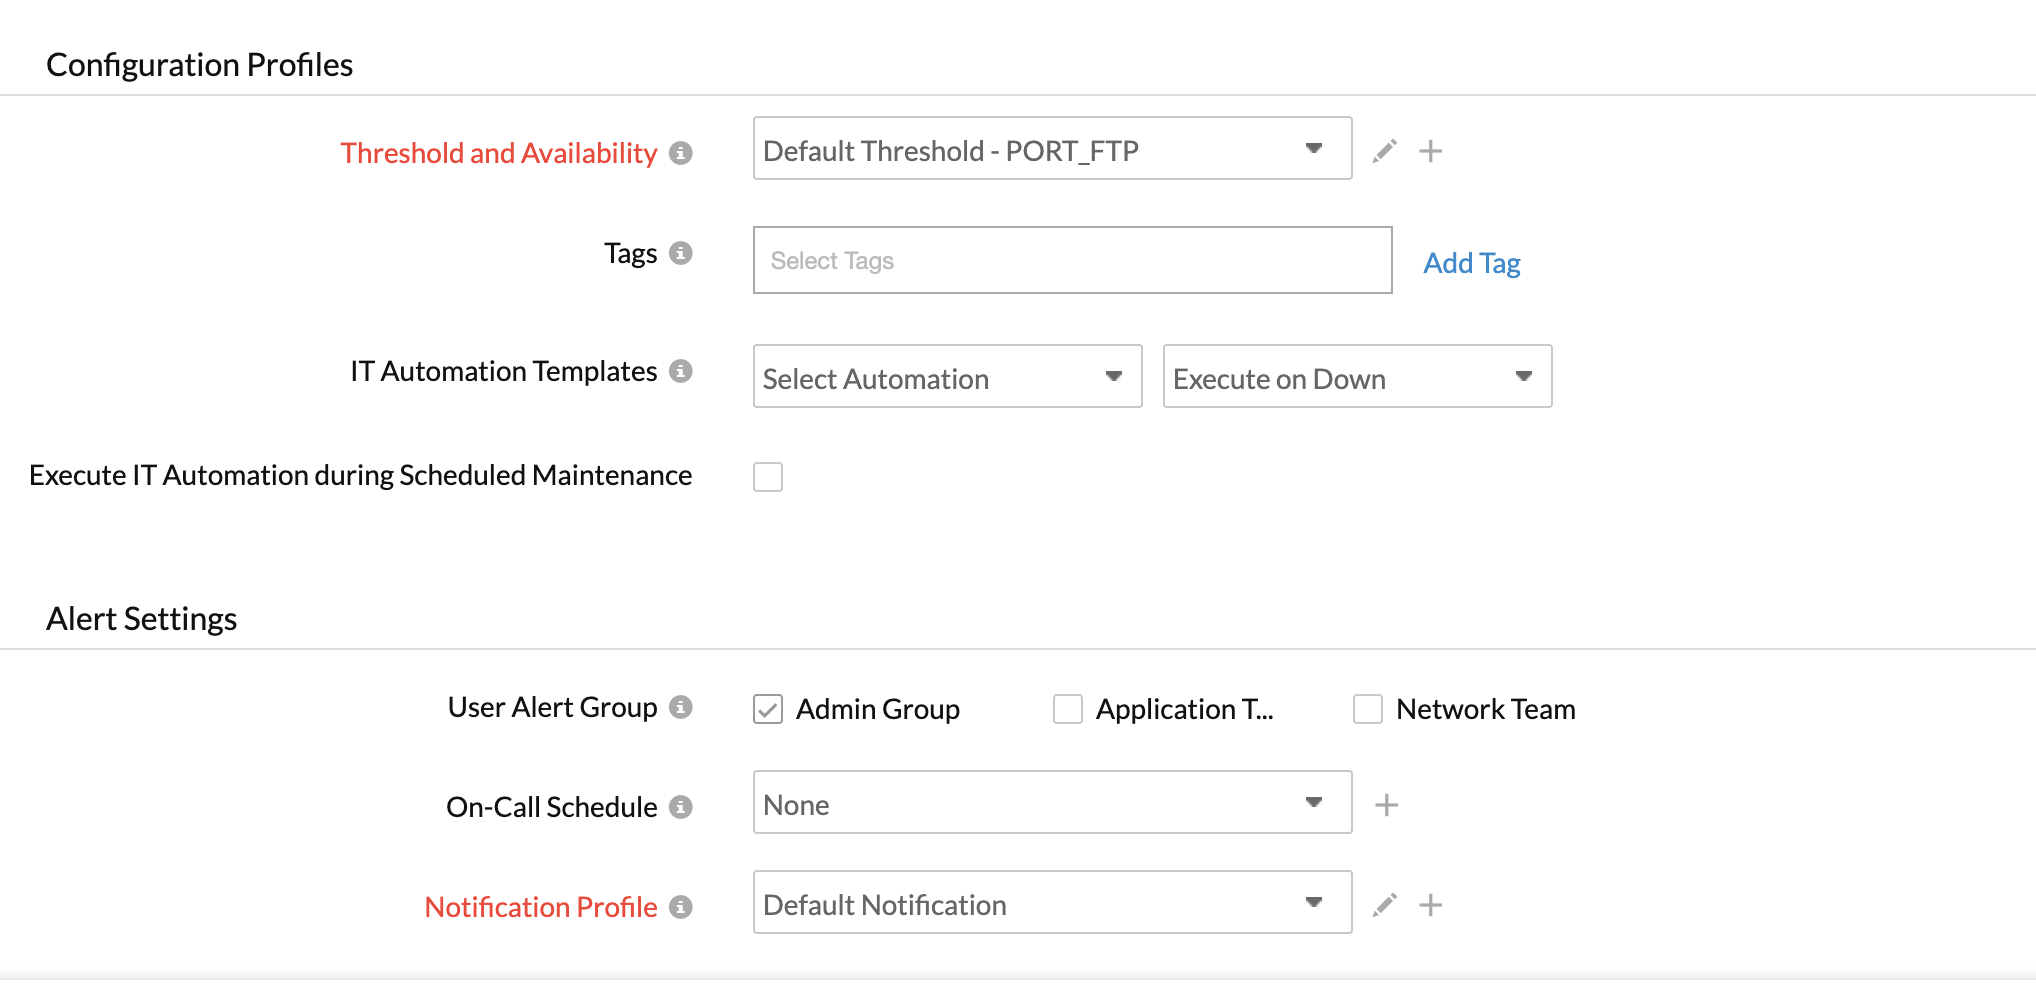
- Specify the following details for Configuration Profiles:
- Threshold and Availability: Select a threshold from the drop down list or choose the default threshold set available and receive notification when the resource cross the set threshold.
To create a customized threshold and availability profile, refer Threshold and Availability. - Tags: Associate your monitor with predefined Tag(s) to help organize and manage your monitors creatively. Learn how to add Tags.
- IT Automation: Select an automation to be executed when the website is down/trouble/up/any status change/any attribute change. The defined action gets executed when there is a state change and selected user groups are alerted.
To automate corrective actions on failure, refer IT Automation.

- Threshold and Availability: Select a threshold from the drop down list or choose the default threshold set available and receive notification when the resource cross the set threshold.
- Alert Settings:
- User Alert Group: Select the user group that need to be alerted during a outage. To add multiple users in a group, see User Groups.
- On-Call Schedule: TheOn-Call Schedule option helps you to ensure that the notifications are sent to assignees in specific shift hours helping them to quickly respond to alerts or incidents. Choose an On-Call of your preference from the drop-down.
- Notification Profiles: Choose a notification profile from the drop down or select the default profile available. Notification profile helps to configure when and who needs to be notified in case of downtime. Refer Notification Profile to create a customized notification profile.
NoteYou can receive alerts if the monitors are associated to user groups irrespective of the On-Call shift you've configured.
- Third-Party Integrations: Associate your monitor with a pre-configured third-party service. It lets you push your monitor alarms to selected services and facilitate improved incident management.
NoteIf you haven't setup any integrations yet, navigate across to ”Admin > Third Party Integration” to create one. Tell me more.
- Click Save.
Learn more about the various performance metrics of an FTP Server Monitor.
