Tomcat Access Logs
Site24x7 AppLogs provides easy management of Tomcat access logs by providing unique separation of log information into fields such as remote access, remote user, date & time, method, request-URI, protocol, status, and bytes sent. Site24x7 allows you to gather, and analyze log information quickly and efficiently. Learn more about log management with Site24x7.
Getting started
- Log in to your Site24x7 account.
- Download and install the Site24x7 Server Monitoring agent (Windows | Linux).
- Go to Admin > AppLogs > Log Profile and Add Log Profile.
Logs file path
Each application writes logs in different folders and files. By default, Tomcat access logs are sourced from the below mentioned folder path for the respective Operating System. If you have logs in a different folder, you can mention it under the File Path to source them from that particular folder while creating a log profile.


Log pattern
$RemoteAddress$ - $RemoteUser$ [$DateTime:date$] \"$Method$ $RequestURI$ $Protocol$\" $Status:number$ $BytesSent:number$
This is the default pattern defined by Site24x7 for parsing Tomcat access logs based on the sample mentioned below.
Sample log
127.0.0.1 - - [19/Jul/2017:23:35:30 +0530] \"GET /manager/status HTTP/1.1\" 401 2473
The above sample log can be separated into 8 fields, each of which will take its respective value from here and will then be uploaded to Site24x7.
| Field name | Field value |
| Remote Address | 127.0.0.1 |
| Remote User | - |
| Date Time | 19/Jul/2017:23:35:30 +0530] |
| Method | GET |
| RequestURI | manager |
| Protocol | status HTTP |
| Status | 1.1 |
| Bytes Sent | 401 2473 |
Tomcat access logs dashboard
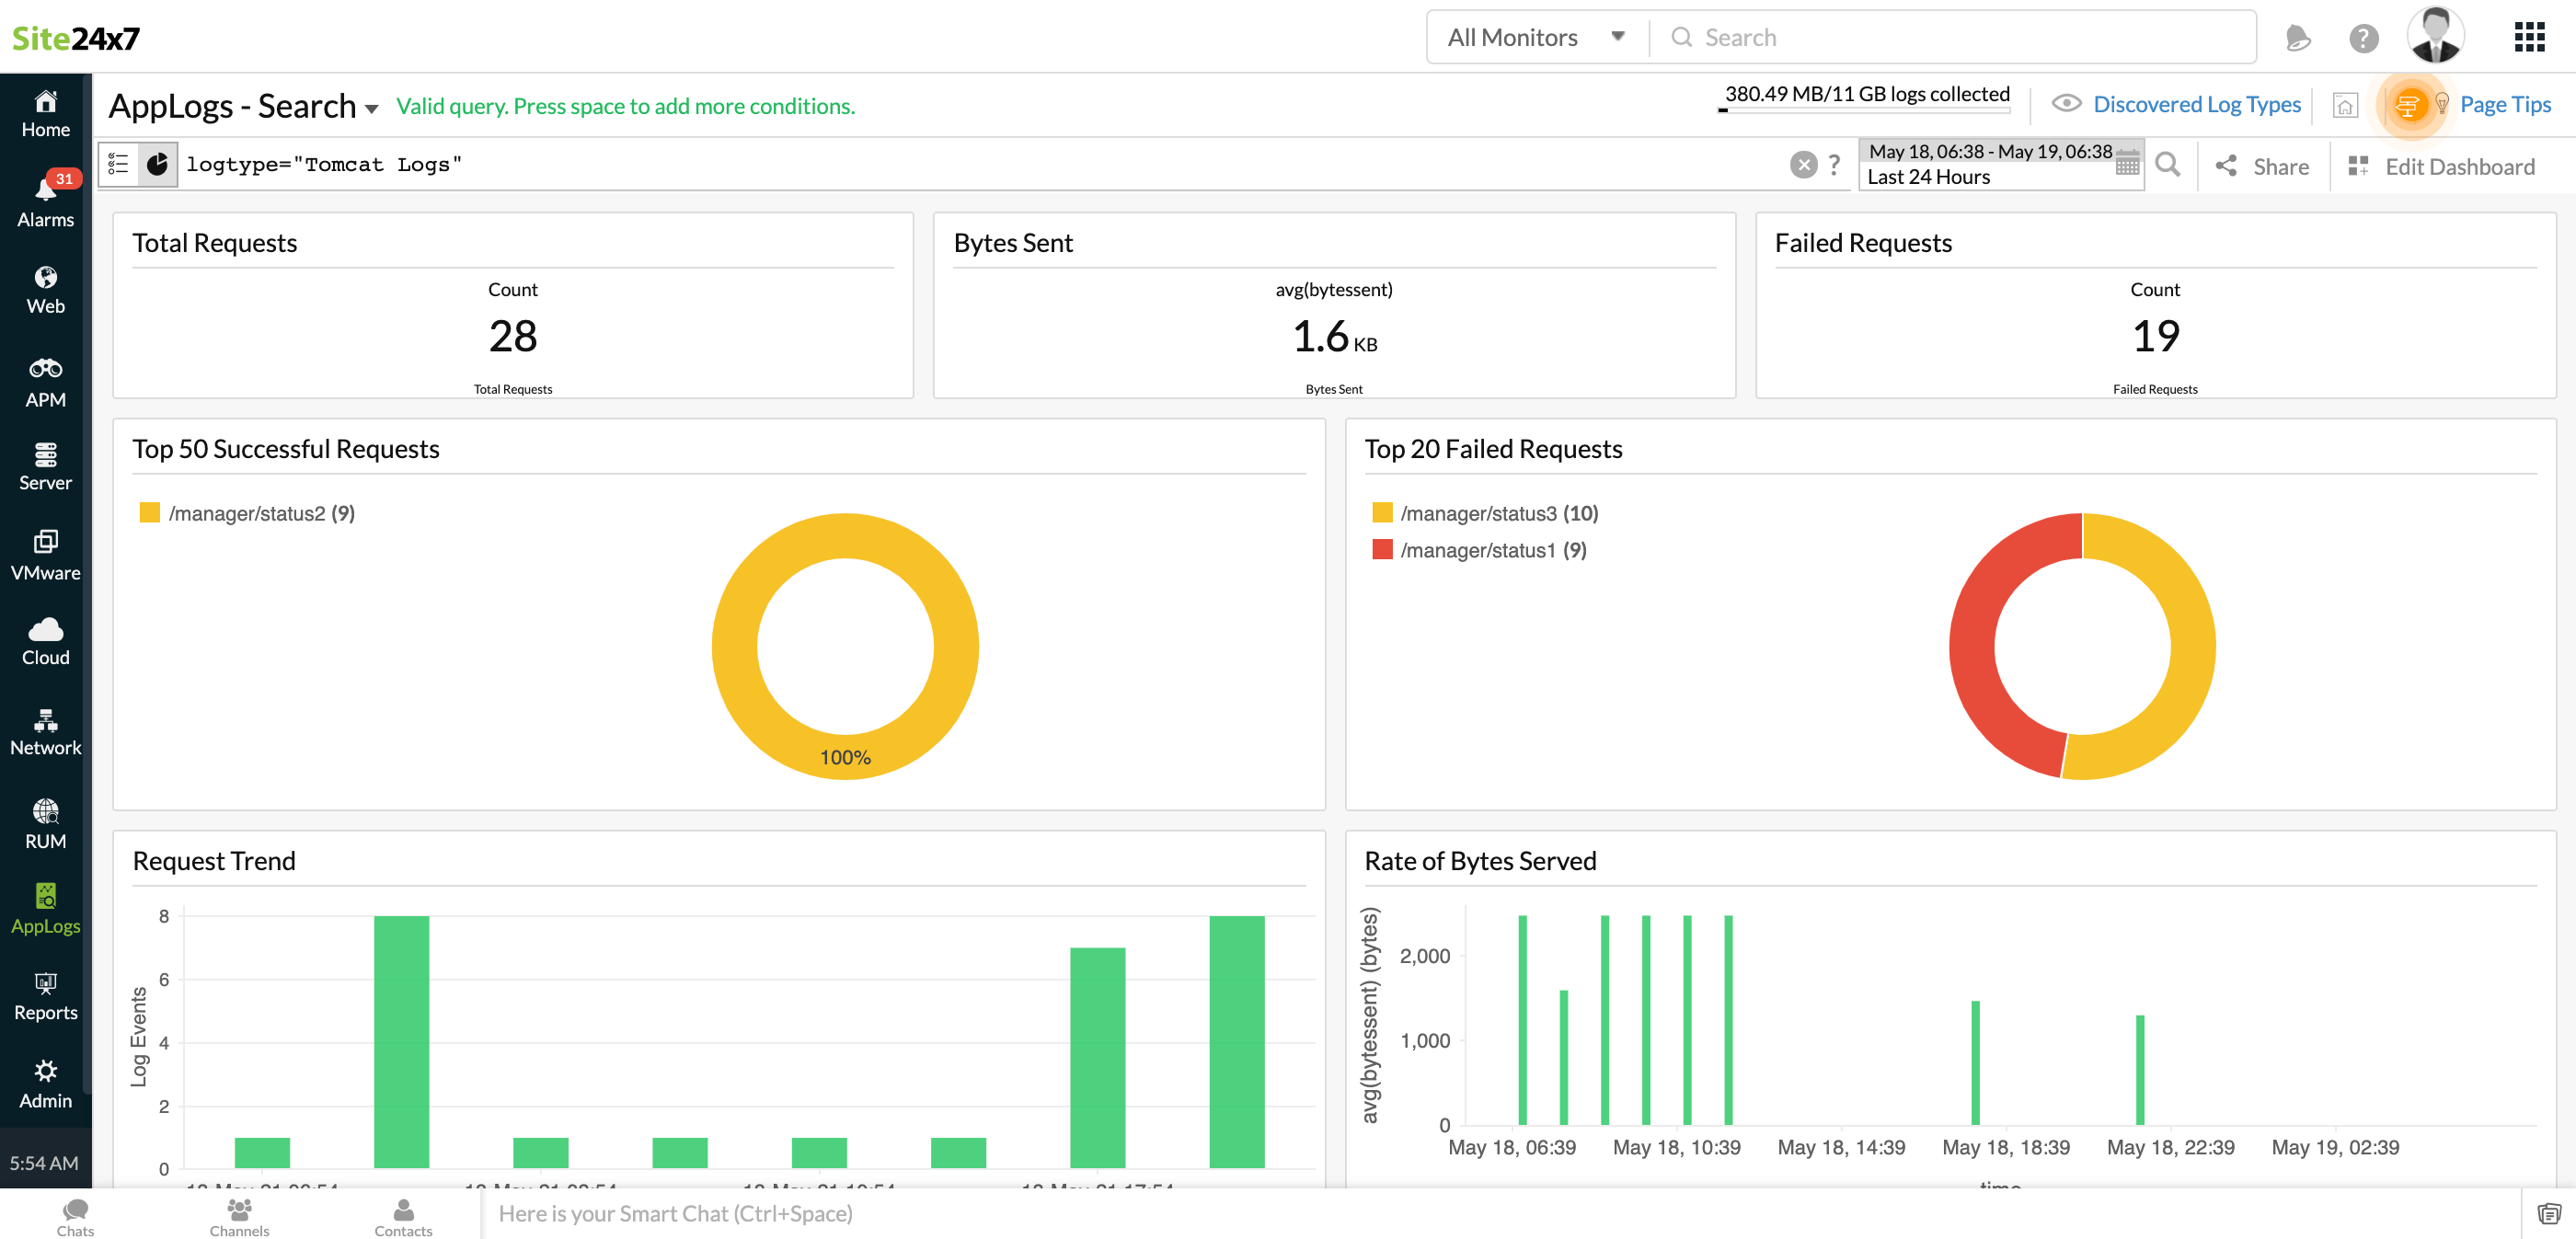
AppLogs creates an exclusive dashboard for every Log Type, and shows a few widgets by default. Here's a list of the widgets available in the Tomcat access logs dashboard:
- Total Requests
- Average Bytes Sent
- Failed Requests
- Top 50 Successful Requests
- Top 20 Failed Requests
- Request Trend
- Status Code Stats
- Rate of Bytes Served

In addition to the default widgets, your saved searches will also be added to the dashboard automatically.
