HAproxy Logs
HAproxy log monitoring may be a cumbersome process. But Site24x7 AppLogs has already identified and labeled the critical segments of HAProxy logs before presenting them into components such as PID, remote IP, front end, back end, server, bytes sent, front end cc, back end cc, requestURI, server queues, protocol, method, and more, making the log monitoring simple and easy. Learn more about log management with Site24x7.
Getting started
- Log in to your Site24x7 account.
- Download and install the Site24x7 Server Monitoring agent (Windows | Linux).
- Go to Admin > AppLogs > Log Profile and Add Log Profile.
Logs file path
Each application writes logs in different folders and files.By default, HAproxy logs are sourced from the below-mentioned folder path for the respective Operating System. If you have logs in a different folder, you can mention it under the File Path to source them from that particular folder while creating a log profile.


Log Pattern
$Date$ $HostName$ $ProcessName$[$PID$]: $RemoteIP$:$RemotePort$ [$DateTime:date$] $Frontend$ $Backend$/$Server$ $RequestTime$/$QueueTime$/$ConnectionTime$/$ResponseTime$/$TimeTaken$ $Status:number$ $BytesSent:number$ $RequestCookie$ $ResponseCookie$ $TerminationState$$CookieStatus$ $ProcessCC$/$FrontendCC$/$BackendCC$/$ActiveCC$/$Retries$ $ServerQueue$/$BackendQueue$ \"$Method$ $RequestURI$ $Protocol$
Sample log
Aug 16 15:01:25 magesh-1870 haproxy[10133]: 127.0.0.1:51590 [16/Aug/2017:15:01:25.421] firstbalance webservers/webserver2 66/0/0/1/67 304 125 - - ---- 3/3/0/1/0 0/0 \"GET /icons/ubuntu-logo.png HTTP/1.1\
The above sample log can be separated into 30 fields, each of which will take its respective value from here and will then be uploaded to Site24x7.
| Field name | Field value |
| Date | Aug 16 15:01:25 |
| Host Name | magesh-1870 |
| Process Name | haproxy |
| PID | [10133]: 127.0.0.1:51590 |
| Remote IP | 127.0.0.1: |
| Remote Port | 51590 |
| Date Time | 16/Aug/2017:15:01:25.421 |
| Front End | firstbalance |
| Back End | webservers |
| Server | webservers2 |
| Request Time | 66 |
| Queue Time | 0 |
| Connection Time | 0 |
| Response Time | 1 |
| Time Taken | 67 |
| Status | 304 |
| Bytes Sent | 125 |
| Request Cookies | - |
| Termination States | - |
| Cookie Status | - |
| Process CC | 3 |
| Frontend CC | 3 |
| Backend CC | 0 |
| Active CC | 1 |
| Retries | 0 |
| Server Queues | 0 |
| Backend Queues | 0 |
| Method | GET |
| Request URI | /icons/ubuntu-logo.png HTTP/ |
| Protocol | 1.1 |
HAproxy logs dashboard
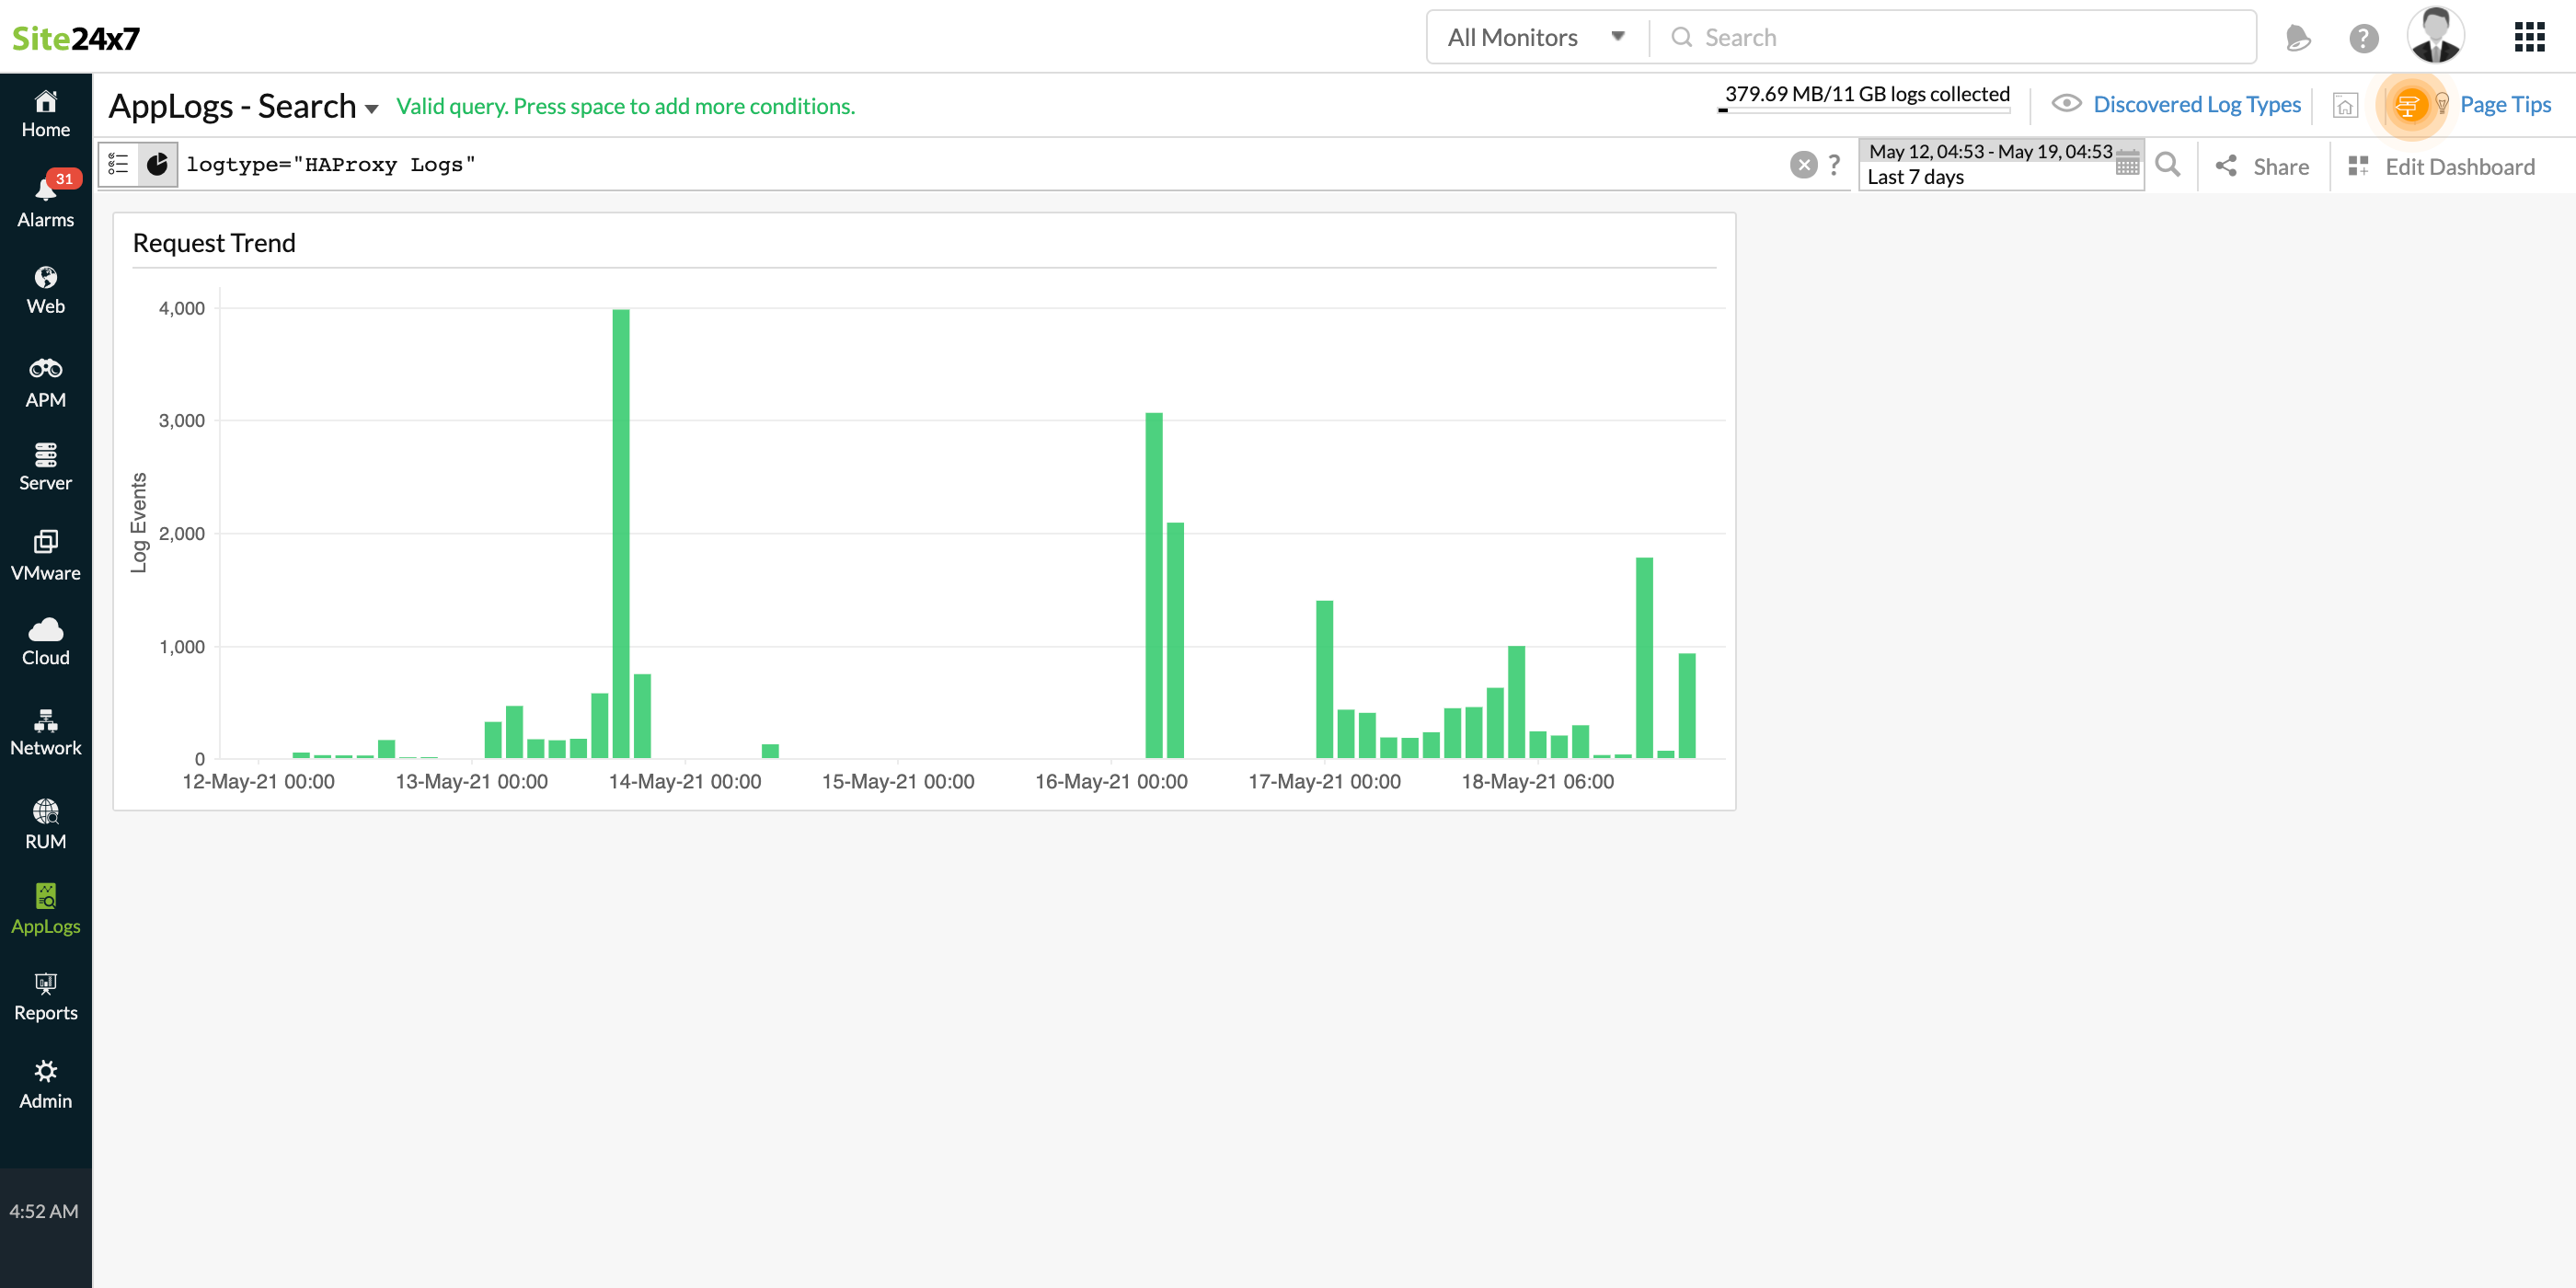
AppLogs creates an exclusive dashboard for every Log Type, and shows a few widgets by default. Here's a list of the widgets available in the HAproxy logs dashboard:
- Request Trend
- Top 10 Client IPs
- Rate of Bytes Served
- Top 20 Failed Requests
- Status Code Stats
- Response Time Stats
- HTTP Methods

In addition to the default widgets, your saved searches will also be added to the dashboard automatically.
