Caddy access logs
Caddy is a powerful, enterprise-ready, open-source web server with automatic HTTPS written in Go. Caddy access logs can listen to and log all audit-based events, based on the defined set of rules. Site24x7 AppLogs natively supports Caddy access logs.
Getting started
1. Log in to your Site24x7 account.
2. Download and install the Site24x7 Server Monitoring agent (Windows | Linux).
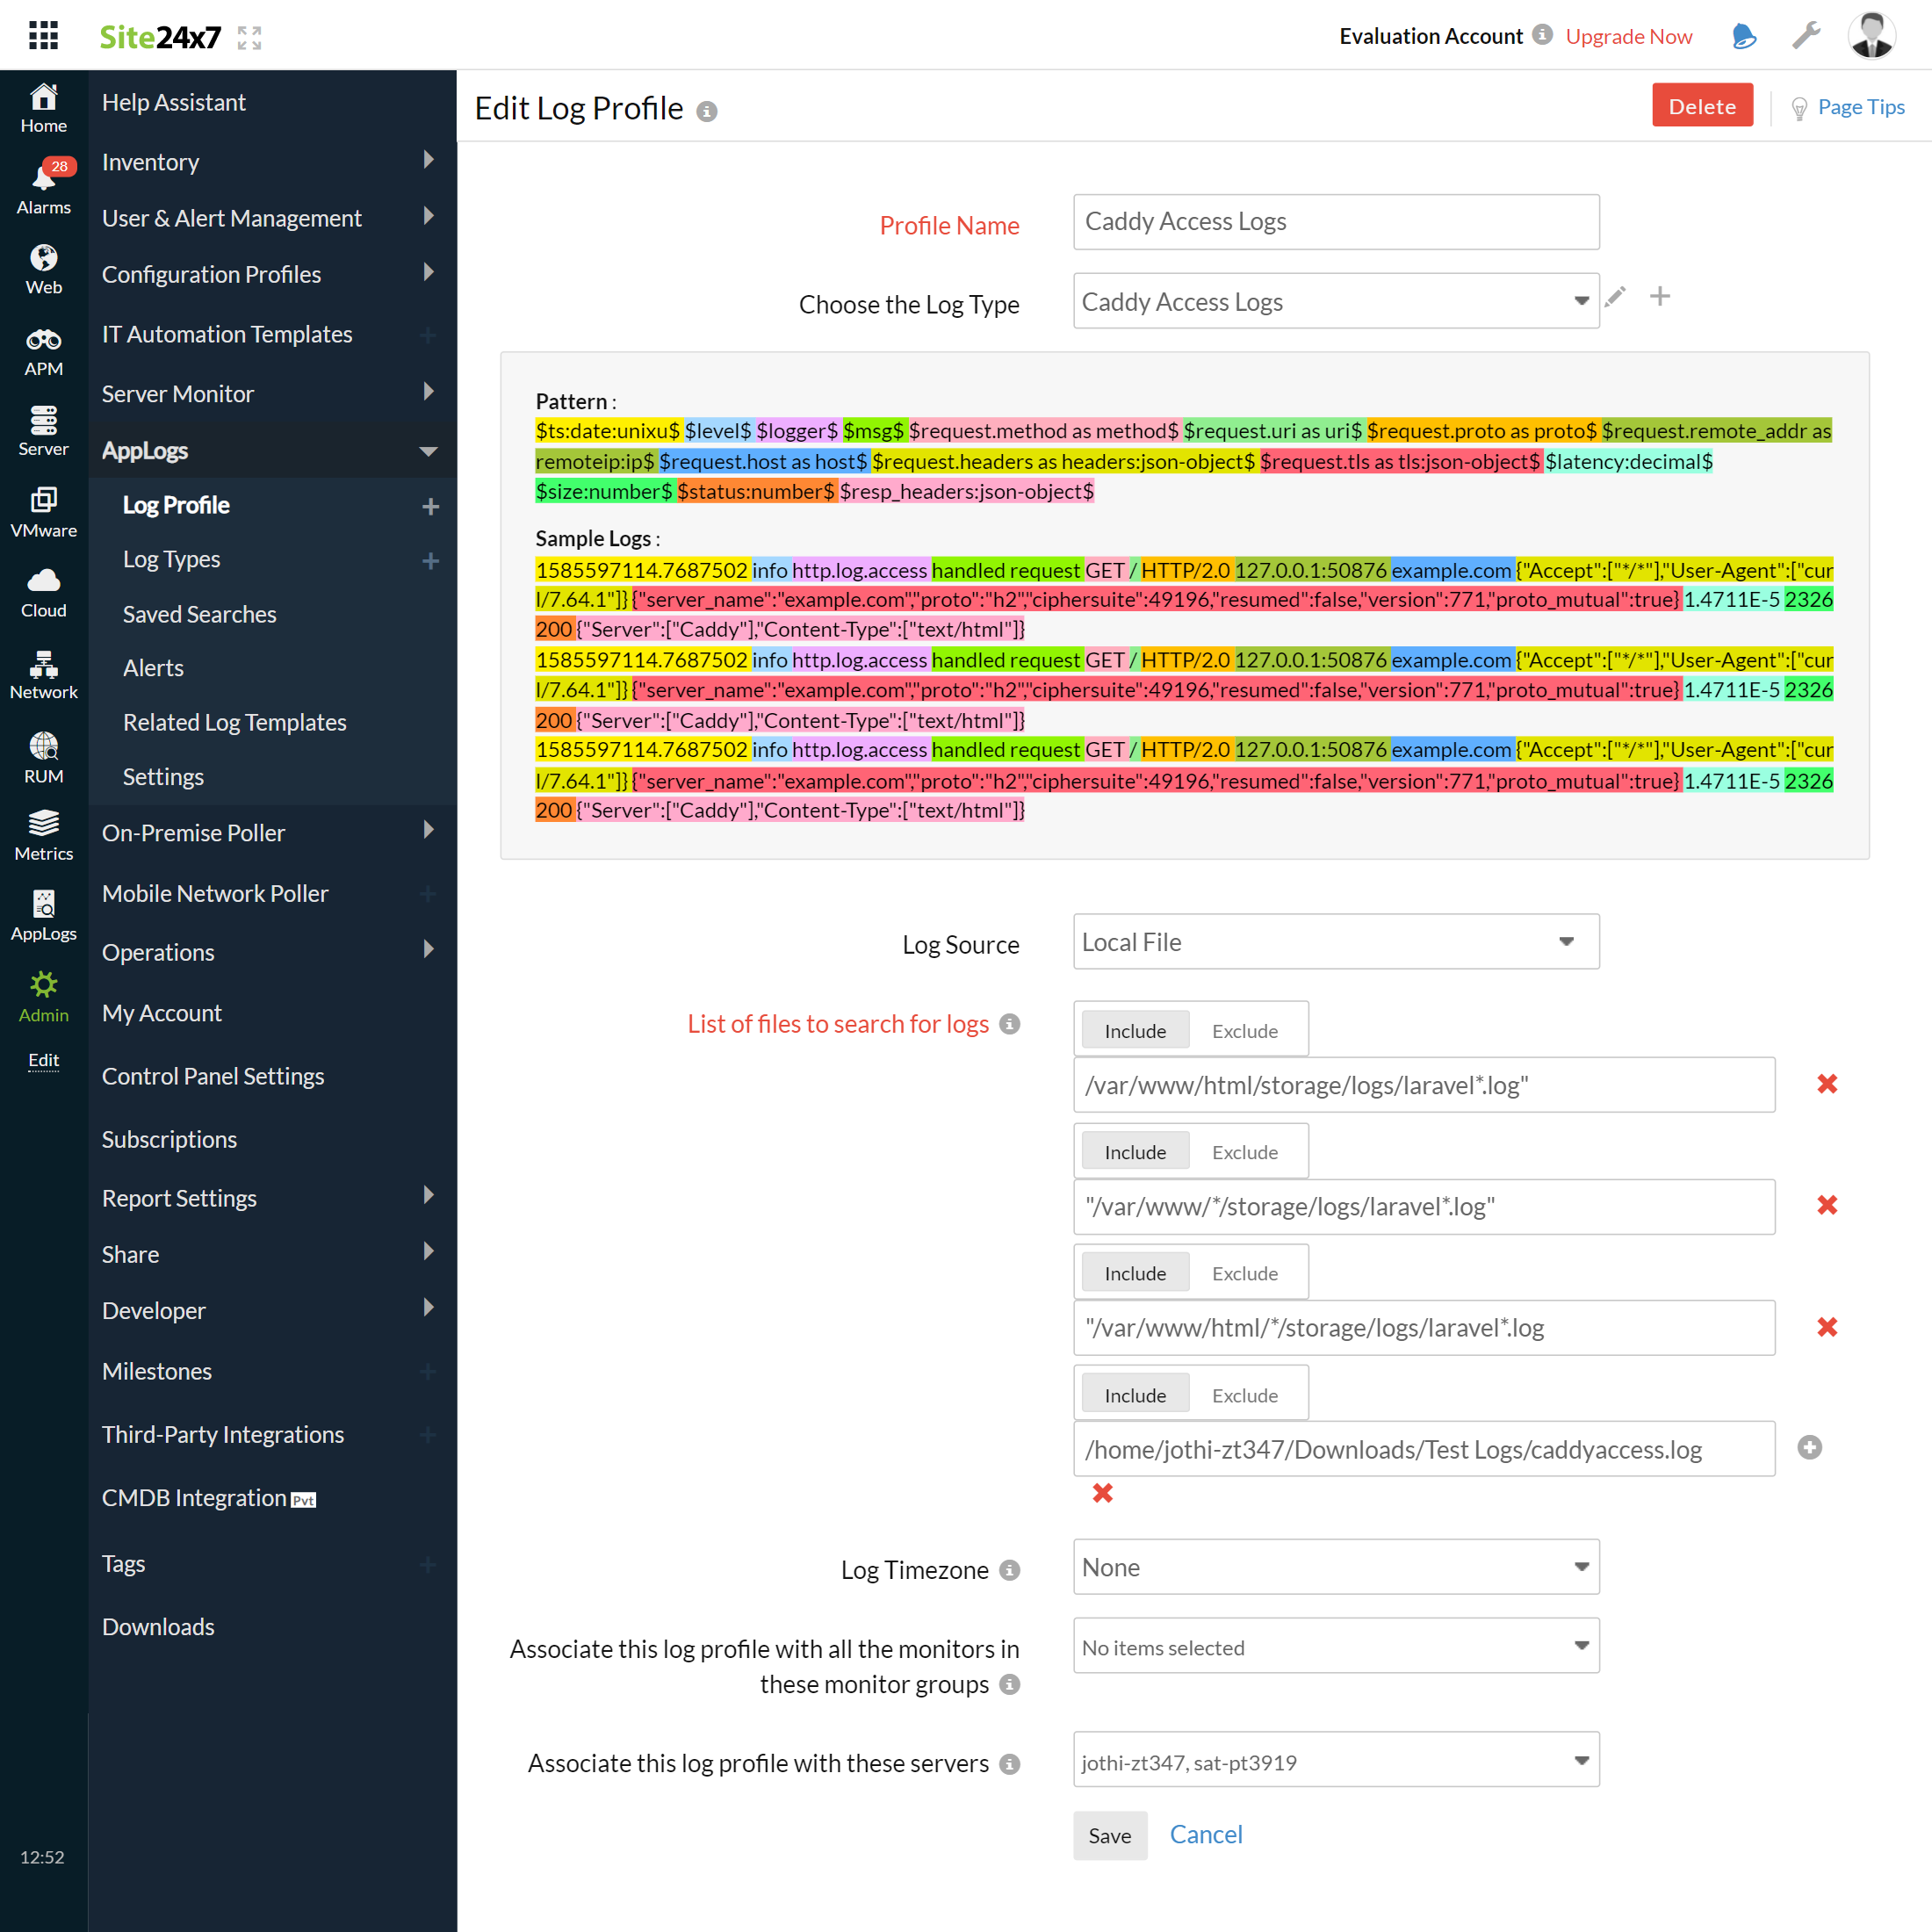
3. Go to Admin > AppLogs > Log Profile and select Add Log Profile.
4. Enter the Profile Name.
5. Select Caddy Access Logs from the Choose the Log Type drop-down.
- The Sample Logs and Log Pattern are displayed below.
Sample logs:
{"level":"info","ts":"1585597114.7687502", "logger":"http.log.access","msg":"handled request", "request": {"method":"GET", "uri":"/", "proto":"HTTP/2.0", "remote_addr":"127.0.0.1:50876", "host":"example.com","headers":{"User-Agent":["curl/7.64.1"],"Accept":["*/*"]},"tls":{"resumed":false,"version":771,"ciphersuite":49196,"proto":"h2","proto_mutual":true,"server_name":"example.com"}},"latency":0.000014711,"size":2326,"status":200,"resp_headers":{"Server":["Caddy"],"Content-Type":["text/html"]}}
{"level":"info","ts":"1585597114.7687502", "logger":"http.log.access","msg":"handled request", "request": {"method":"GET", "uri":"/", "proto":"HTTP/2.0", "remote_addr":"127.0.0.1:50876", "host":"example.com","headers":{"User-Agent":["curl/7.64.1"],"Accept":["*/*"]},"tls":{"resumed":false,"version":771,"ciphersuite":49196,"proto":"h2","proto_mutual":true,"server_name":"example.com"}},"latency":0.000014711,"size":2326,"status":200,"resp_headers":{"Server":["Caddy"],"Content-Type":["text/html"]}}
{"level":"info","ts":"1585597114.7687502", "logger":"http.log.access","msg":"handled request", "request": {"method":"GET", "uri":"/", "proto":"HTTP/2.0", "remote_addr":"127.0.0.1:50876", "host":"example.com","headers":{"User-Agent":["curl/7.64.1"],"Accept":["*/*"]},"tls":{"resumed":false,"version":771,"ciphersuite":49196,"proto":"h2","proto_mutual":true,"server_name":"example.com"}},"latency":0.000014711,"size":2326,"status":200,"resp_headers":{"Server":["Caddy"],"Content-Type":["text/html"]}}
This log is separated into fields, each of which takes its respective value and is then uploaded to Site24x7. - You can also add a custom log pattern instead of the default one. To do so, click the pencil icon and specify your pattern.
6. Select the Local File as the Log Source.
7. By default, the paths below are used as the file sources:
Linux:"/opt/caddy/logs/*access.log,/home/*/caddy/logs/*access.log, C:\caddy\logs\*access.log"
- If your source path is different from the default path, specify it in the List of files to search for logs field.
8. Select either monitors or monitor groups to collect the logs.

9. Click Save.
Dashboard
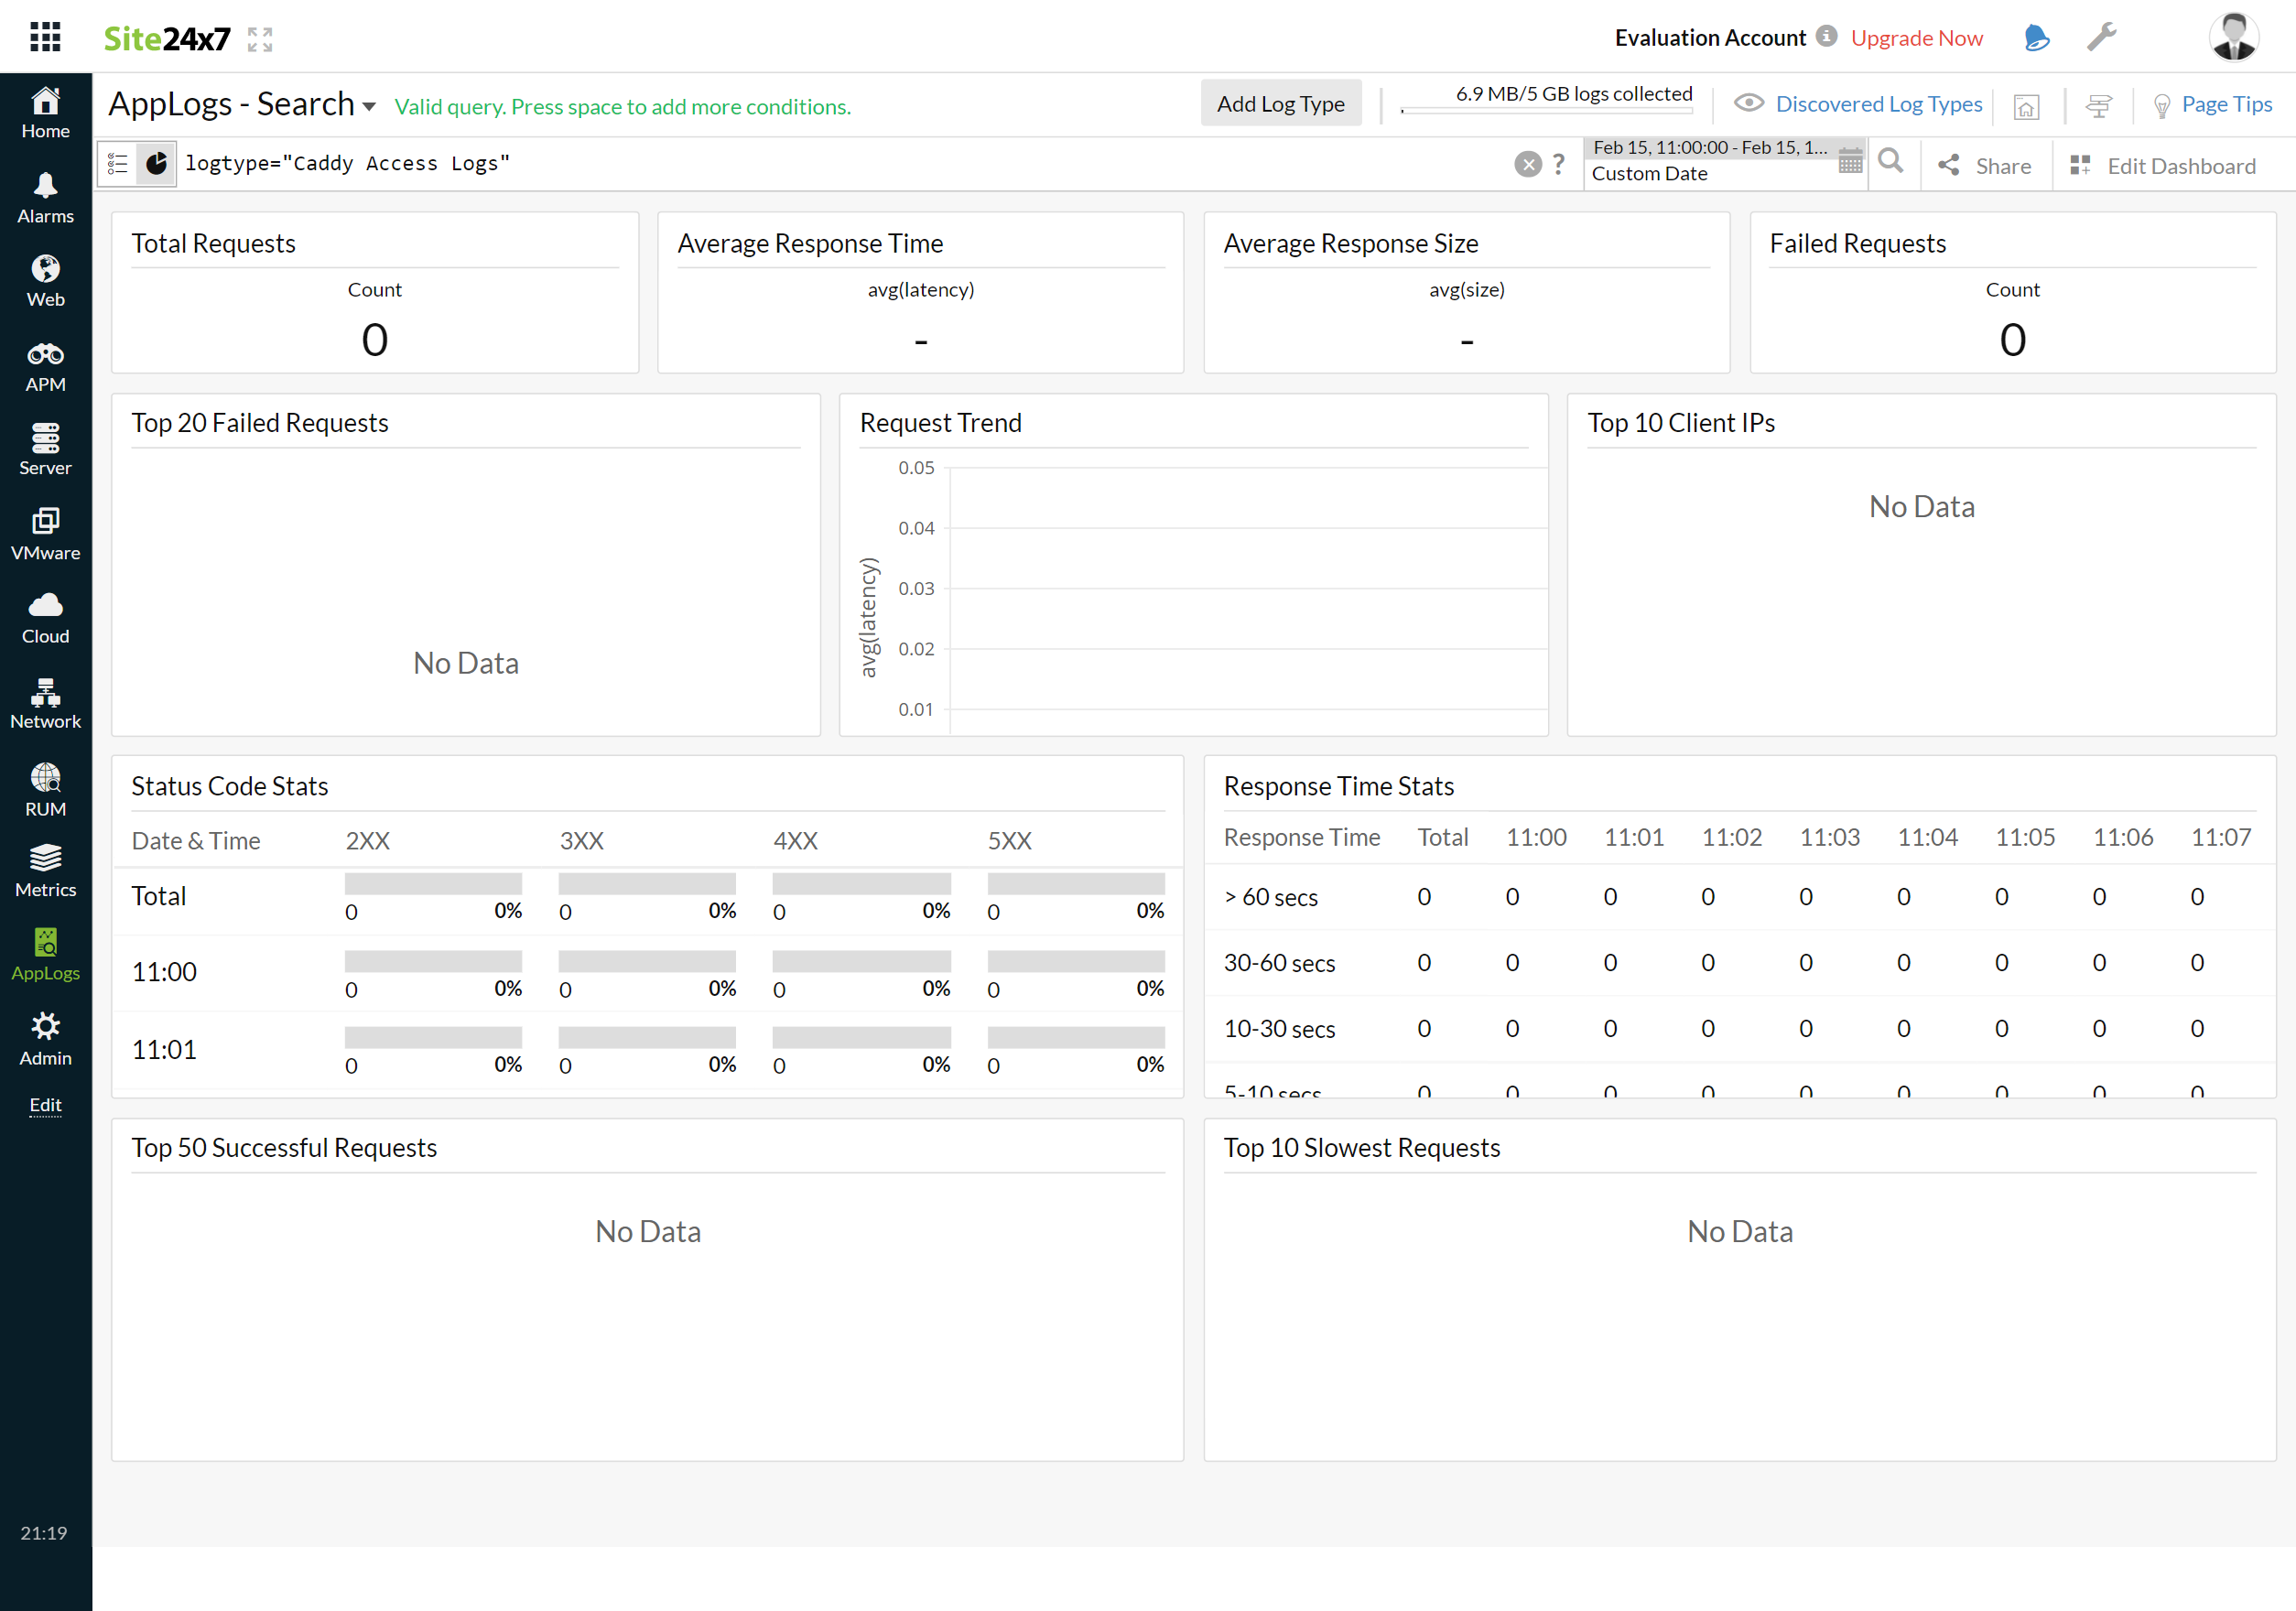
AppLogs creates an exclusive dashboard for every log type and shows a few widgets by default. Here's a list of the widgets available in the Caddy Access Log dashboard:
- Total Requests
- Average Response Time
- Average Response Size
- Failed Requests
- Top 20 Failed Requests
- Request Trend
- Top 10 Client IPs
- Status Code Stats
- Response Time Stats
- Top 10 Successful Requests
- Top 10 Slowest Requests
- Top 50 Successful Requests
- Top 10 Slowest Requests

Related log types
-
On this page
- Getting started
- Dashboard
- Related log types
