Threshold and Availability for VMware Datastore Monitor
Threshold Profiles help alarms engine to decide if a specific resource is Critical, or in Trouble. After adding a VMware Datastore for monitoring, you can configure thresholds for critical performance metrics and receive alerts, using which you can avoid many issues.
A default threshold and availability profile for VMware Datastore Monitor will be automatically listed in the Threshold and Availability screen when you use for the first time. You can add new ones using the steps below:
Creating a Threshold and Availability Profile for VMware Datastore Monitors
- Log in to your Site24x7 account.
- Click Admin > Configuration Profiles > Threshold and Availability.
- Click Add Threshold and Availability on the Add Threshold Profile screen.
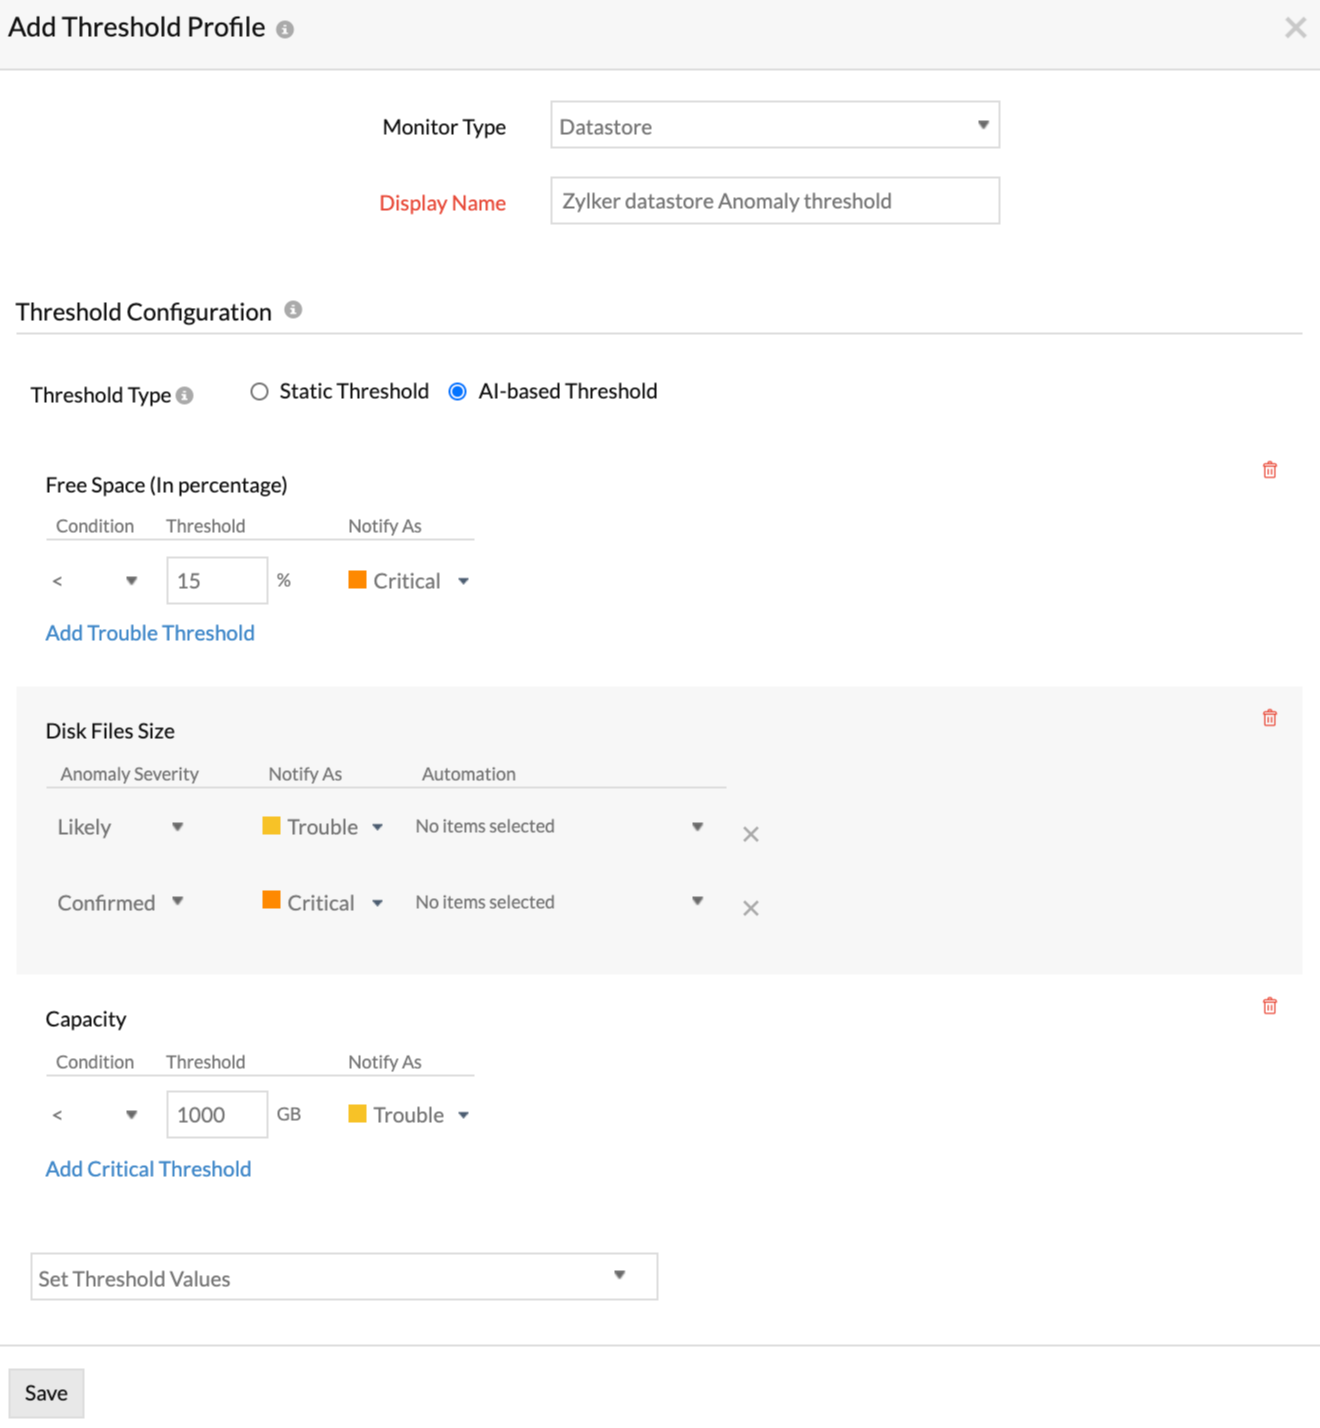
- Specify the following details:
- Monitor type: Select VMWare datastore monitor from the drop-down list.
- Display name: Provide a label for identification purposes.
- Threshold Type: You can choose between Static and AI-based thresholds.
- Static Thresholds: Set the threshold conditions (<, <=,=,>, or >=) for the following performance metrics to receive alerts if they're breached. The monitor’s status changes to ”Trouble or Critical” when the condition applied to any of the below threshold strategies hold true.
- For VMware Datastore monitors you can configure thresholds for: Freespace in datastore, Capacity of datastore, Snapshots in datastore, Swap files in datastore, and Disk files in datastore.
- AI-based Thresholds: The AI-based threshold will track the abnormal spikes using anomaly detection and will offer a dynamic threshold which will be updated accordingly. If you're choosing AI-based threshold, choose associated anomaly severity and the status accordingly.
- For VMware Datastore monitors, you can configure AI-based thresholds for the following metrics: Swap Files Size, Disk Files Size, and Snapshots Size
- Static Thresholds: Set the threshold conditions (<, <=,=,>, or >=) for the following performance metrics to receive alerts if they're breached. The monitor’s status changes to ”Trouble or Critical” when the condition applied to any of the below threshold strategies hold true.
- Advanced Threshold Settings: Set complex alert conditions using logical operators across multiple attributes to detect anomalies precisely using advanced threshold settings.
- Click Save.

The threshold and availability profile created for the VMWare datastore monitor will be automatically listed on the Threshold and Availability screen, along with any profiles you've already created.
Edit thresholds and availability for VMware datastore monitors:
- Go to Admin > Configuration Profiles > Threshold and Availability.
- Click the profile that you'd like to edit.
- Edit the necessary parameters in the Edit Threshold Profile window.
- Click Save.
Delete thresholds and availability for VMware datastore monitors:
- Go to Admin > Configuration Profiles > Threshold and Availability.
- Click the profile that you'd like to delete in the Threshold and Availability screen.
- This will redirect you to the Edit Threshold Profile window.
- Click Delete.
