Interpret Metrics: REST API Transaction monitor
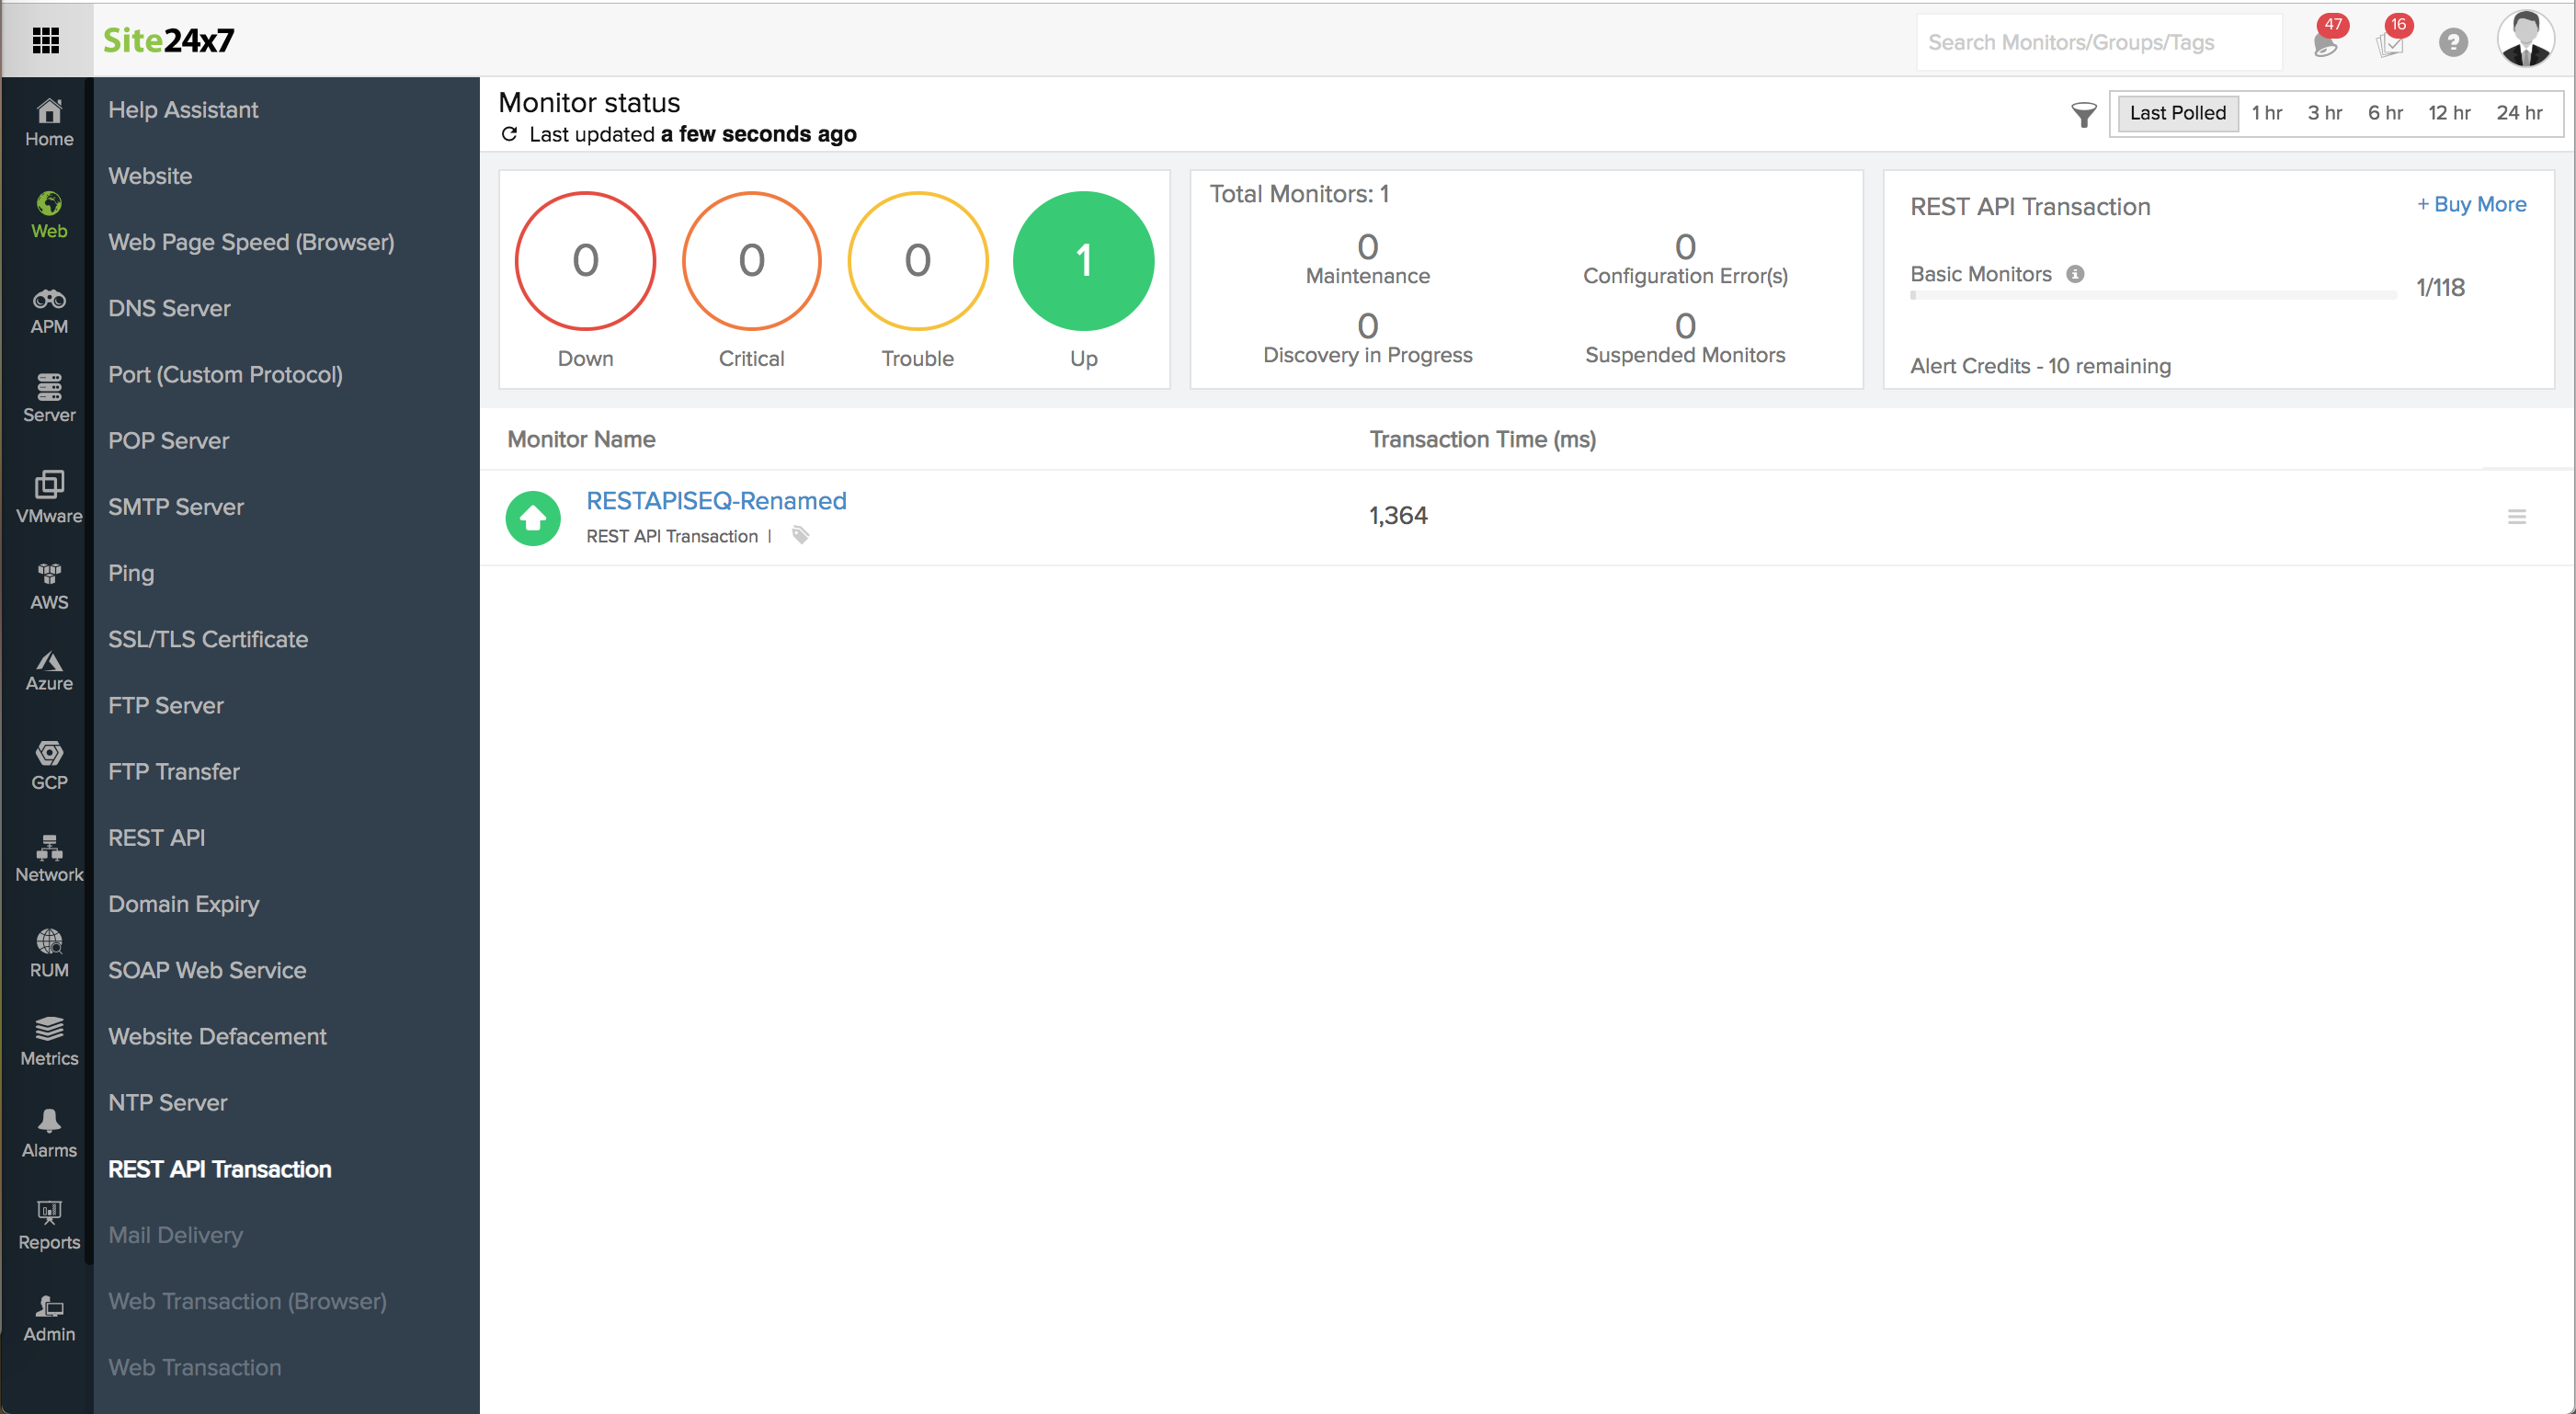
REST API Transaction Monitor tests and validates workflows in REST applications, where each step will either be an HTML request or a REST API call. The monitor performs synthetic monitoring of your web application workflows without the overhead of a real browser. You can manually create and monitor upto 60 endpoint URLs at a check frequency of 10 minutes from your webclient itself. Additionally, import RAW request headers from your preferred browser to setup monitor. You can also perform advanced content checks or enable parameter forwarding to check continuous workflows in your REST Applications. In the status banner, you can view the total number of monitors based on their operational status and state. You can also view the number of operational monitors and alert credits remaining in your account. By clicking the "+ Buy More" button, you can purchase additional monitors and alert credits. You can share the monitor details via an email. Email can be sent to only those verified users who have agreed to receive emails from Site24x7.
REST API Transaction Monitor records availability, average response time, throughput, and Transaction time stats of your web application from your configured locations. You can check the SLA compliance of your third-party SLAs too. The Monitor Details page primarily highlights these reports:
- General Summary
- Outages
- Inventory
- Log Report
- Availability Summary
- Performance Report
- Attribute Details
- Step Details
- Root Cause Analysis Report
Summary Dashboard
Events Timeline
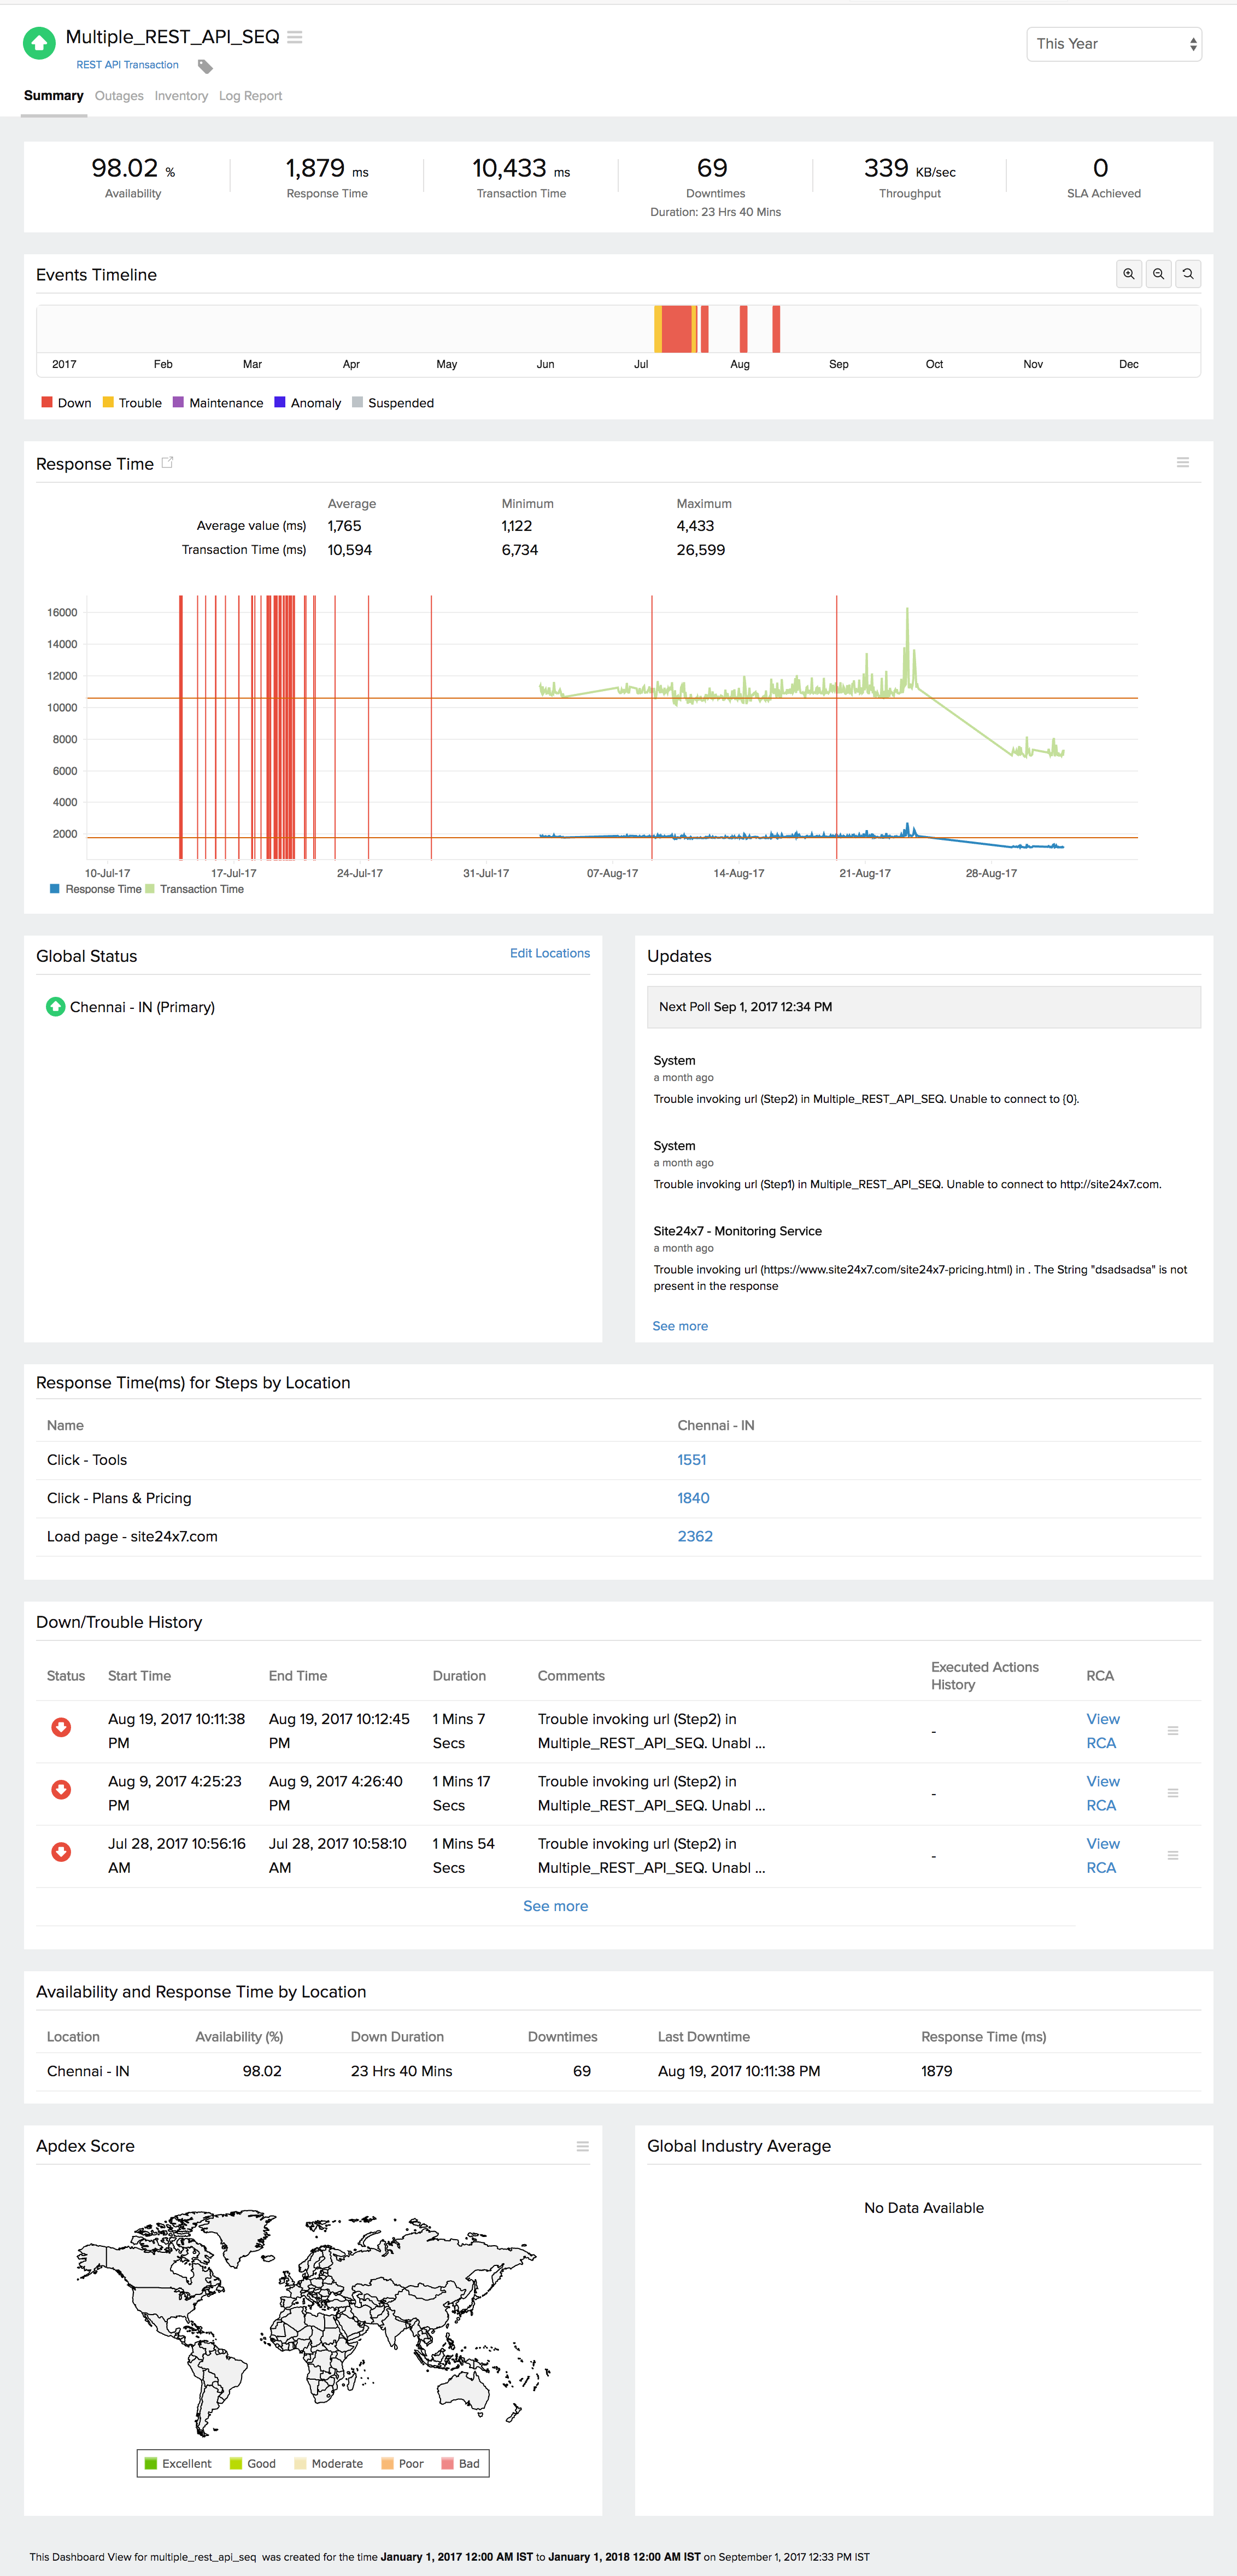
Events timeline widget records all the past events of your selected monitor for a selected time range. You can identify/decode various events from the past, which includes Down, Critical, Trouble, Maintenance, Suspended, or Anomalies. Each event are color coded for easy identification. Events can be drilled down to extract maximum data and facilitate easy troubleshooting. You can also track the actual outage period and the total outage duration during a specific block of time.
Navigate to Web icon and click the appropriate web application monitor listed in the monitor summary. This page would cause the following metrics displayed in the form of graphs and tables:
- Response Time and Response Time by Location indicate the location based total time taken to retrieve the entire HTML content of the webpage. Average response time and Average/95th Percentile response time by Location data are presented in a tabular layout for easy assimilation.
- Response Time (ms) for Steps by Location shows you the location wise time taken to download the entire HTML content of the web page.
- Transaction Time (ms) shows you the time taken to complete a transaction for each of your recorded steps.
- Availability & Response Time by Location, which gives a graphical and tabular view of location wise availability and other related metrics.
- Stats from Apdex Maps using pre-installed RUM widget. It gives you the end-user performance from a global perspective.
Apdex Score and Performance Benchmarking
With our RUM integration widget, you can instantly use the Apdex industry standard for measuring the satisfaction of a user using your application or service, you can understand how your applications are performing from your users’ perspective, i.e, “Satisfied”, “Tolerating”, or “Frustrated”.
The benchmarks widget is now integrated within the client letting you compare your website performance with industry peers. With our performance benchmarking widget, you can instantly view and compare your average/95th percentile response time and availability of your service with respect to your industrial peers. This can be viewed across various industrial verticals.
Response Time
Response Time indicates the total time required to fetch your API response. The graph is calculated by plotting time period against response time. You can further filter out the three point, five point moving averages and also the 95 percentile by selecting the appropriate legends. The graph also lets you zoom in and isolate the exact data from the graphical spikes. You can also add specific notes to inform users about the various outages and maintenance activities.
Average Response Time, Maximum Response Time, Minimum Response Time, and 95th Percentile values are detailed in a tabular layout. Average/95th Percentile Response Time By Location is also defined based on the various locations selected.
Response Time (ms) for Steps by Location
It presents you the location wise time taken to receive individual API responses for the steps in your web application.
Transaction Time
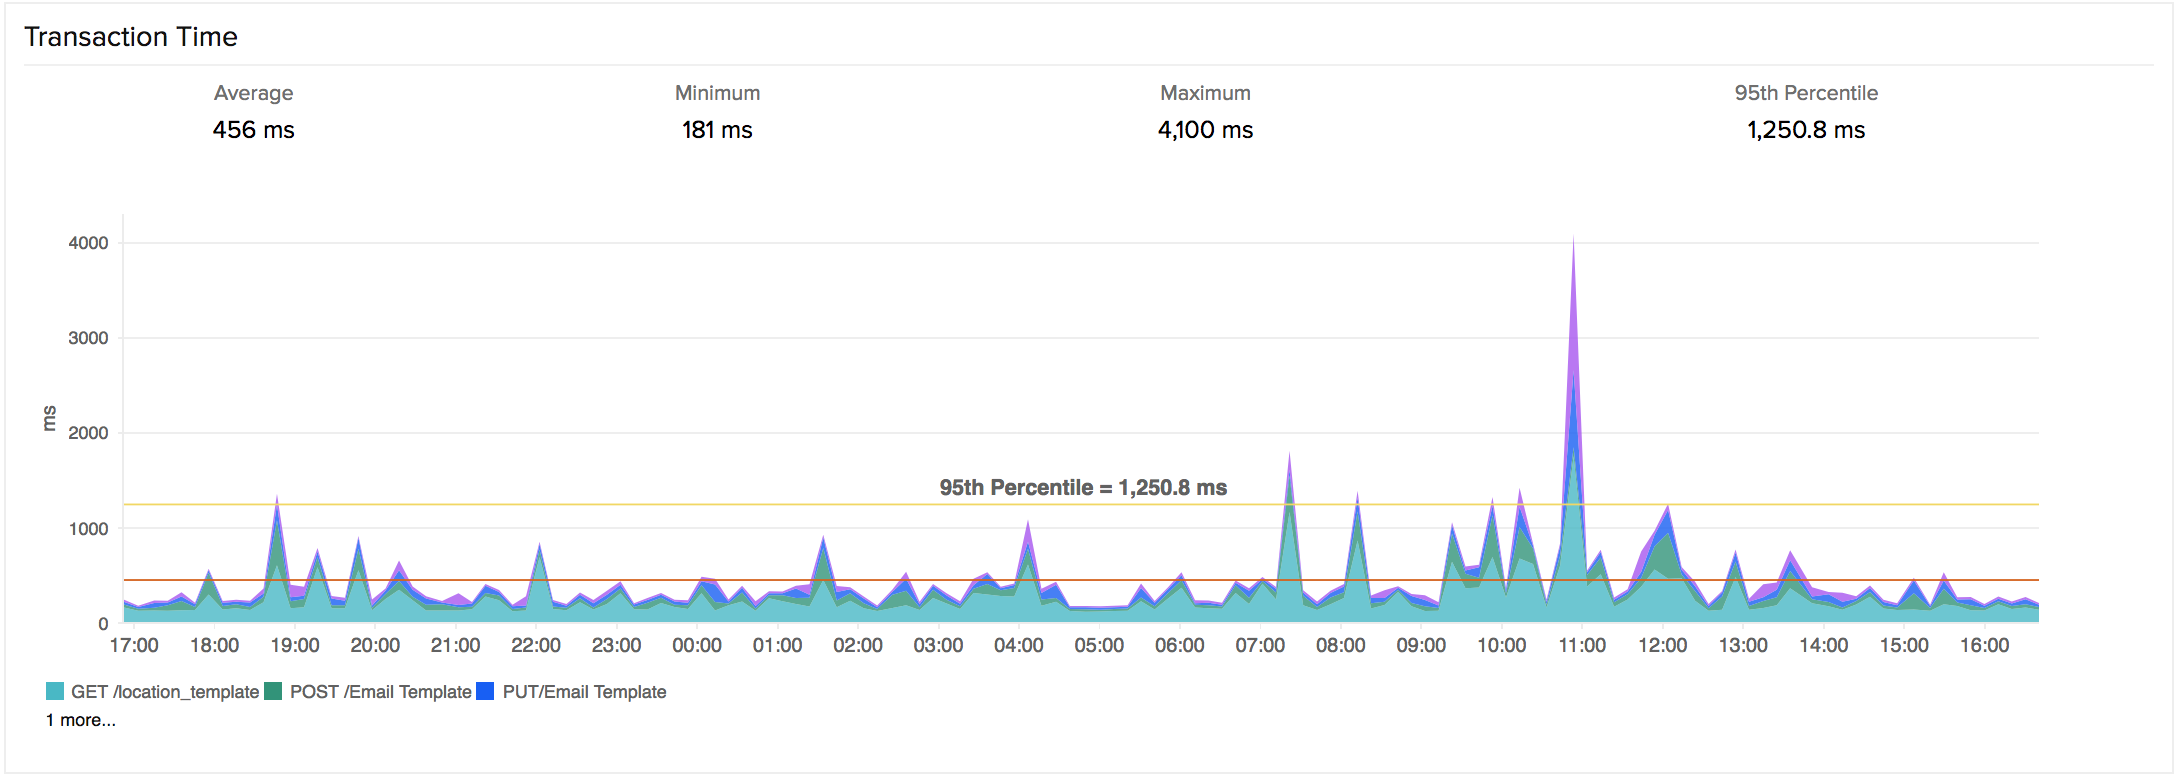
Transaction Time by Location graph shows the average/95th Percentile transaction time for each day or hour from every monitoring location. This graph can be used to analyze the average transaction time of your monitor from different monitoring locations. The location is identified using legend given below the graph.
Transaction Time by Location

Down/Trouble History
It offers detailed insight into the trouble history of your monitor. You can view the status, the exact downtime, duration, and specific reason for the down status.
Availability & Response Time by Location
The availability and response time of the web application monitor for each and every monitoring location is expressed in a tabular format. The total availability percentage and Response Time (ms) with down duration from each monitoring location can be deducted from this data.
Geo Map
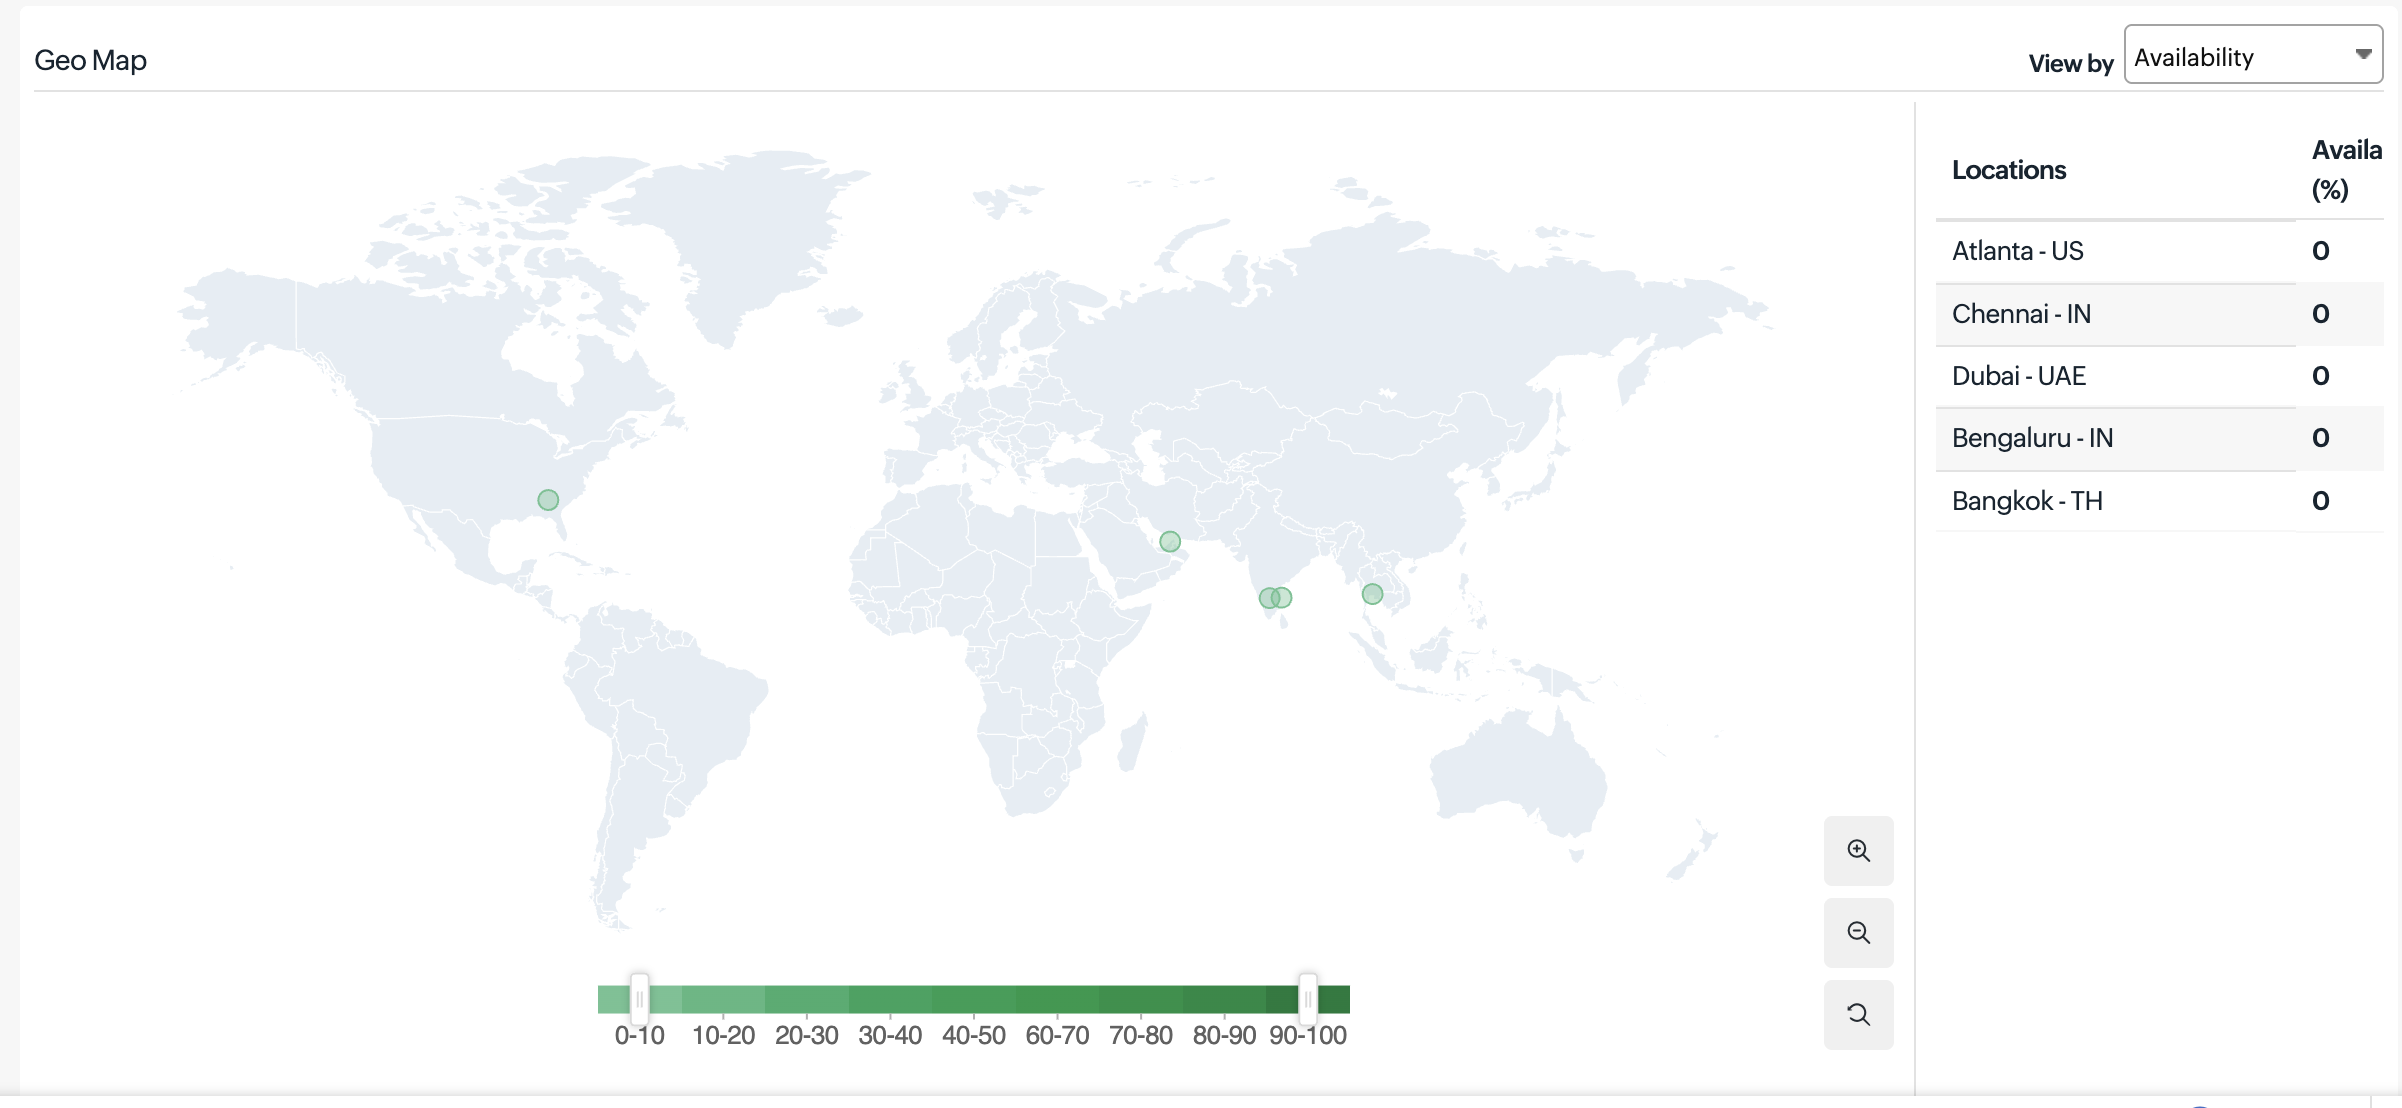
The Geo Map provides a visualization of your REST API transaction’s global availability and performance by consolidating data from synthetic monitoring and RUM sources. It tracks multi-step API workflows executed from monitoring locations and combines them with real-user interaction data. You can hover over different regions to view average transaction time and other key metrics, helping you understand how your API transactions perform across geographies.
With the Geo Map, you can quickly identify regions experiencing slow transaction execution and correlate synthetic transaction data with real-user performance. This helps determine whether issues are localized or widespread, enabling faster detection and resolution of performance bottlenecks.
View by metrics
Select a metric to visualize availability and performance across locations. The Geo Map dynamically updates based on the selected metric, allowing you to analyze trends and compare synthetic and real-user experiences.
- Response Time: Displayed using color gradients (green for faster execution and red for slower). Bubble size increases with higher transaction time and decreases with faster execution, helping you identify latency-prone regions.
- Synthetic: Shows transaction time collected from monitoring locations for the configured API workflow.
- RUM: Displays transaction time as a heat map at the country level based on real user interactions.
Hovering over a location displays a tooltip with average transaction time, availability, request count (for RUM), and additional performance metrics.
- Availability (%): Represents the success rate of REST API transaction executions from each monitoring location. A color gradient (green for high availability, red for low) highlights regions where one or more steps in the transaction fail or experience issues. Hovering over a location displays a tooltip with availability details.
- Current Status: Indicates the real-time status of each monitoring location. The map shows whether the locations are up or down. This view helps you quickly assess the operational state of REST API transaction checks across all regions.
Updates
Additionally, you can also view the real-time data from the various poll cycles and it includes the outages and trouble alerts data.
Attribute Report
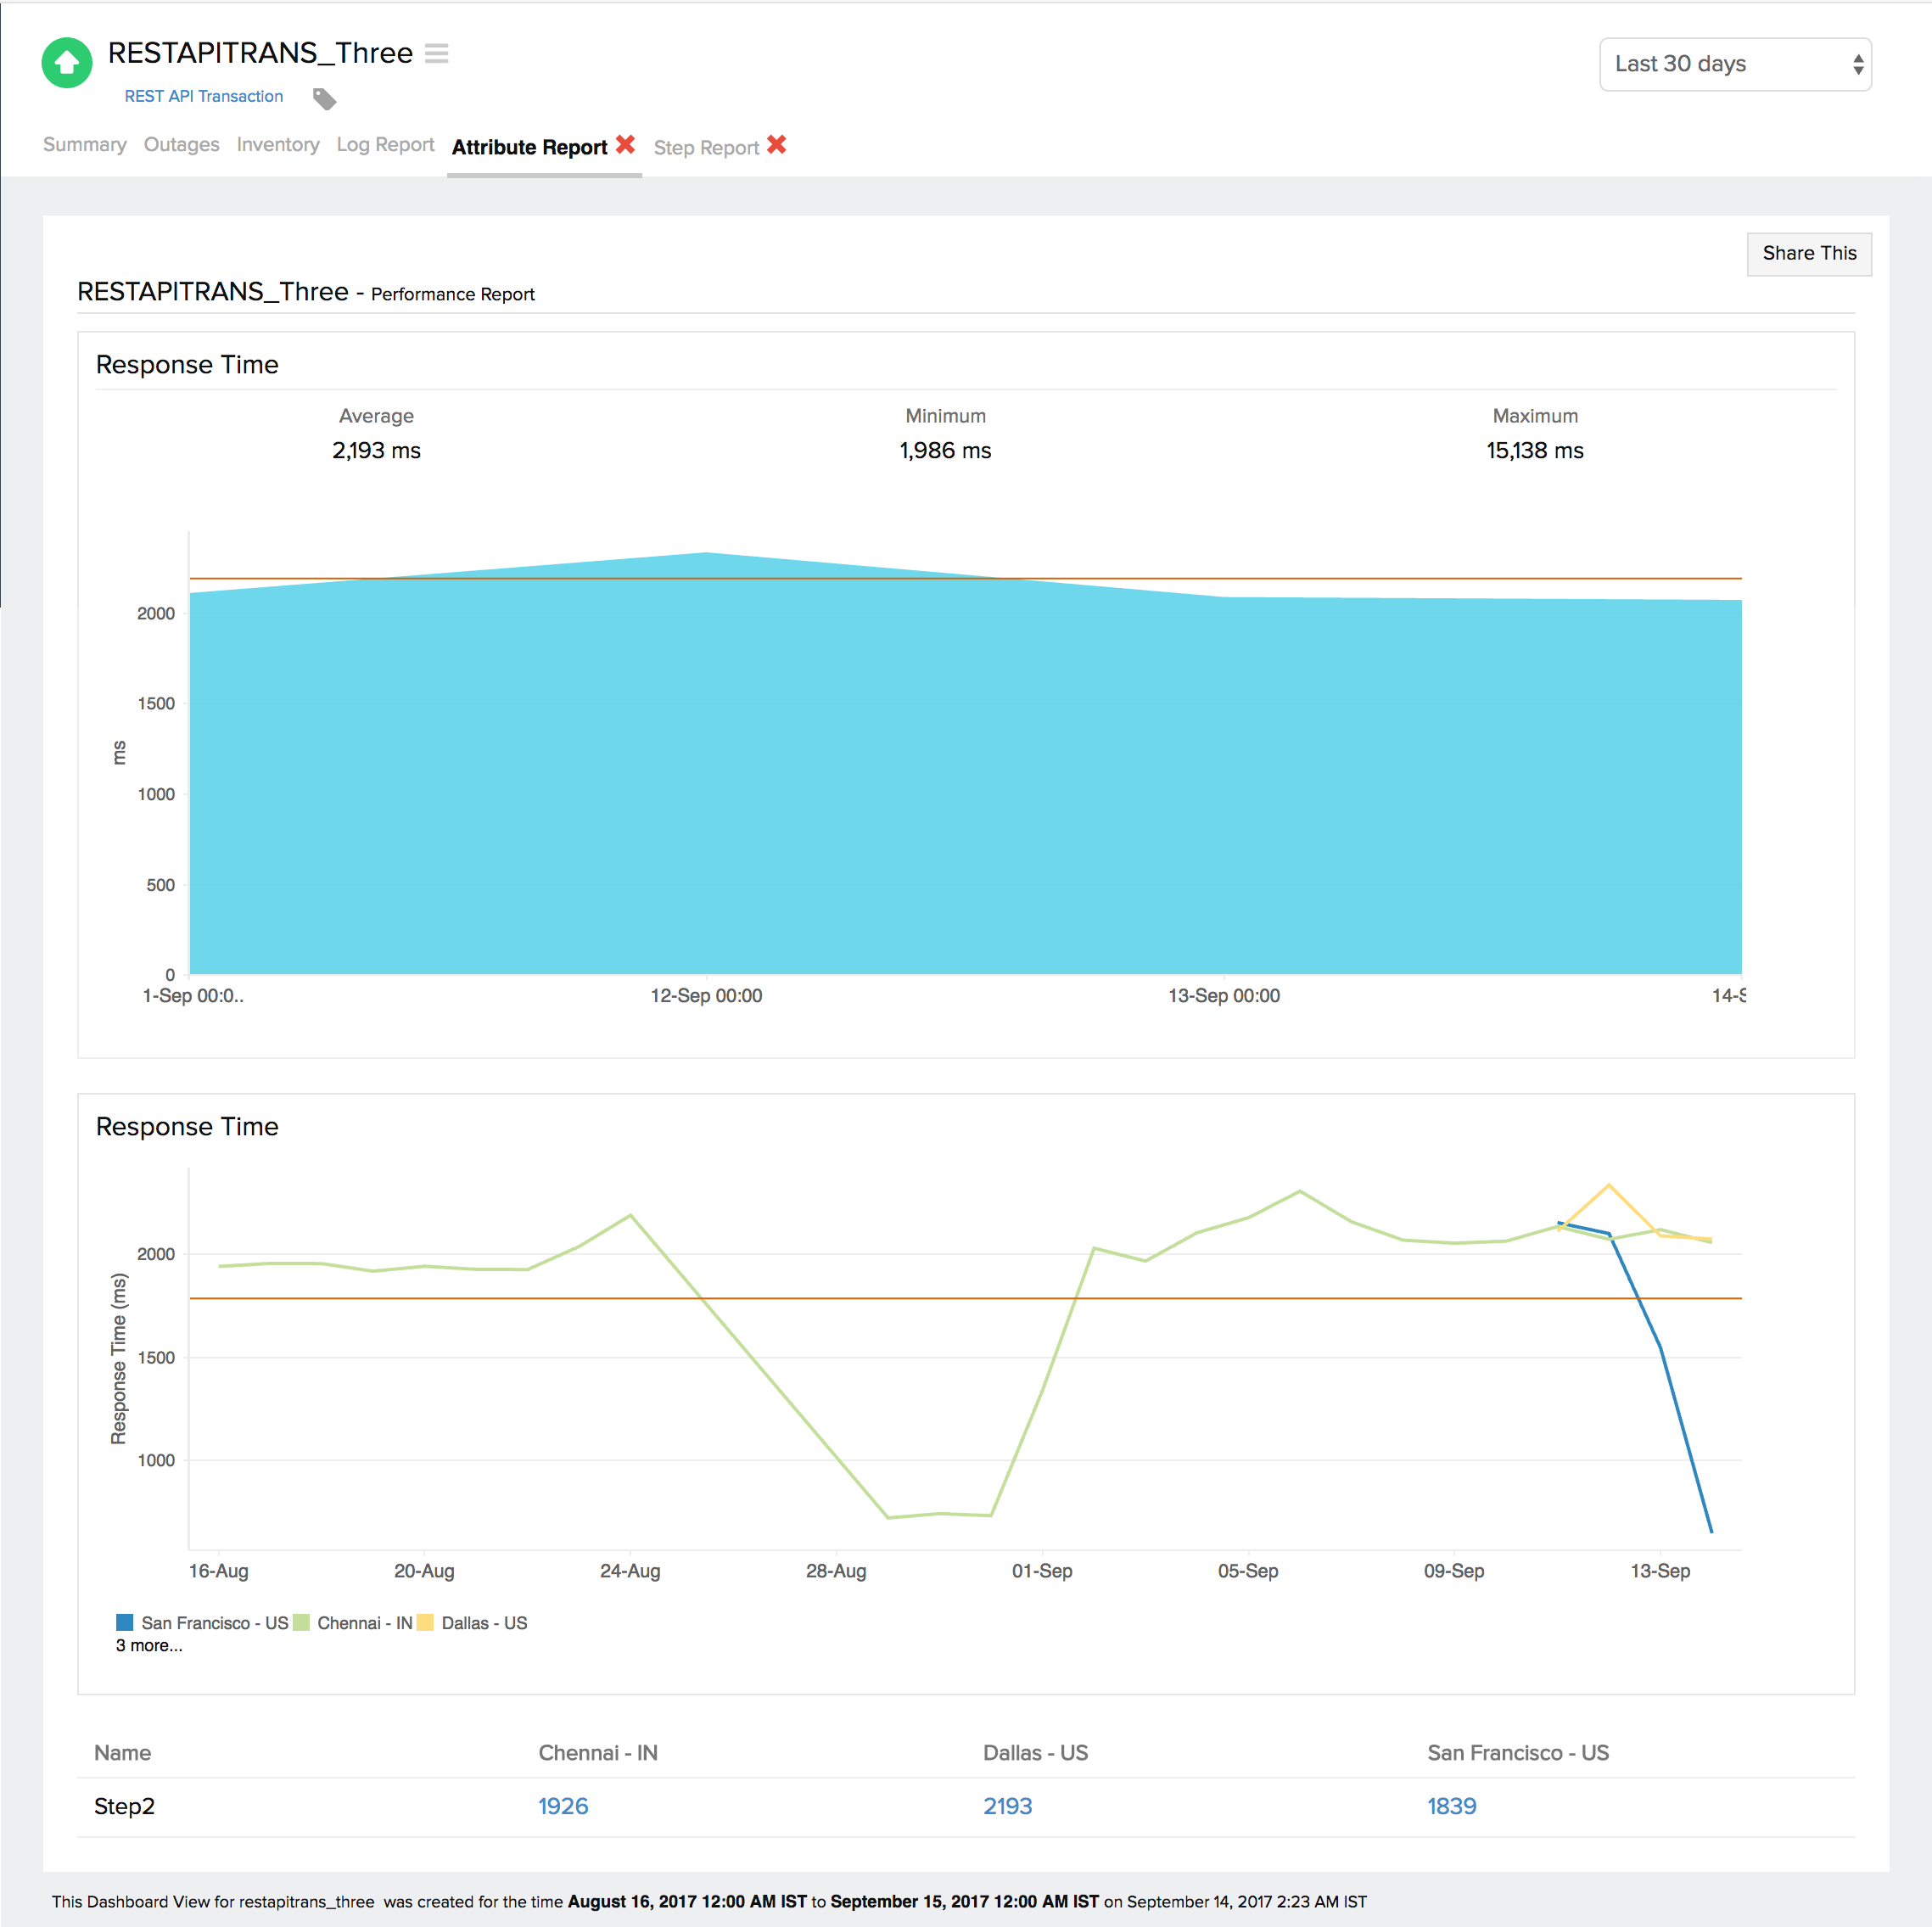
Attribute report lets you gauge average response time data of your selected step and individual response time metric during a specific time period from all your monitoring locations.
Step Report
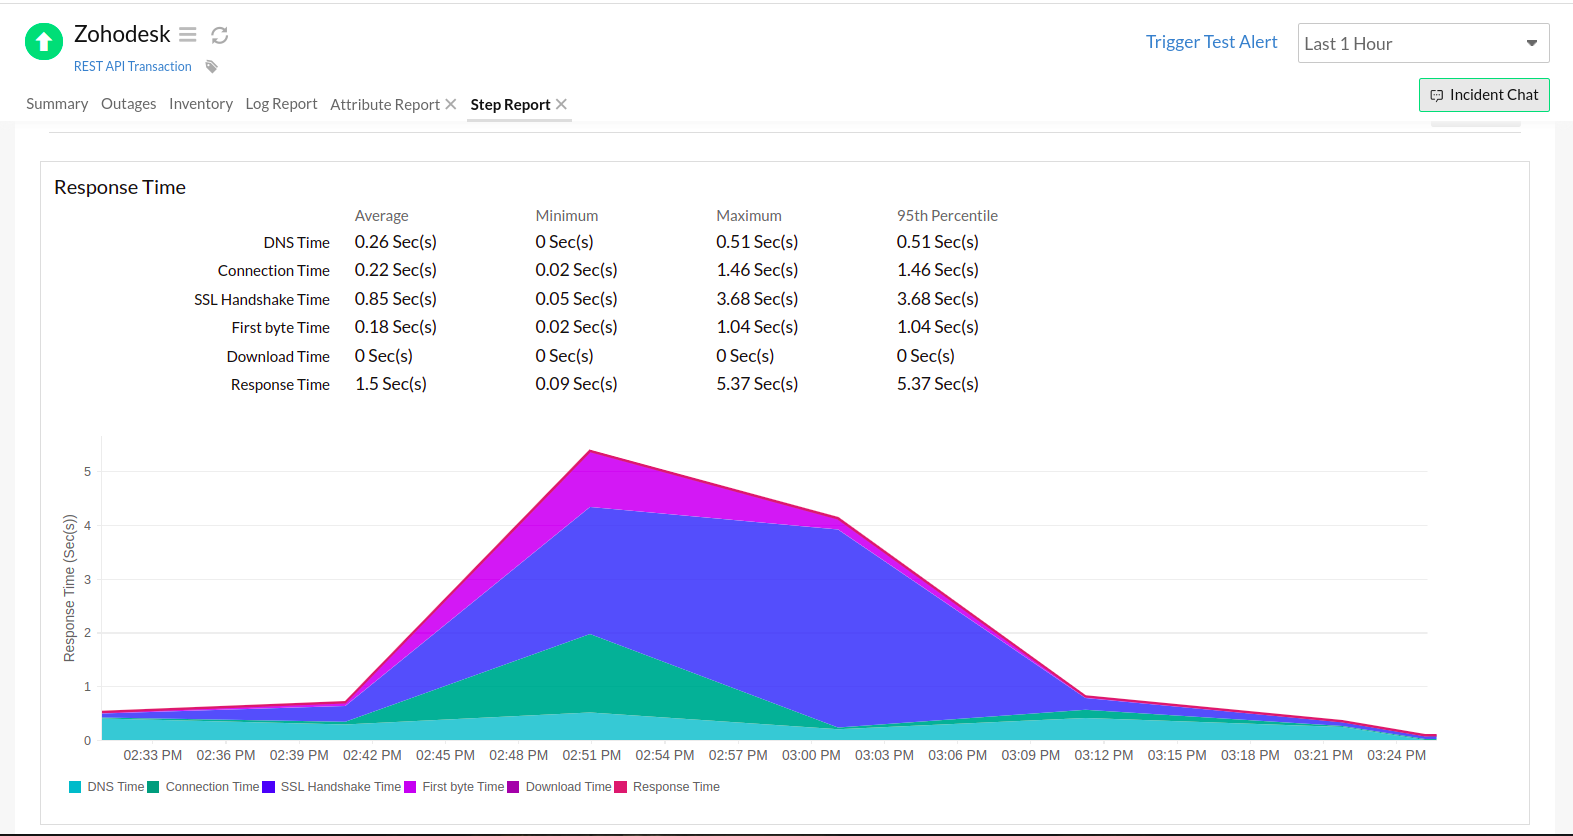
Step Report gives you the actual response time breakup of your selected step from your specific monitoring location. You can view this report as a branch out from the Attribute Report. The various metrics shown here include:
- DNS Time: The DNS Time is the time taken to resolve the domain name for the request. A spike in DNS Time indicates that is taking more time to resolve the domain.
- Connection Time: The connection time is considered as the time taken by the client to establish TCP connection with the IP address of the domain. More time to establish a connection may be due to factors such as server overloading which can be identified and addressed before it affects end-users.
- First Byte Time: The First Byte time is the time from when the connection to the server is established until the first response starts coming in for the base page. This is actually the server response time plus network latency time. A spike in First Byte Time in your graph can indicate a delay in the processing of request in the server.
- Download Time: Download Time is the time taken for the last byte of the page to be received from the server. An increase in the download time in your Response Time graph can be due to an extra amount of content transfer during the request or the availability of low bandwidth for content transfer.
- SSL Handshake Time: The time taken to complete the SSL/TLS handshake. This includes confirming the identity of the server and the client, sharing details of the ciphers, signatures, or other options each party supports, and the creation or exchange of keys for data encryption.
Outages
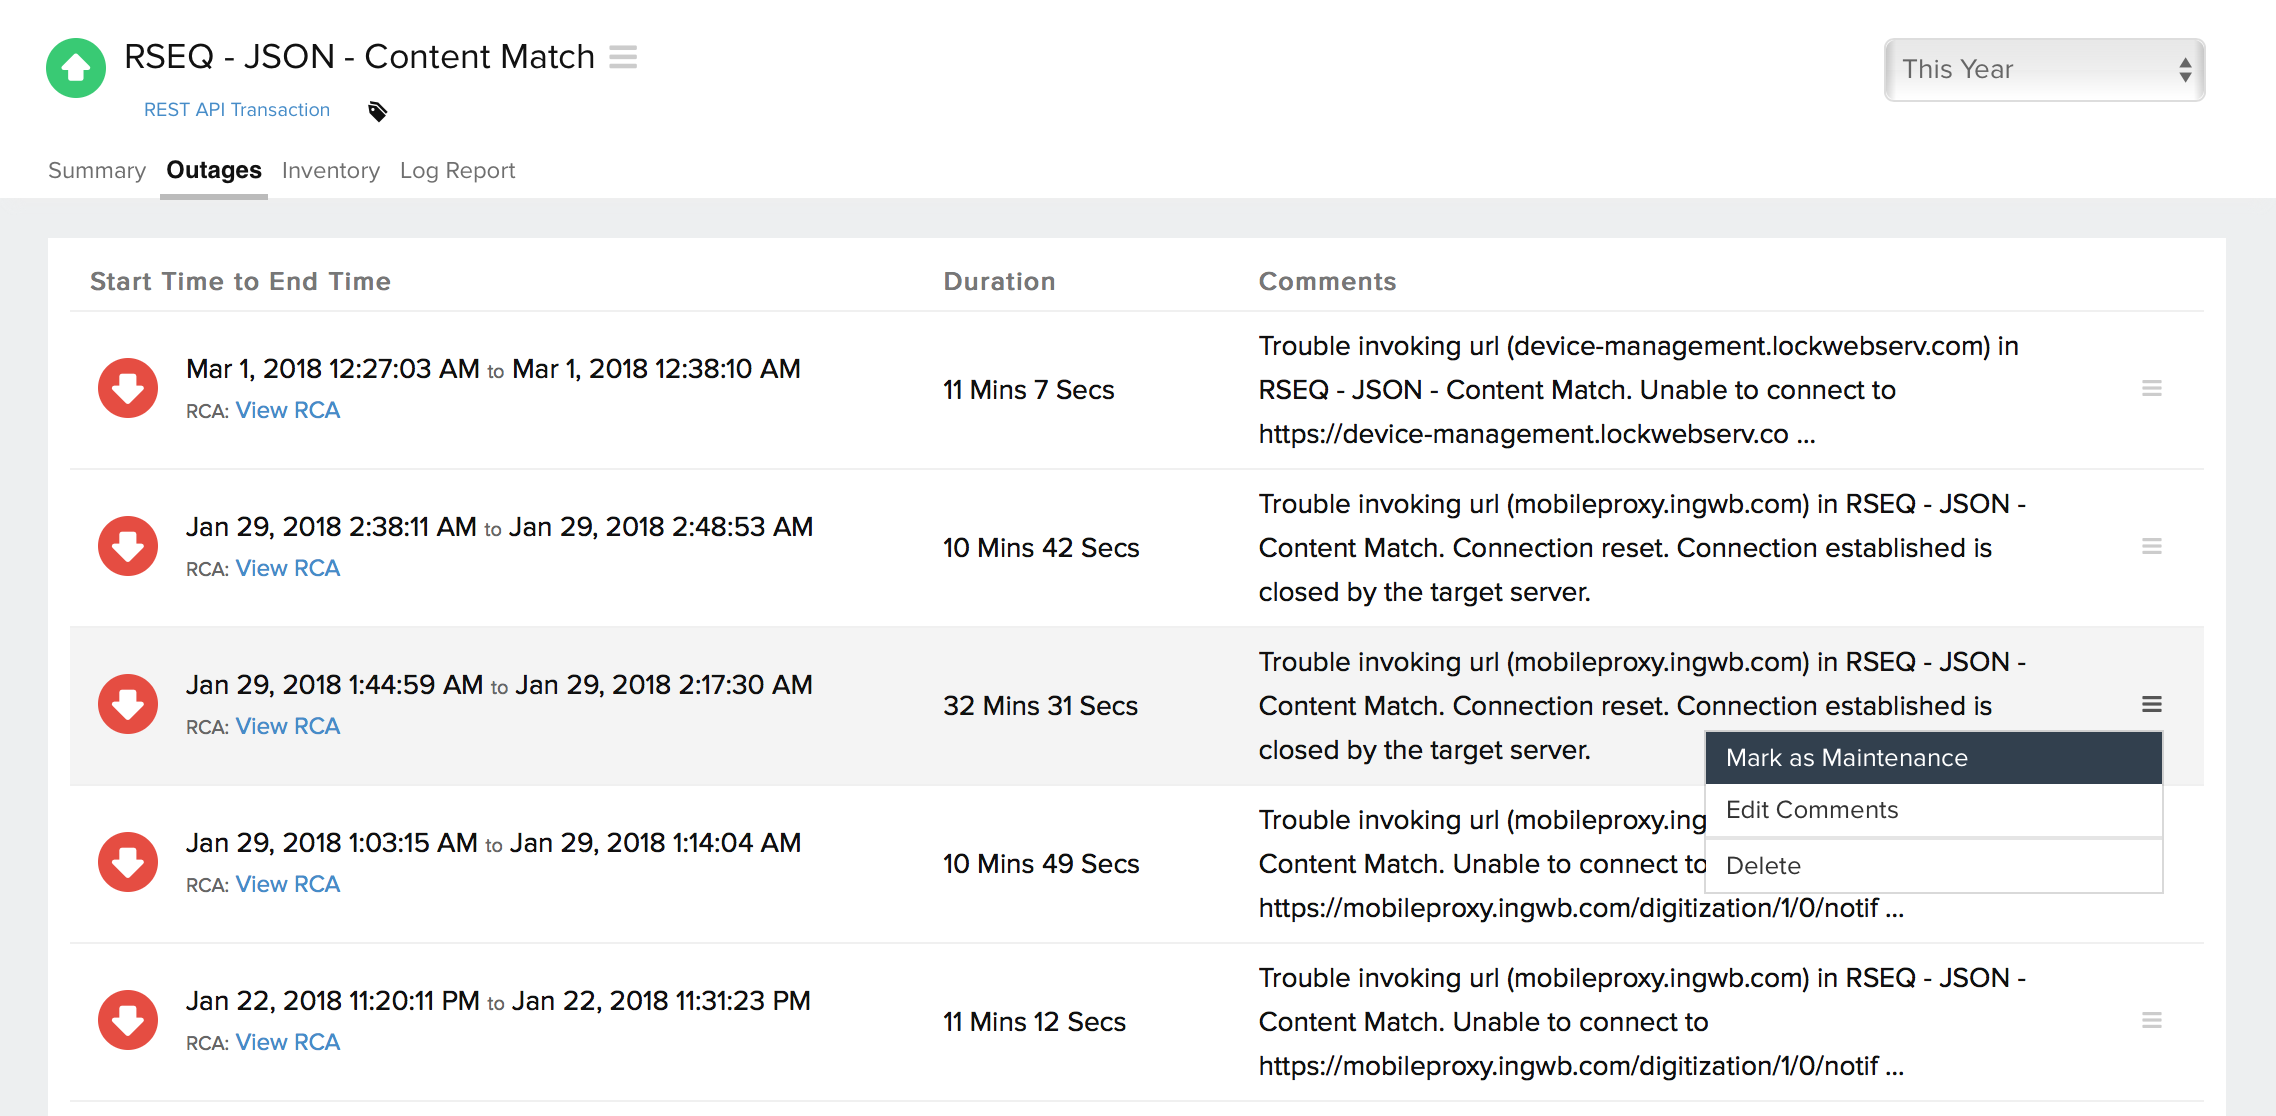
You can access the Outages tab in your monitor's details page to gather detailed insights on the various outage and maintenance downtimes. It provides you with sufficient information to troubleshoot issues. You'll also be able to access the root cause analysis reports for your various outages. On accessing the ![]() icon of a listed monitor outage or maintenance, you'll be shown the options to:
icon of a listed monitor outage or maintenance, you'll be shown the options to:
- Mark as Maintenance: Mark an outage as Maintenance
- Mark as Downtime: Mark a Maintenance as Downtime
- Edit Comments: Add/Edit Comments
- Delete: Delete an Outage/Maintenance permanently
Root Cause Analysis (RCA) report
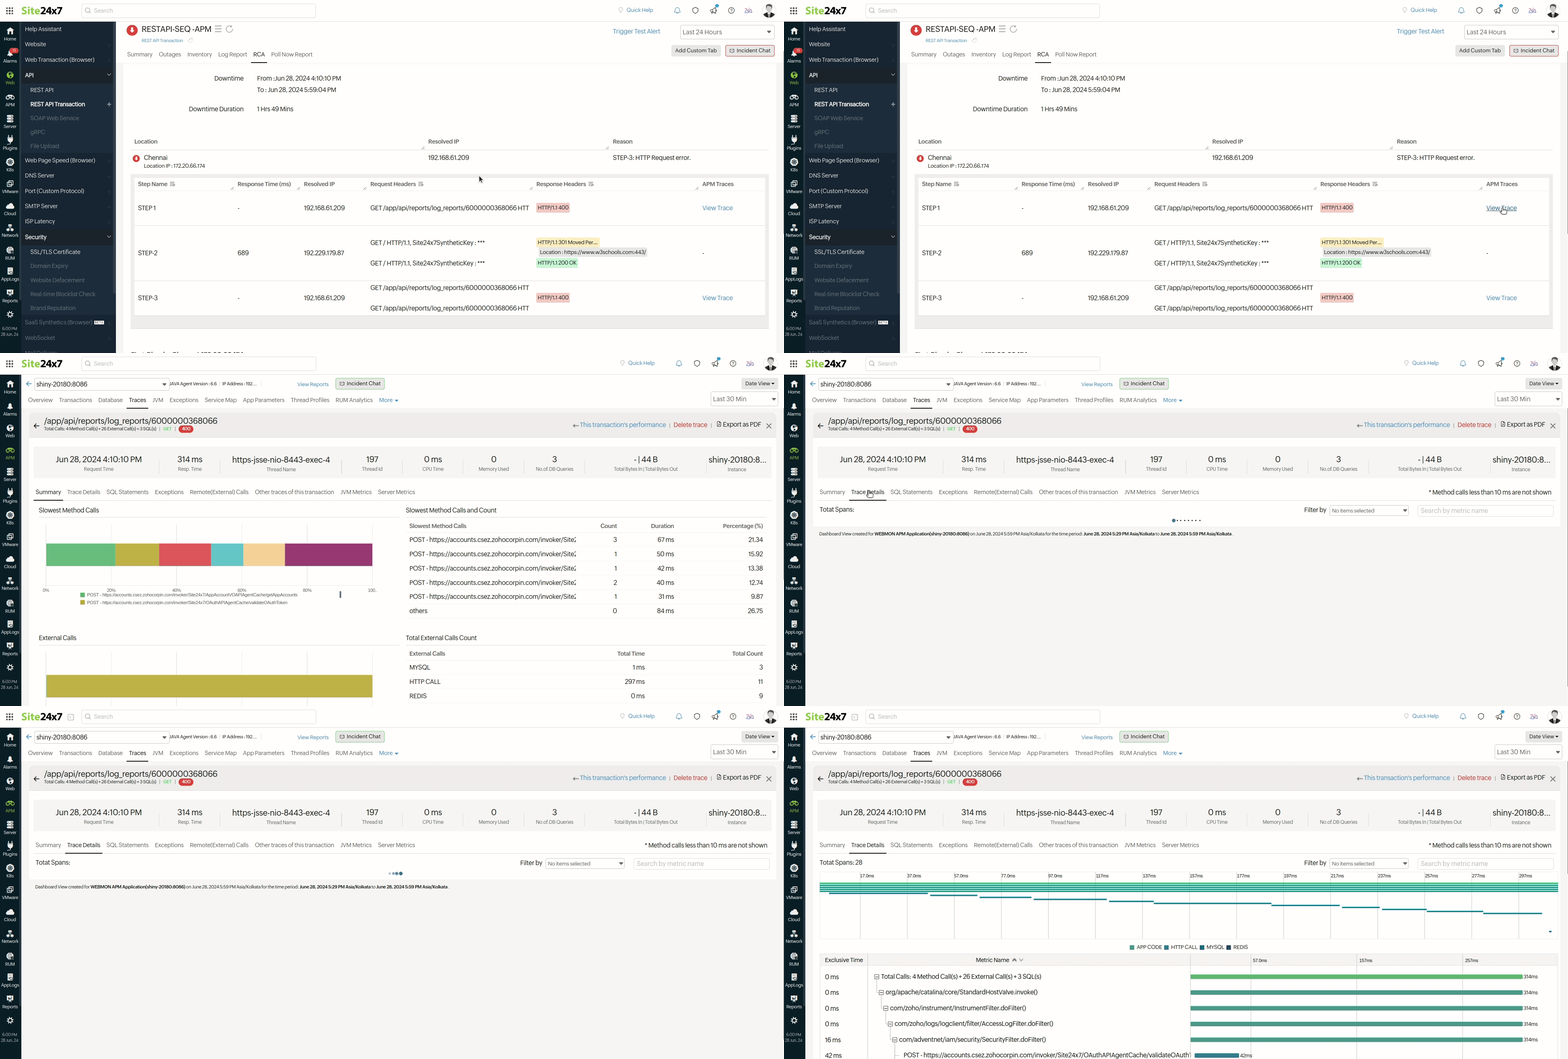
You can retrieve indepth root cause analysis report for your DOWN and TROUBLE monitors after 150 seconds of the monitor reporting the outage. RCA Report gives basic details about your monitor, outage details, recheck details and reasons for the outage. Root Cause Analysis automatically generates a plethora of information to arrive at a definite conclusion as to what triggered a downtime. RCA intends to determine the root cause of specific downtime or performance issue. A normal RCA report will comprise of the following details:
- Checks from Primary location and re-checks from Secondary location.
- Ping Analysis
- DNS Analysis
- TCP Traceroute
- MTR Report
- MTR based Network Route
- APM Traces
- Conclusion
To generate RCA report for rest API transaction monitors:
- Log in to Site24x7.
- Navigate to Home > Monitors > Rest API Transaction.
- In the Rest API Transaction details page click on Outages tab and then on the View RCA link.
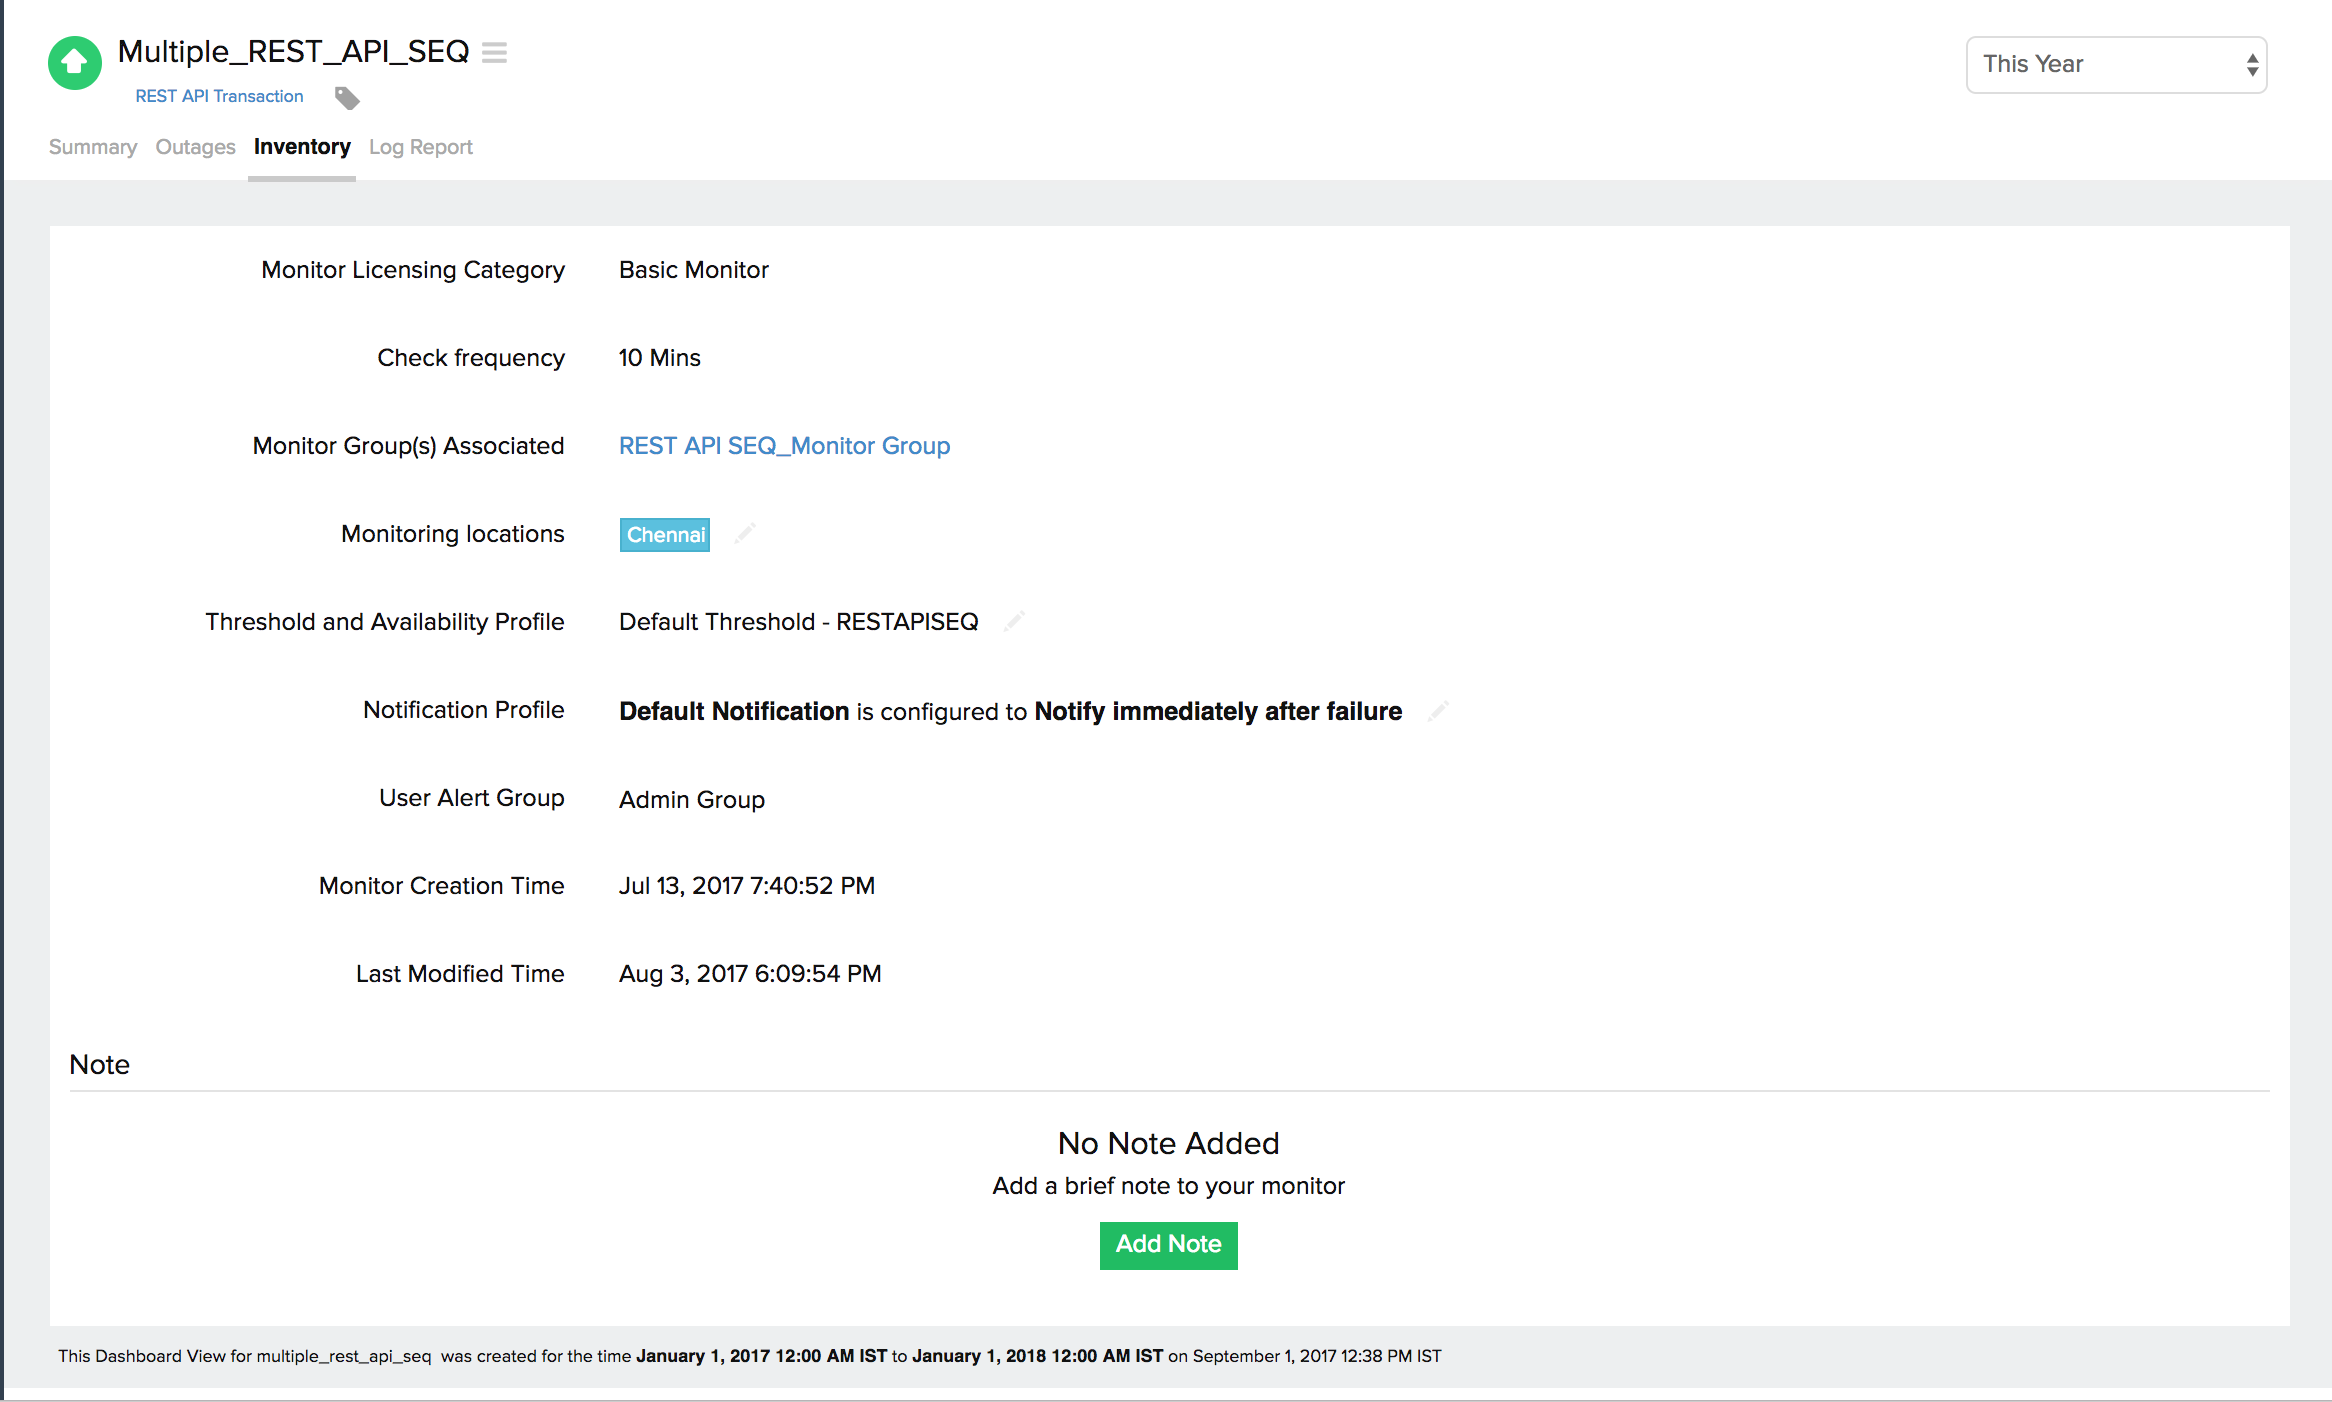
Inventory and Notes
This section captures the basic monitor information and its various configuration settings, including poll locations, poll interval, license type, and more. You can additionally add specific notes in markdown syntax to share important comments with your teams.
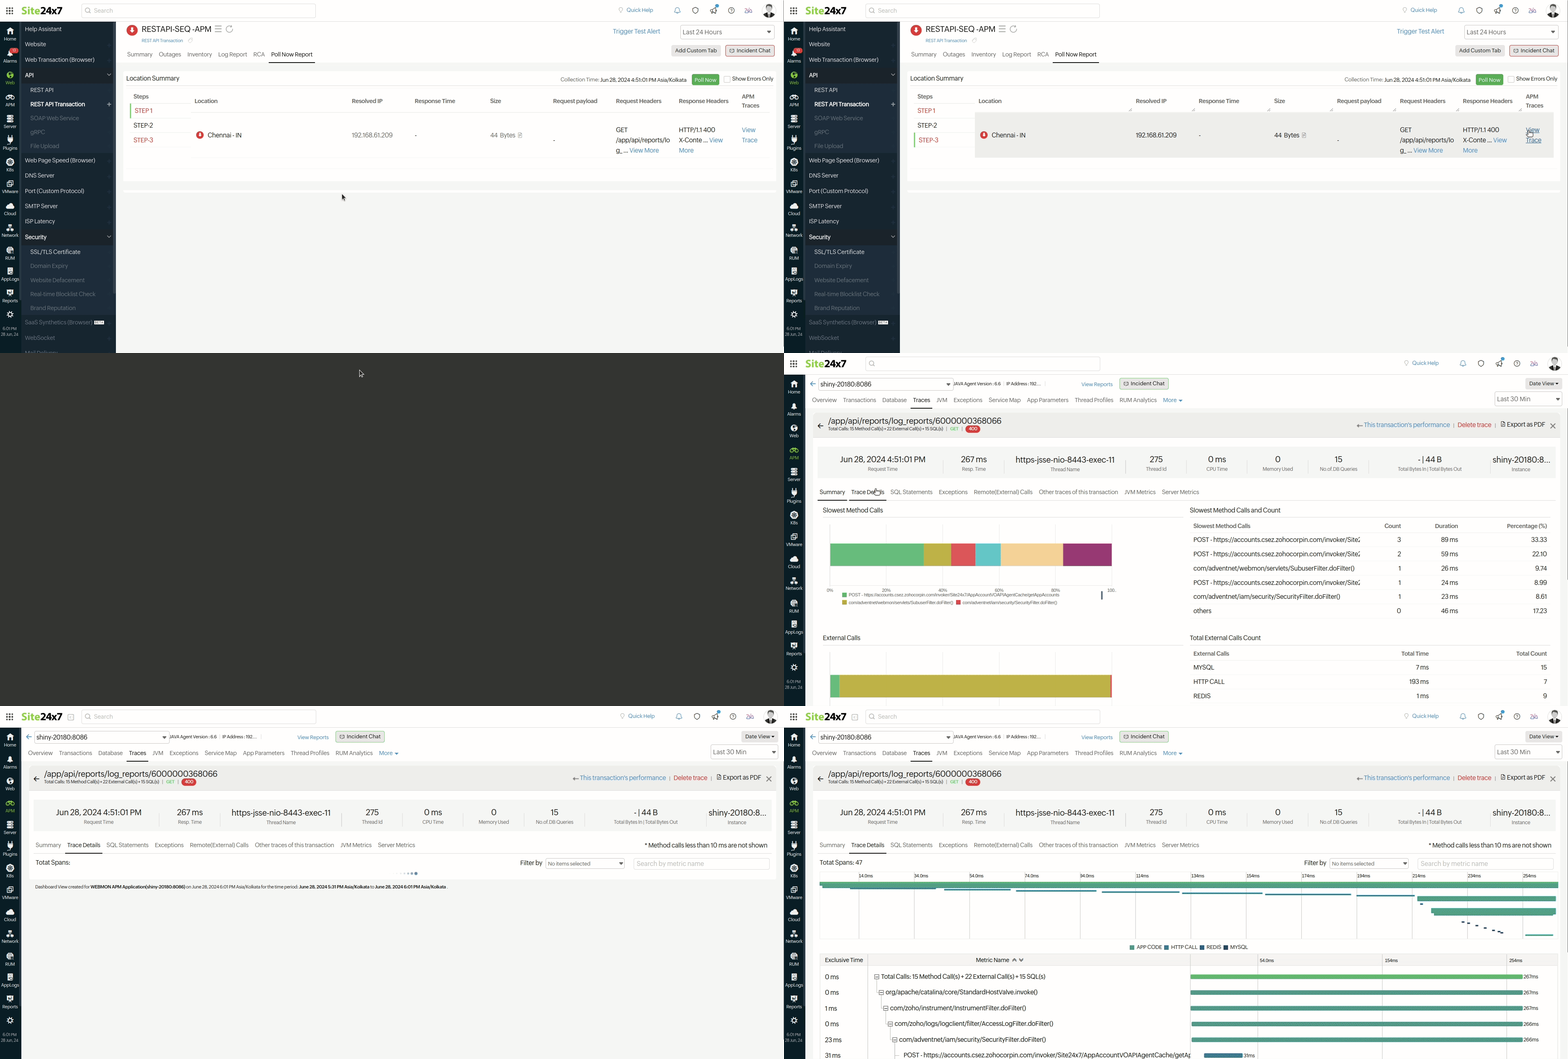
Poll Now Report
You can initiate a Poll Now from the Details page to generate the Poll Now report. The report includes specifics like SSL/TLS protocol version details, and other Cipher suite details like Key Exchange, Bulk Encryption, and Hash Function. You can also gain more information on request and response headers, response content, cURL Report, and Traceroute output information from all your monitoring locations. Poll Now report is valid for a day from the time you initiate a manual poll.
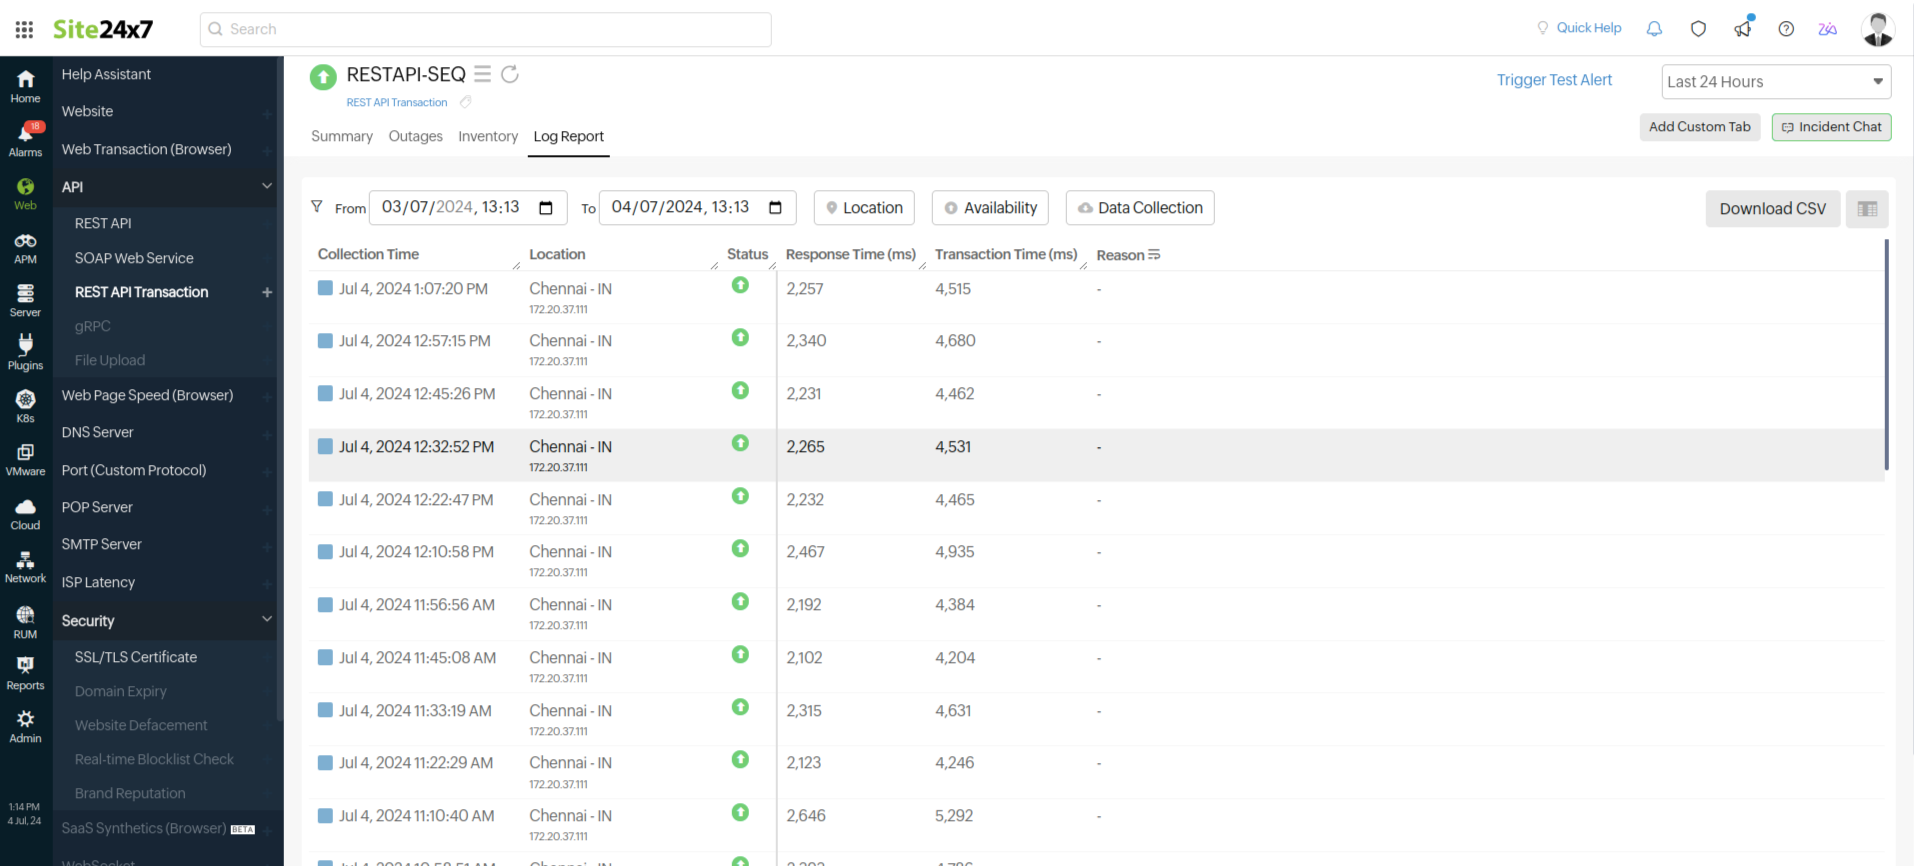
Log Report
With our integrated log records for individual monitors, you can get an indepth knowledge about the various log details for the configured monitor, over a custom period. You can also filter the log based on location and availability. Various data including availability status, HTTP status codes, DNS response time etc. are captured here. You can also export the log report in CSV format.
Learn more: How to set up a REST API Transaction monitor?
Read more about Site24x7 REST API monitoring tool.
