Site24x7 Control Panel
Here’s a quick overview of the standard icons, buttons, features, and functionalities available in the Site24x7 Control Panel (web client). Familiarize yourself with the user interface, icons, and controls.
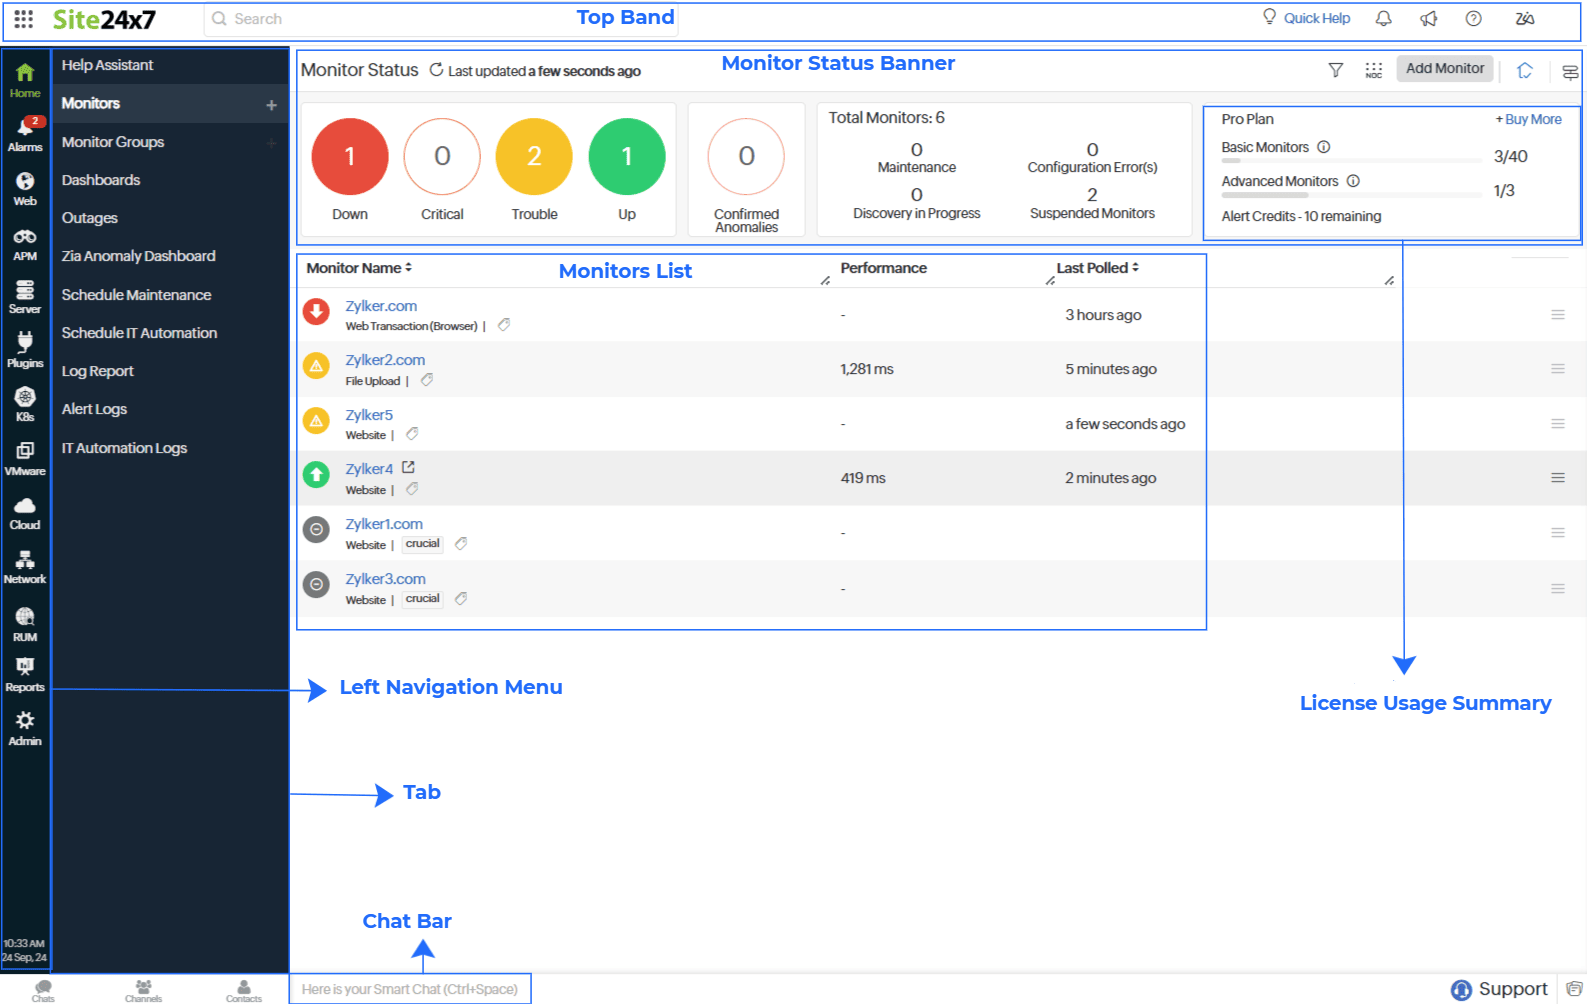
Left navigation menu
To simplify access and management, the left navigation menu groups tabs by layers of the IT stack—such as applications (APM), infrastructure (server and network monitoring), and cloud (AWS and Azure) along with Alarms, administrative actions (Admin), and reporting (Reports). Customize the left navigation menu by clicking the blinking Edit button at the bottom, which enables you to choose which tabs to show or hide based on your preferences.
- Other icons in the left navigation menu are:
- Click on any individual icon to view its relevant tabs, which will take you to the corresponding dashboard or enable you to execute your intended operation within the client.
- At the bottom of the menu, view the current time as per your time zone configurations. Click the Time to modify time zone settings.
Top band
The elements in the top band of the Site24x7 web client include:
| Control panel options | Functionalities |
|
Dynamic Favicon Unread notifications Read notifications |
The Site24x7 favicon is in red and green when you have some unread notifications in the Alert Notification badge. However, once you mark the notifications badge as read, the favicon turns green. |
| Product Switcher |
Hover your mouse over the Product Switcher icon and see that it has changed to the |
| Full Screen |
Hover your mouse next to the Site24x7 logo to see a blinking Full Screen mode icon that lets you show or hide the left navigation menu. |
| Search Bar |
Search for resources via one of the following formats: Quick search: Search with resource name or associated tags. Query-based search: Drill down search results with supported queries. Command-based search: Use the /command to search the Alarms tab, NOC View, Admin tab and to add monitors. |
| Quick Help |
Provides insight about hidden details on the current page and provides access to help documents and knowledge bases essential for completing your tasks. |
| Alert Notification Badge |
View all the recent notifications and the number of unread notifications displayed as a red dot near the icon. Click See All Notifications to view the recent 100 notifications. If you click the Mark All as Read option, the red number on the bell icon disappears, indicating that all the notifications have been read. Configure Browser Push Notifications to get notified about the message on the browser of your choice, even if you are working with Site24x7 control panel in a different browser. You can further analyze the infrastructure events by clicking Go to Infrastructure Events. |
| Announcements |
Displays the new product announcements from Site24x7. |
| Help & Support |
Learn more about Site24x7 through various resources like help docs, knowledge base articles, videos, and what's new webpages. Additionally, you can also request product demos, access the customer self-service portal, or contact customer support. |
| Zia Bot |
Chat with the Zia bot, the AI-based assistant, to learn more about the features and usage of Site24x7. Also, gain insights on outages, alarms, logs, and reports. |
| User Profile |
|
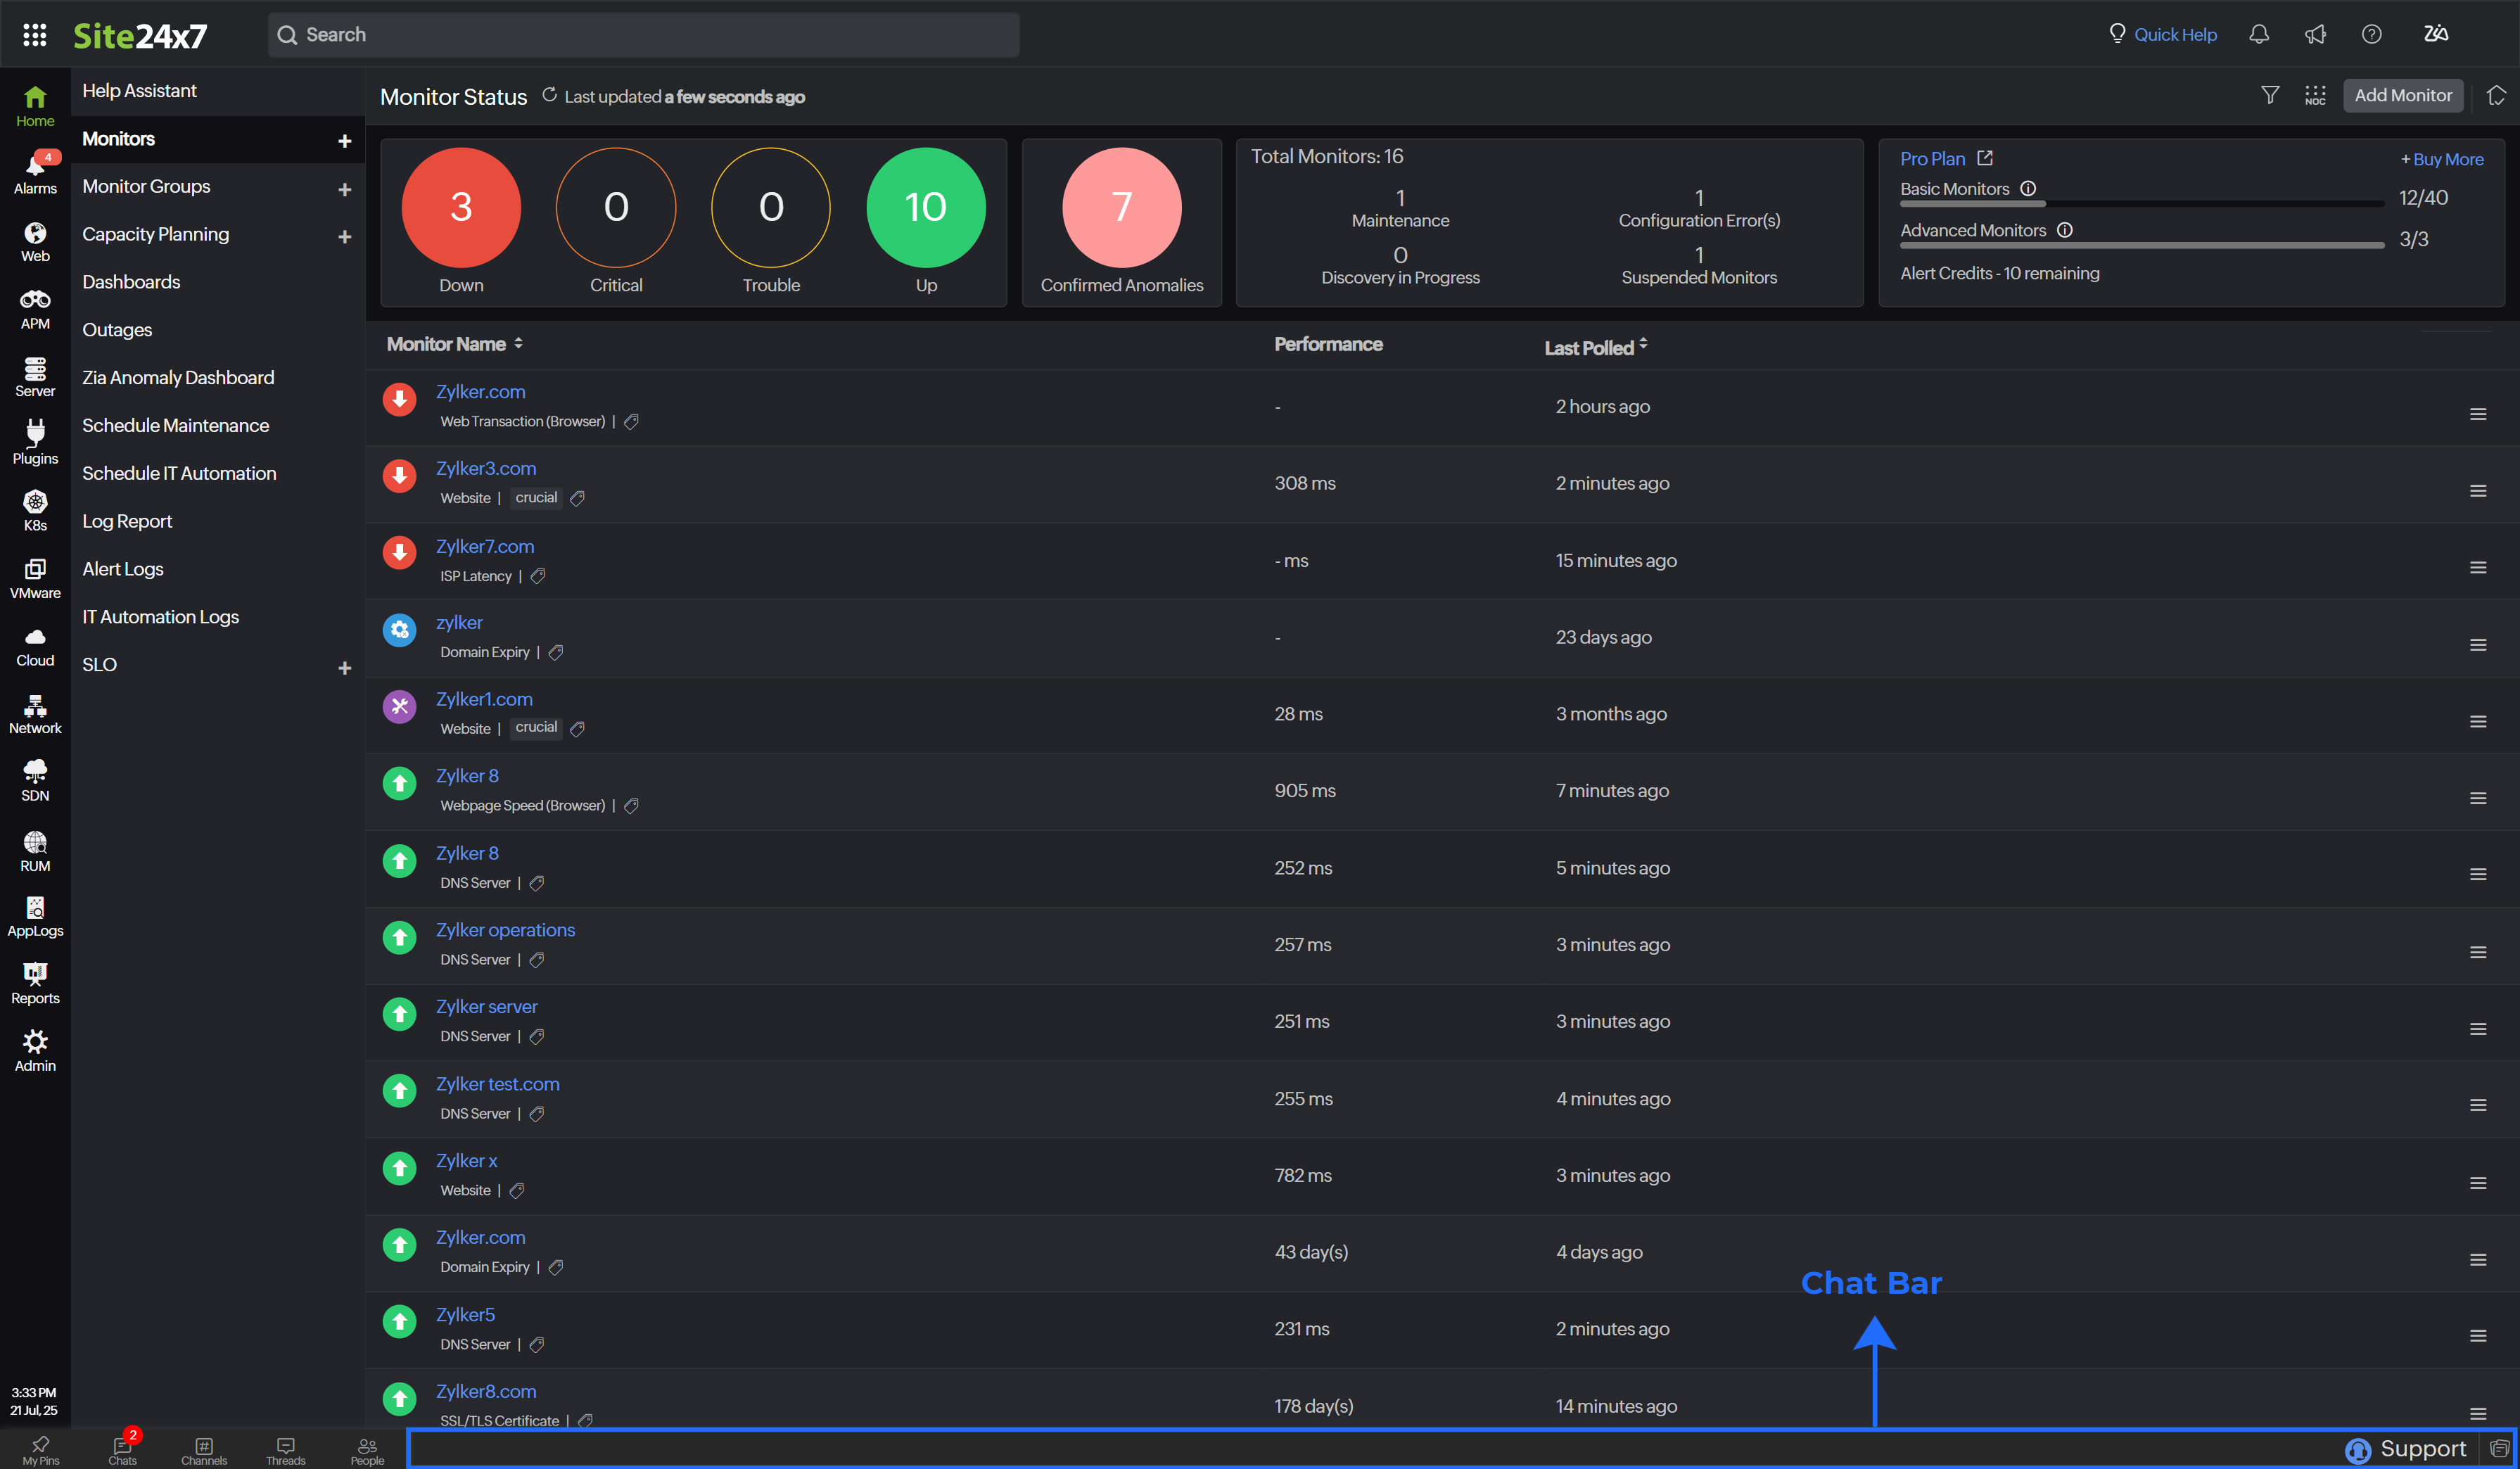
Live Monitor Status banner
The status of the monitors is defined in the following ways:
| Status | Explanation |
| Up |
When the resource is available and running. |
| Trouble |
When there is an abnormal behaviors in the resources as per the configuration in the threshold. |
| Critical |
When the resource has significantly crossed the threshold. |
| Down |
When the resource is not available. |
| Confirmed Anomaly | When the Zia detects an unusual surge or spike in resource behavior. Click the confirmed anomaly monitors to view the Zia Anomaly Dashboard. |
| Scheduled Maintenance |
When a monitor undergoes scheduled maintenance for better availability. |
| Suspended |
When a monitor is suspended and no longer monitored. |
| Configuration Error(s) |
When there are any installation errors. |
| Discovery in Progress |
Before the first poll after initial installation. |
Clicking on any one of the statuses above lets you filter the monitors based on that status.
In the License Usage Summary section, you can see the number of monitors purchased, the number of monitors used, and the +Buy More button through which you can purchase more monitors.
| Control panel options | Functionality |
| Monitor Status | Dynamically know your monitors' status as the status is automatically refreshed for every five minutes, or you can refresh it using the |
| Filter |
Filter your monitors based on Tags or Monitor Group names using the Filter icon. |
| NOC |
Displays a color-coded tile view of all your monitors with their live status. You can filter the monitors based on their status. |
| Add Monitor | Click Add Monitor to add new monitors. View the list of monitor types available, select the desired monitor type, and navigate to the add monitor form of that corresponding monitor. |
| Landing Page |
Keep your desired Site24x7 page as the landing page. Once you choose your desired page, it will become your landing page from the next time you login to Site24x7. |
Monitor list
View the list of monitors you have configured, their status, performance, and their last polled details.
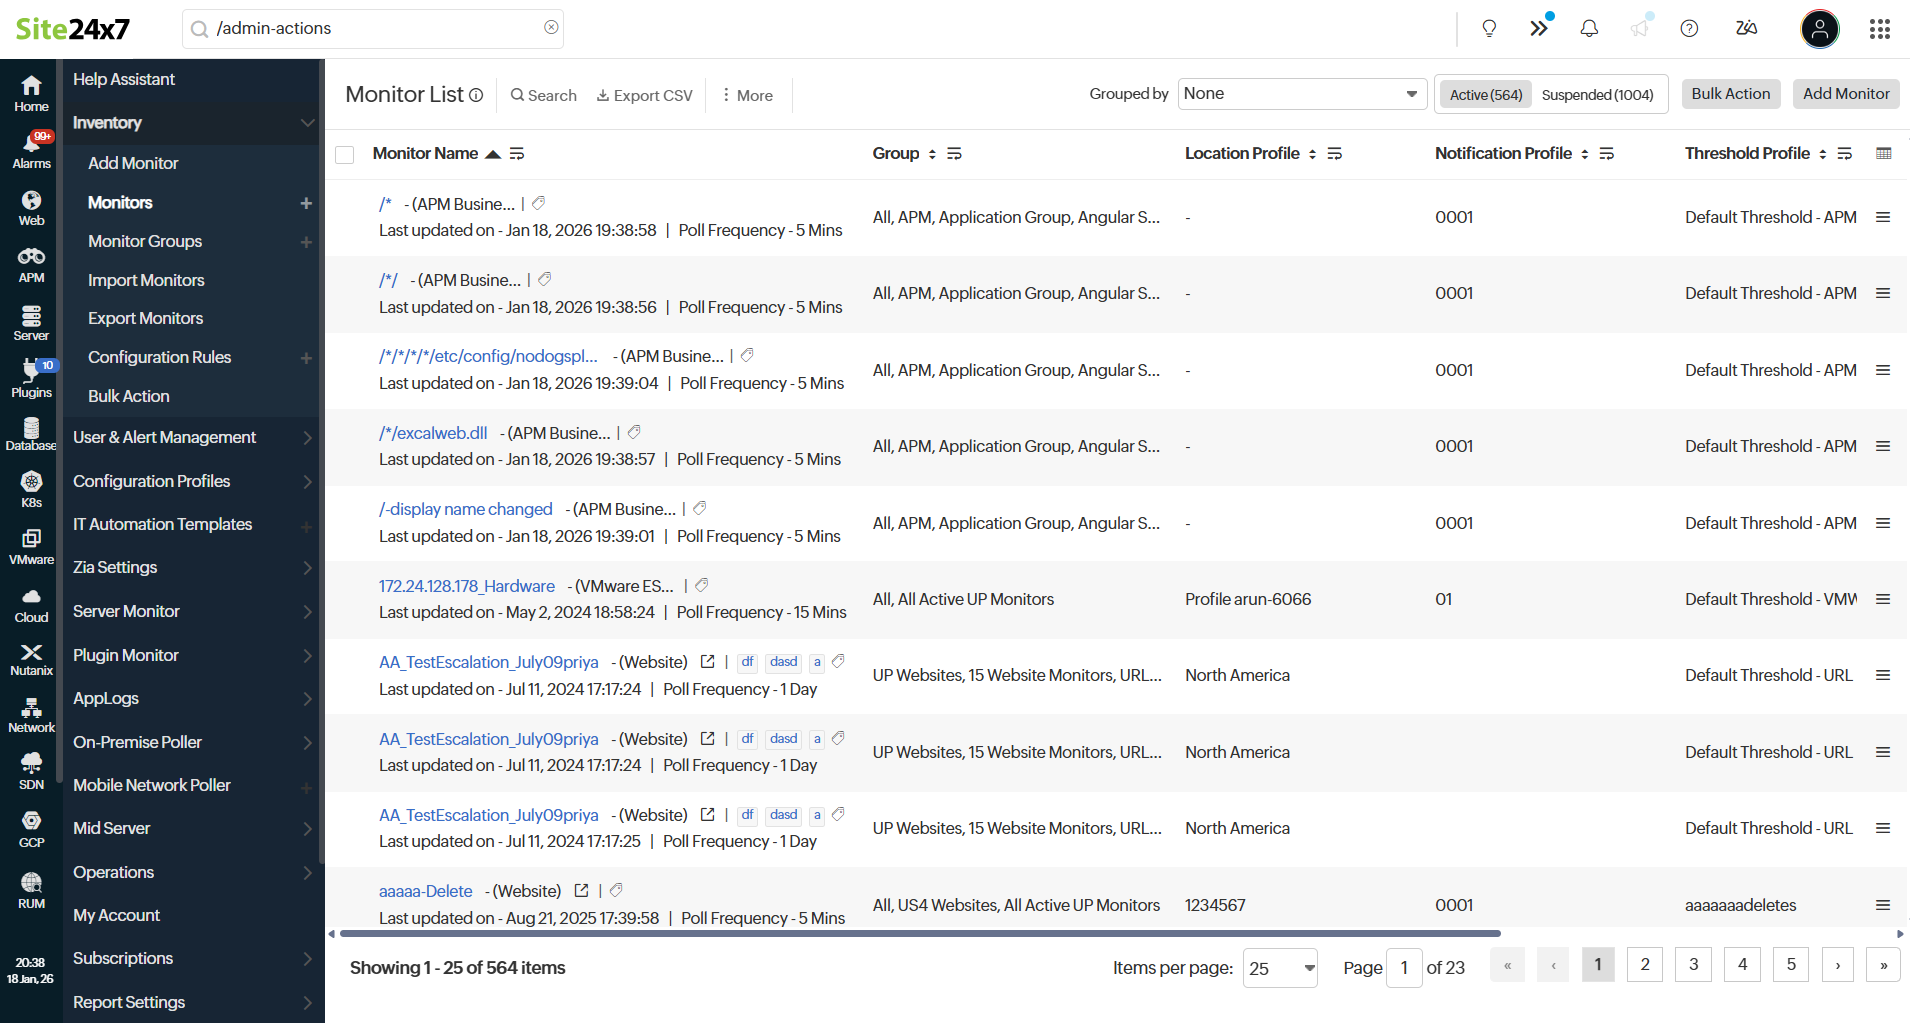
The monitor shows all your monitors and their data. With each monitor, there is a hamburger ![]() that enables you to edit, add the particular monitor to any monitor group, activate, or delete it.
that enables you to edit, add the particular monitor to any monitor group, activate, or delete it.
View the monitors in two other formats:
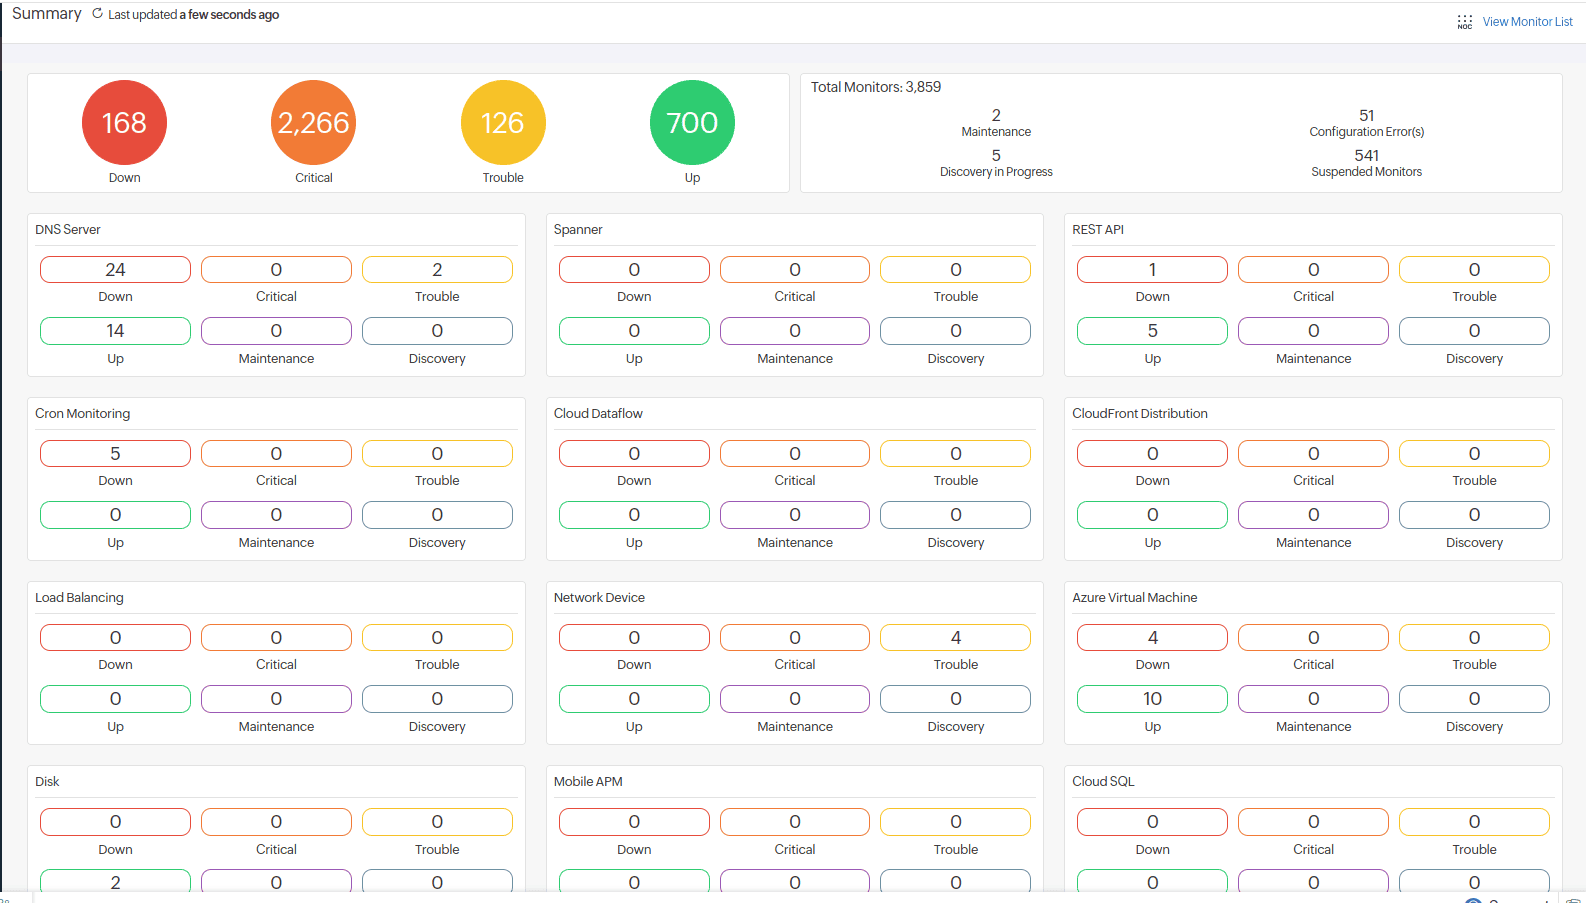
- Summary view
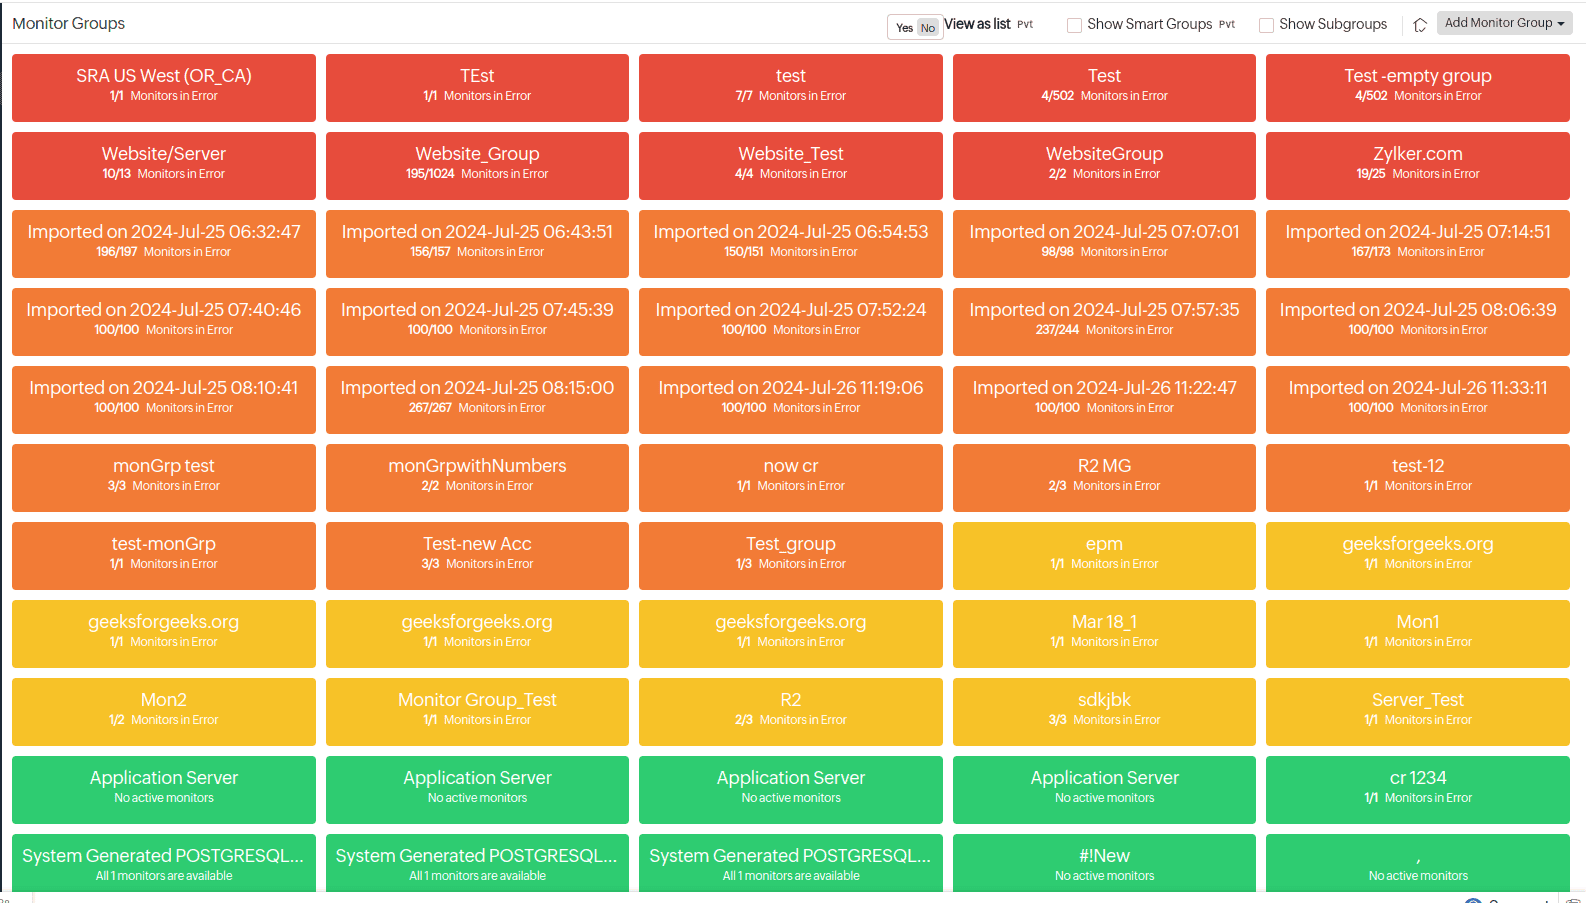
- Monitor Group view
Obtain the summary and status of all monitors or monitor types by default if your account has more than 3,000 monitors. Click the View Monitor List link at the top-right corner of the control panel to view the complete monitor list.
Organize your resources into Monitor groups based on business applications, geography, type, or resource ownership to manage them efficiently.
Chat bar
Connect with the Site24x7 team using Smart Chat and Support in the chat bar.
| Control panel options | Functionality |
| Smart Chat | The smart chat enables clients to interact with users within the organization regarding any quick inquiry or discuss any anomaly. |
| Support |
Raise a ticket about any concern with your monitors. Click the Support icon and fill out the form to update the ticket details. |
| Zoho Notebook |
Take auxiliary notes. |
To disable the chat bar:
- Navigate to Admin > Control Panel Settings.
- Disable the Activate incident chat option.
Landing Page
Landing Page is the first page that appears when you log in to your Site24x7 account. If you want a specific page to be your landing page,
- Check if the landing page icon is present in the top right corner.
- If it is there, click on it, and you will see the following pop-up message:
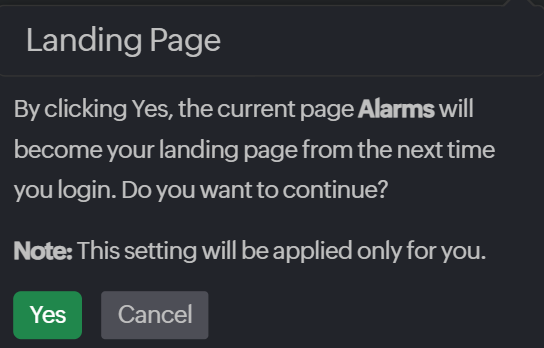
- Click Yes to configure the current page as the landing page. Or click Cancel.
Landing Page supported pages in Site24x7 are:
- All Monitors Status
- APM Insight Applications
- Server Monitors Status
- Network Devices Status
- Network inventory Dashboard
- VMware Resources Status
- RUM Applications Status
- Internet Service Monitors Status
- Monitor Group Status
- NOC View
- Alarms
- Individual Custom dashboard
- Individual Monitor Group