Amazon S3 Monitoring
Amazon S3 provides a reliable cloud storage platform to store and retrieve objects at any scale.
With Site24x7's S3 integration you can collect S3 logs, service level storage and request metrics on an individual bucket level. You can also, run periodic checks on critical S3 objects from global locations to monitor functionality and response time.
Setup and configuration
- If you haven't already, enable site24x7 access to your AWS account via key based or IAM role base authentication
- In the Integrate AWS Account page, select the S3 checkbox under the Services to be discovered field.
Policies and permissions
Site24x7 requires the following permissions to discover and monitor your S3 buckets. Learn more.
- "s3:GetObjectAcl",
- "s3:GetEncryptionConfiguration",
- "s3:GetLifecycleConfiguration",
- "s3:GetBucketTagging",
- "s3:ListAllMyBuckets",
- "s3:GetBucketVersioning",
- "s3:GetBucketAcl",
- "s3:GetBucketLocation",
- "s3:GetBucketPolicy",
- "s3:GetReplicationConfiguration",
- "s3:GetBucketLogging"
- "s3:GetObjectAcl",
- "s3:ListBucket",
- "s3:GetBucketLocation"
Polling frequency
Storage metrics are collected on a day to day basis. Request and data transfer metrics are collected as per the poll frequency set (1 minute to a day). Learn more.
Security findings
Fortify your Amazon S3 instances against cyber attacks by integrating Amazon GuardDuty and S3 in a single console. GuardDuty findings for Amazon S3 can be grouped according to its severity level. The group by feature lets you sort the severity categories and lists the corresponding Rules Package Name and Comments if any.
In addition to adding these threshold configurations for your monitored S3 instances, you can also choose to set thresholds and get notified for:
- Security findings based on the severity level like high, low, medium, informational, or total count under the GuardDuty threshold configuration.
- Accelerator configurations like GPU memory utilization, accelerator memory usage, and accelerator utilization.
Supported performance metrics
Storage metrics
| Attribute | Description | Statistics | Data type |
|---|---|---|---|
| Bucket Size | Measures the amount of data stored in the bucket for all storage classes, except Amazon Glacier. | Average | Bytes |
| Number of Objects | Measures the number of objects stored in the bucket for all storage classes, except Amazon Glacier. | Average | Count |
Request metrics
Enable request metrics for your S3 buckets, using the Amazon S3 management console to monitor operations on your objects and buckets.
| Attribute | Description | Statistics | Data type |
|---|---|---|---|
| All Requests | Measures the total number of HTTP requests made to all the objects in a S3 bucket, regardless of type. If you are using metrics configuration for your bucket, then this metric only counts HTTP requests for objects meeting the filter criteria. | Sum | Count |
| GET Requests | Measures the total number of HTTP GET requests made for objects in a Amazon S3 bucket. | Sum | Count |
| PUT Requests | Measures the total number of HTTP PUT requests made for objects in a Amazon S3 bucket. | Sum | Count |
| Delete Requests | Measures the total number HTTP Delete requests made for objects in an Amazon S3 bucket. Multi object delete operation requests are also taken into account. The number of objects that were deleted are not known, only the number of delete request made for objects is measured. | Sum | Count |
| Head Requests | Measures the total number of HTTP Head requests made to an Amazon S3 bucket. | Sum | Count |
| List Requests | Measures the total number of HTTP List requests made to an Amazon S3 bucket. | Sum | Count |
| Post Requests | Measures the total number of HTTP POST requests made to an Amazon S3 bucket. | Sum | Count |
| Bytes Downloaded | Measures the total number of bytes downloaded for the requests sent to an Amazon S3 bucket. Where the response included a body. | Sum | Bytes |
| Bytes Uploaded | Measures the total number of bytes uploaded for the requests sent to an Amazon S3 bucket. where the request included a body. | Sum | Bytes |
| 4xx Errors | Measures the total number of generated client side errors for requests made to an Amazon S3 bucket. | Sum | Count |
| 5xx Errors | Measures the total number of generated server side errors for requests made to an Amazon S3 bucket. | Sum | Count |
| First Byte Latency | The time between when a S3 bucket receives the complete request body to when a response starts to be returned. | Average | Seconds |
| Total Request Latency | The elapsed per-request time from the first byte received to the last byte sent to an Amazon S3 bucket. | Average | Seconds |
| Select Request | The number of Amazon S3 Select requests made to retrieve specific data from objects using SQL expressions. | Sum | Count |
| Select Bytes Scanned | The total number of bytes scanned by Amazon S3 Select requests when filtering data from objects. | Sum | Bytes |
| Select Bytes Returned | The total number of bytes returned by Amazon S3 Select requests after filtering data from objects. | Sum | Bytes |
| HTTP 4xx Errors Percentage | Indicates the percentage of HTTP requests to the S3 bucket that resulted in 4xx client errors. | Average | Percentage |
| HTTP 5xx Errors Percentage | Indicates the percentage of HTTP requests to the S3 bucket that resulted in 5xx server errors. | Average | Percentage |
Replication metrics
| Attribute | Description | Statistics | Data type |
|---|---|---|---|
| Replication Latency | The maximum number of seconds by which the replication destination Region is behind the source Region for a given replication rule. | Maximum | Seconds |
| Bytes Pending Replication | The total number of bytes of objects pending replication for a given replication rule. | Maximum | MB |
| Operations Pending Replication | The number of operations pending replication for a given replication rule. | Maximum | Count |
| Operations Failed Replication | The number of Amazon S3 replication operations that have failed. | Sum | Count |
Configuration details
The following inventory data is collected for your monitored S3 bucket.
| Attribute | Description |
|---|---|
| Bucket Name | Name of the S3 bucket |
| Creation Time | Date the bucket was created |
| Location of S3 Bucket | The AWS region where the bucket is provisioned |
| Bucket Policy | Bucket policy and user policy assigned to manage access to your S3 bucket |
| Lifecycle Rules | Rules configured for object lifecycle management |
| Storage Class | The type of storage class in use (Standard, IA(Infrequent Access), Glacier or RRS(Reduced Redundancy) |
| Owner | Owner of the bucket |
Threshold Configuration
To configure thresholds for your Site24x7 - S3 Bucket integrated monitor:
- Nnavigate to Admin > Configuration Profiles > Threshold and Availability.
- Click Add Threshold Profile.
- Select S3 Bucket from the Monitor Type drop-down menu, and provide an appropriate name in the Display Name field.
- The supported metrics are displayed in the Threshold Configuration section. You can set threshold values for all the metrics mentioned above and configure to receive notification when the S3 Bucket is public by toggling the Notify when Bucket is Public option to Yes.
- Click Save.
Forecast
Estimate future values of the following performance metrics and make informed decisions about adding capacity or scaling your AWS infrastructure.
- Bucket Size
- Number of Objects
Checking S3 Objects
You can check for the presence of S3 objects at the bucket level and set thresholds for the same. Be notified if the defined object is missing from the S3 bucket.
While entering the value for the object, please make sure to enter the object name along with the prefix.
For example, if the object endpoint is https://s3-region.amazonaws.com/bucket-name/prefix-name/object.txt, provide the value as: prefix-name/object.txt

Amazon S3 Object monitoring
Use Site24x7's prebuilt API monitoring functionality to run periodic checks on S3 object URLs to ensure its functionality. At the configured interval, Site24x7 sends out HTTP requests to the object URL from each of the configured location and validates the result.
Prerequisites
- The Amazon S3 monitoring integration must be enabled.
- The state of the S3 bucket monitor should be active.
Add S3 Object Monitor
This section describes how to discover, add and configure checks for your object API endpoints:
- In the Site24x7 web console, select AWS > Monitored AWS account.
- From the drop down menu, select Add S3 Endpoint.
You can also add an S3 Object by navigating to the S3 Bucket > S3 Objects tab and clicking Add S3 Objects.
Discovering S3 Objects
This sections describes how you can discover specific object URL endpoints from your S3 bucket:
- Choose an S3 bucket from the drop down (multiple selection is not possible.)
- Type the proper Regex to match the object URLs in the selected S3 bucket. Append .* as a suffix or as a prefix to your input string to only opt-in specific object URLs from the selected bucket. For example, you can discover only the objects in a particular path or directory using a Regex pattern like (images/.*) or you can discover objects of a certain type using a Regex pattern like (.png.*).
- Next click on, Discover Objects

Selecting S3 Objects
All the object URLs matching your Regex pattern would get listed below. Here, you can select the endpoints that you wish to monitor by clicking on the checkbox and choosing Add Selected Objects

Configuring S3 Object Monitor
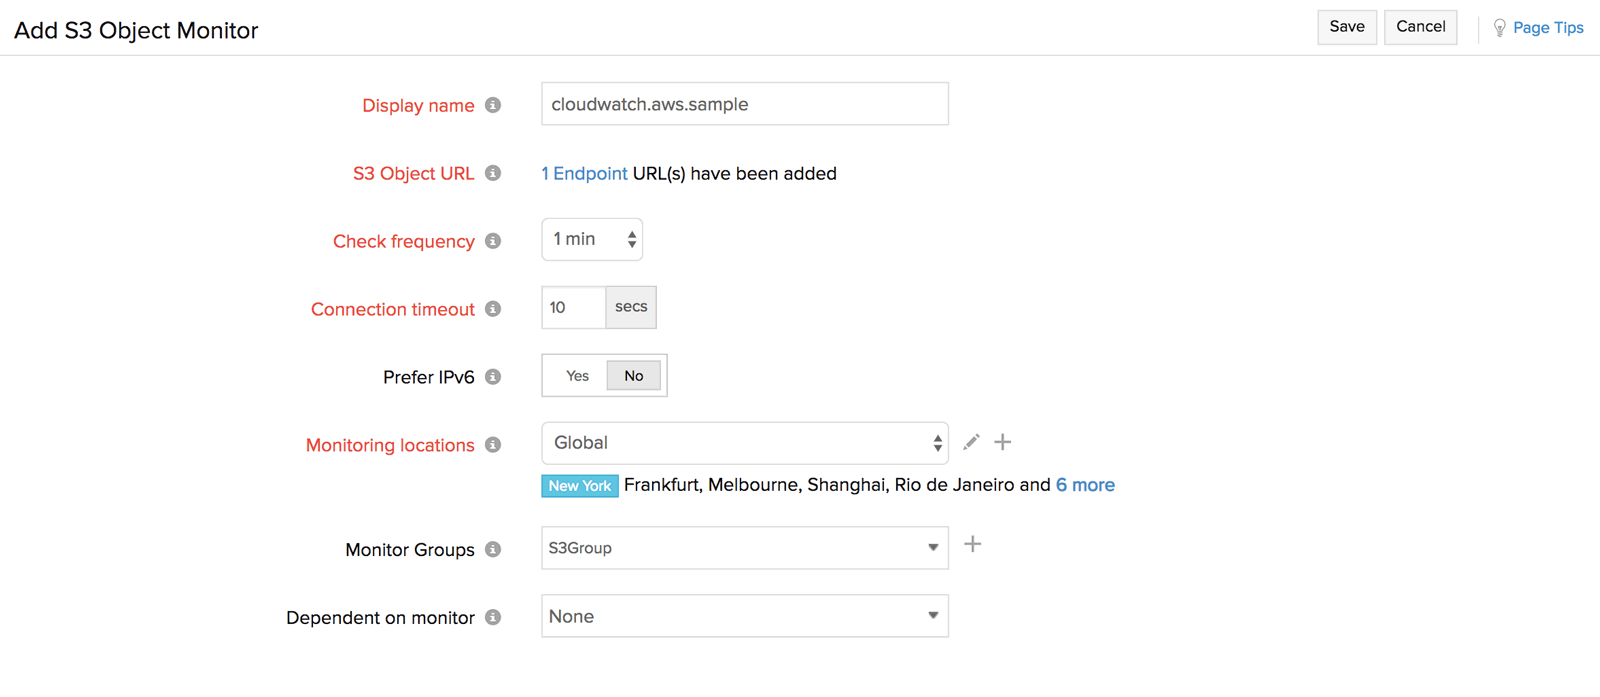
To add the S3 object endpoint monitor, you need to specify values for the checks configuration.
- Display Name: Provide an appropriate name for the check
- S3 Object URL: The selected S3 object endpoint URLs would be listed here. You can remove an endpoint form the list by clicking, deselecting and saving the form.
- Check frequency: Select any option from 1, 5, 10, 20, 25, 30(minutes) or 1, 2 (hours). For example if you choose 1 minute, each selected geographic location would try to reach your endpoint every 1 minute.
- Connection timeout: Specify a connection time between 1-45 seconds. Checks that do not generate a response within the period will be termed as failures.
- Prefer IPv6: If you are monitoring dual stack object endpoints, move the toggle to Yes.
- Monitoring locations: Create a new location profile or select or edit an exiting profile. The endpoint would receive requests from the applicable locations. Learn more .
- Monitor Groups: Logically group your monitors for better management. Create a new monitor group or add the end point monitor to an exiting monitor group by clicking on the
- Dependent on monitor: Alerts to the S3 object monitor will be suppressed based on the DOWN status of your dependent resource.
Specify the following details for HTTP configuration:
- HTTP Method: Specify the HTTP method to be used, you can choose between GET or HEAD
- User Agent: Type in a user agent if you want to emulate a specific browser.

Specify the following details for response validation:
- Should contain string(s): Fill in a string whose presence in the response indicates failure
- Should not contain string(s): Fill in a string whose non presence in the response indicates failure
- Case sensitive: Switch the toggle to Yes if the response is case sensitive
- Should match regular expression: Type in a Regex pattern whose presence in response indicates failure.

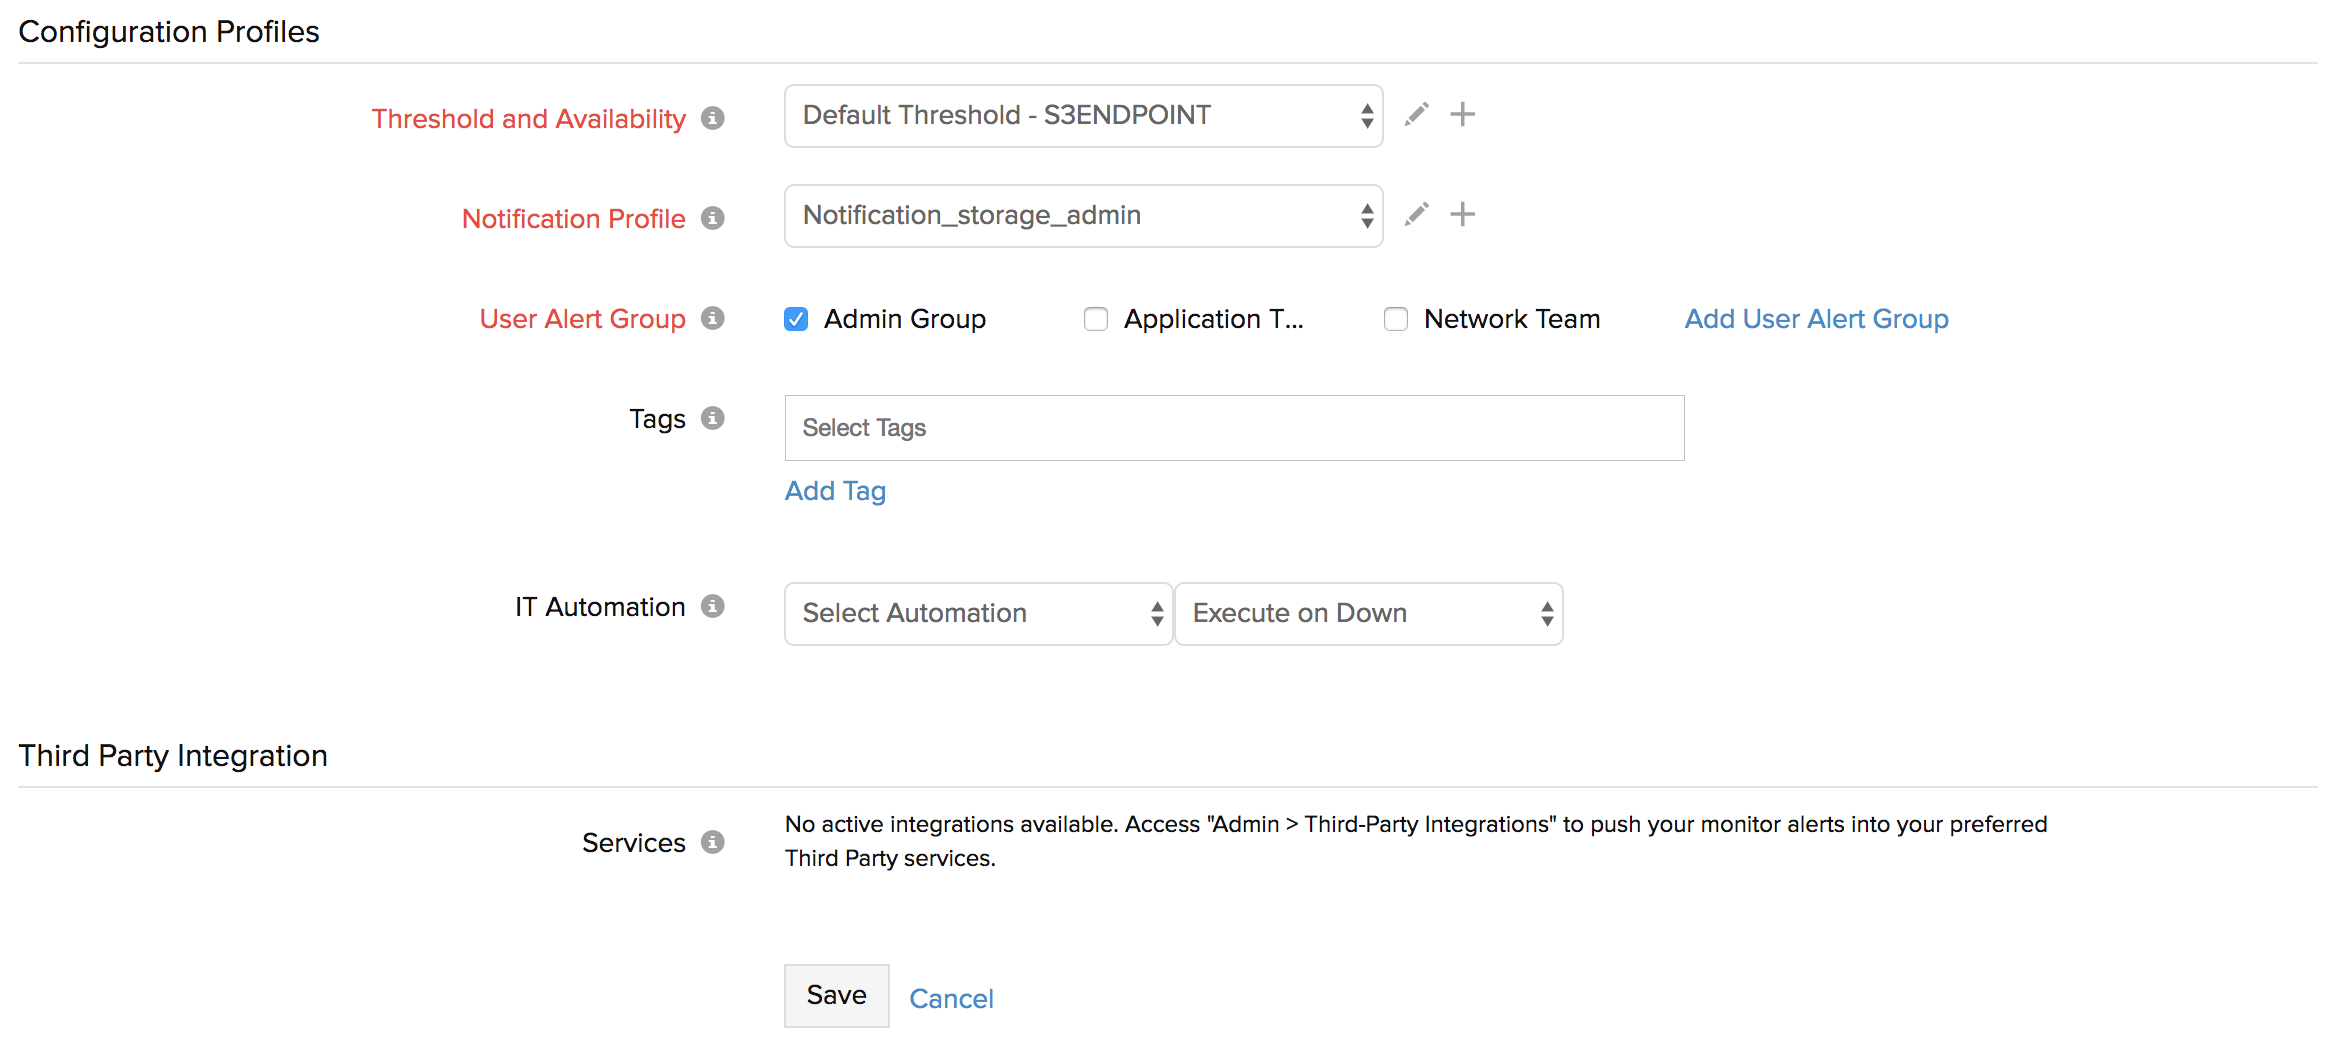
Specify the following details to setup configuration profiles:
- Threshold and Availability: Configure values for each supported attribute and get alerted when the metric data point crosses the value you have defined. You can either create a new threshold profile or select/edit the default threshold profile
- Notification Profile: Configure when and who needs to be notified in case of threshold violation or failure. You can either create a new notification profile or select/edit an existing profile. Refer here to create a customized notification profile.
- User Alert Group: Select the Alert Group. To add multiple users in a group, refer here
- Tags: User-defined key-value pairs associated with the object would get discovered and automatically assigned.
- IT Automation: You can automatically execute operational tasks on AWS resource in response to alert events. You can create an automation profile and associate to the object endpoint monitor and execute it whenever the monitor goes to down/trouble/up/any status change or whenever an attribute value changes relative to a threshold.
- Third Party Integration: You can integrate the monitor with a third-party alerting service to facilitate improved incident management. If you haven't setup any integrations yet, navigate to ”Admin > Third Party Integration” to create one. Learn more.
- Click Save.
Amazon S3 Folder monitoring
Site24x7's Amazon S3 Folder monitoring feature allows you to monitor your S3 virtual folders along with monitoring the S3 bucket.
Prerequisites
- The Amazon S3 bucket monitoring integration must be enabled.
- The state of the S3 bucket monitor should be active.
Why S3 Folder monitoring?
With S3 Folder monitoring, you can:
- Collect storage metrics, object count, and folder count on an individual folder level and folder hierarchy level.
- Collect object modification metrics on an individual folder level.
- Track the metric data every minute up to 24 hours.
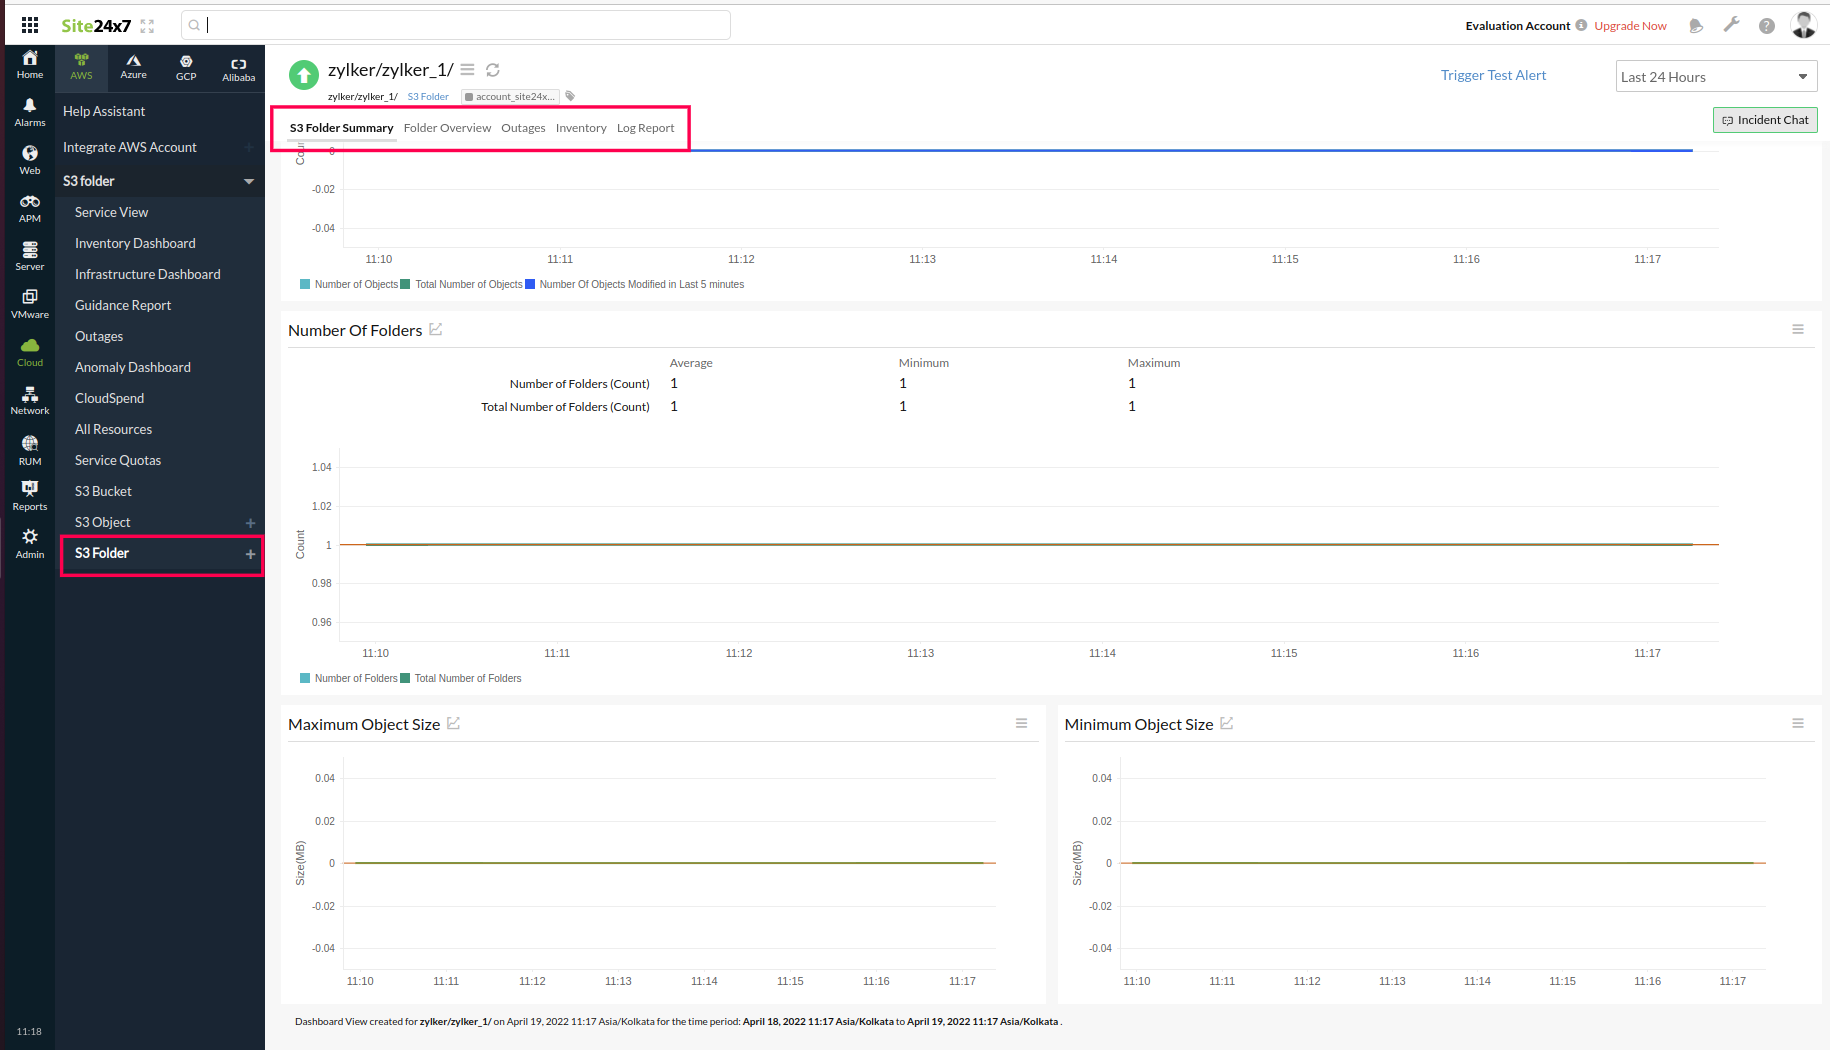
The S3 Folder monitoring includes the following sections:
S3 Folder Summary
This displays the number of objects, number of folders, and object size inside the S3 bucket. This includes the:
-
- Number of objects in the folder and total number of objects in the subfolder.
- Number of objects added or modified basd on the configured polling frequency.
- Number of folders and total number of subfolders.
- Maximum and minimum object size.
The Last Updated Object Details section in the S3 Folder Summary tab provides visibility into the most recent activity within a monitored folder.
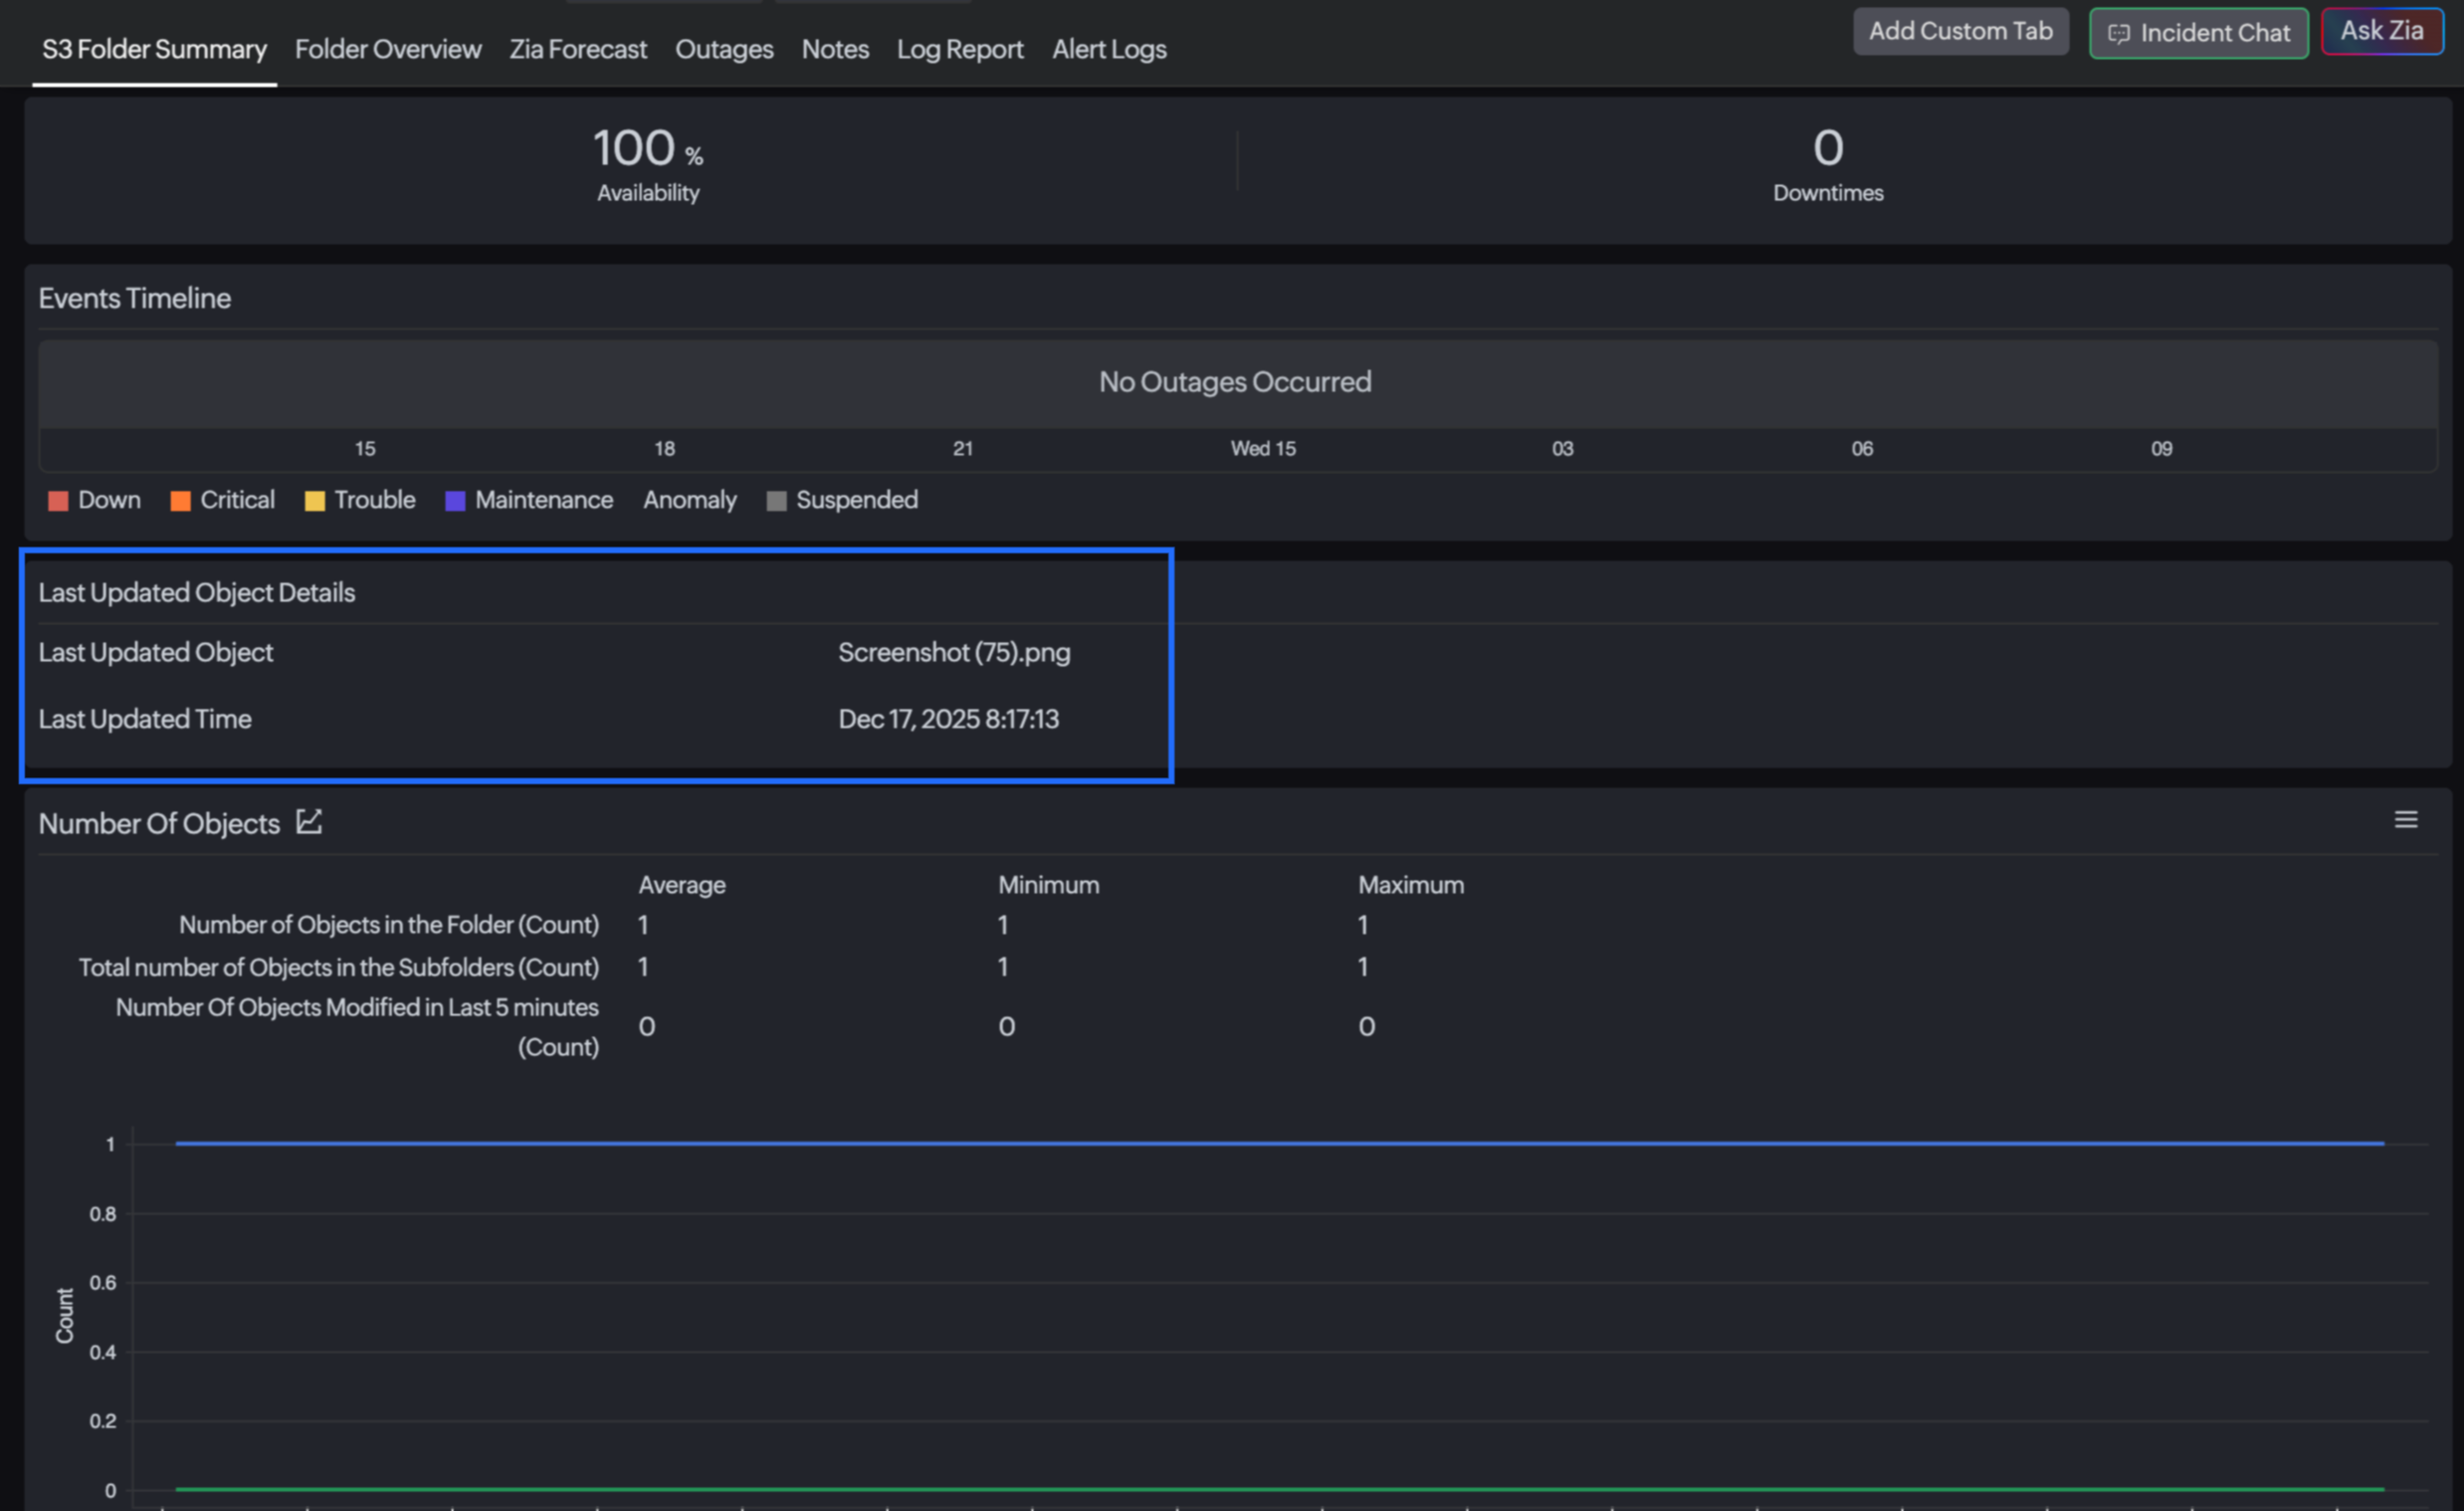
- Last Updated Object: The name of the most recently modified object in the folder.
- Last Updated Time: The exact timestamp when the object was last updated.
This helps you quickly understand whether the folder is actively receiving updates or has remained unchanged over time. It is especially useful for:
- Validating expected data uploads or file generation workflows.
- Detecting delays or inactivity in data pipelines.
- Monitoring time sensitive folders where frequent updates are expected.
For example, if a folder is expected to receive files every few minutes but the last updated time shows a significant delay, it can indicate an upstream issue.
You can configure alert thresholds for the Last Updated Time metric from the threshold profile to detect inactivity or delays. This configuration helps ensure that you are alerted when a folder has not been updated within the expected time window. It is useful for:
- Identifying stalled ingestion pipelines.
- Ensuring periodic file uploads are happening as expected.
- Maintaining data freshness in downstream systems.
Folder Overview
The Folder Overview tab displays the monitor information, such as the bucket name, folder location, and folder name.
Outages
The Outages tab displays the down or trouble history of the folder with details like the start time to end time, duration, reason for the outage, and comments.
Inventory
The Inventory tab displays the inventory data of the folder.
Log Report
The Log Report tab displays log details, like the collection time, status, number of objects in the folder, total number of objects in the subfolders, number of folders, total number of subfolders, and number of objects added or modified based on the configured polling frequency. Select the required period and filter the log report by location or availability. Click Download CSV to get the report as a CSV file.
Discovering and adding S3 Folder Monitors
This section describes how to discover and add S3 folder monitors.
- In the Site24x7 web console, go to Cloud > AWS > Monitored AWS account.
- Click the + icon next to the S3 Folder tab.
- In the Add S3 Folder Monitor window, choose your preferred S3 bucket from the Select S3 Bucketdrop-down.
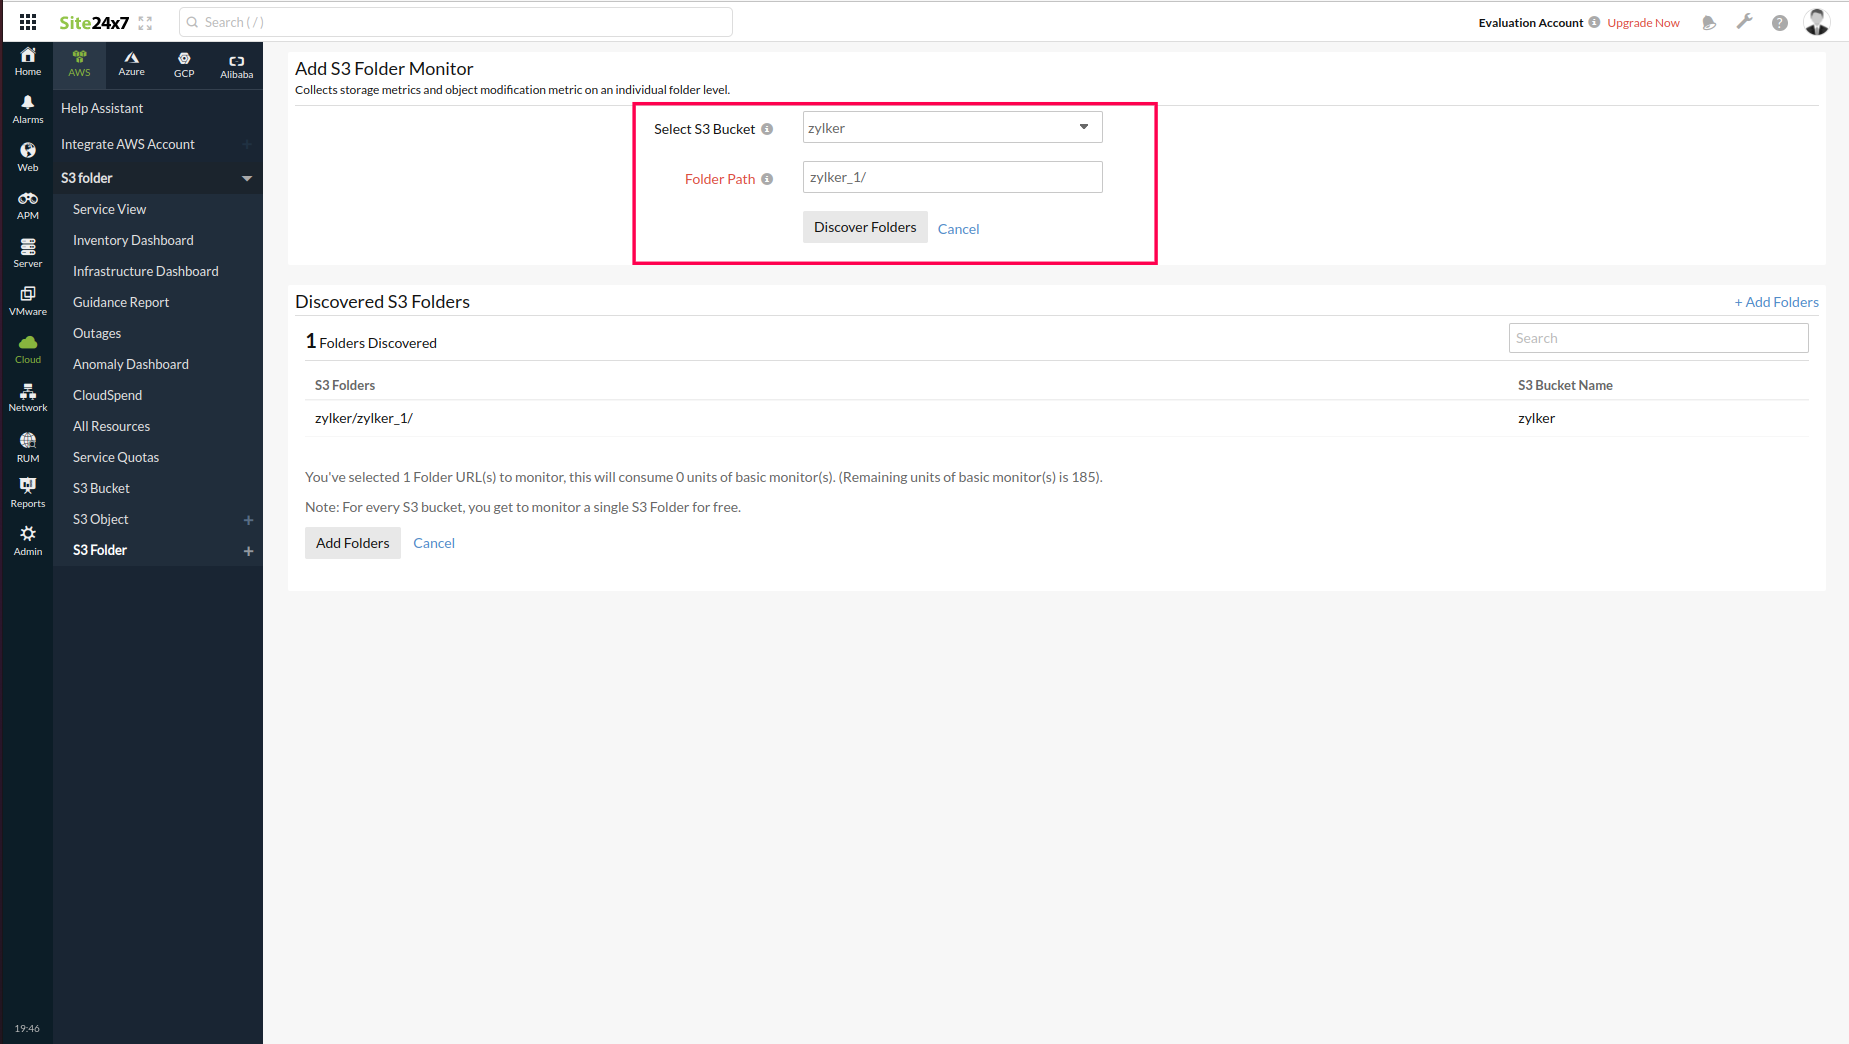
- Enter the required Folder Path to match the folder in the selected S3 bucket. To discover all the folders under the selected S3 bucket, including the subfolders, enter /* in the Folder Path field. To view a particular folder and its subfolders, add /* as a suffix to the parent folder name. For example, consider an S3 bucket with three folders: zylker_1, zylker_2, and zylker_3. Imagine zylker_2 has a subfolder named zylker_a.
- If you wish to view zylker_2 and its subfolder, enter zylker_2/* in the Folder Path field.
- If you wish to view just the zylker_1 folder, enter zylker_1 in the Folder Path field.
- If you wish to view just the zylker_a subfolder of the zylker_2 folder, then enter zylker_2/zylker_a in the Folder Path field.
- Click Discover Folders to view the applicable folders.
- Click Add Folders to add the applicable folders.
- You can also add an S3 Folder by navigating to the S3 Bucket > S3 Folders tab and clicking Add S3 Folders.
- If an S3 Bucket name matches with any of those added by AWS, then folders for these S3 Buckets will not be automatically added. However, you can manually add the folders. In this case, Site24x7 checks if folders exist for an S3 Bucket in the configured polling frequency, but the metrics data will not be collected. Here's the list of the S3 Bucket names added by AWS:
- aws-cloudtrail-logs
- elasticbeanstalk
- aws-logs
- s3.amazonaws.com
- rds-backup
- redshift-
- access-logs
- config-rules
- cross-account-replication
- -cloudformation
- -elasticache|emr-logs
- -glue
- For S3 Buckets that are not added by AWS and those with high-volume folders, the folders will be monitored and the metrics data will be taken once a day.
For each S3 bucket, one S3 folder will be added by default. To auto-discover S3 folders, toggle the Auto Discover S3 Folders to Yes in the Cloud > AWS > S3 Bucket > Edit Monitor Details tab. When you enable the Auto Discover S3 Folders option, the storage metrics and object modification metrics for all the S3 folders and subfolders inside an S3 bucket will be automatically discovered and monitored.
For example, consider an S3 bucket that has three folders: zylker_1, zylker_2, and zylker_3. Imagine zylker_2 has a subfolder named zylker_a. When you toggle the Auto Discover S3 Folders option to Yes, all the three S3 folders (zylker_1, zylker_2, and zylker_3) and the subfolder (zylker_a) will be auto-discovered and monitored.
Even if the Auto Discover S3 Folders option is enabled, folders or subfolders will not be automatically or manually added inside an S3 bucket when the:
- Folder name is equal to the AWSLogs.
- Folder name is equal to the vaults.
- Folder name is an UUID. Example: 123e4567-e89b-12d3-a456-426614174000
- Folder name consists only of numbers or special characters. Example: 123456, $%^&&,23456#$%
-
On this page
- Setup and configuration
- Policies and permissions
- Polling frequency
- Security findings
- Supported performance metrics
- Storage metrics
- Request metrics
- Replication metrics
- Configuration details
- Threshold Configuration
- Forecast
- Checking S3 Objects
- Amazon S3 Object monitoring
- Prerequisites
- Add S3 Object Monitor
- Discovering S3 Objects
- Selecting S3 Objects
- Configuring S3 Object Monitor
- Amazon S3 Folder monitoring
- Prerequisites
- Why S3 Folder monitoring?
- Discovering and adding S3 Folder Monitors
