Mobile APM for Android
Site24x7 Mobile APM for Android lets you track the performance of your native mobile applications on actual end-user devices. For example, a news reader application may perform the following operations internally:
- Launch an activity to show a list of articles
- Load the list of articles using a REST API call
- Cache the list of articles in an SQLite database
- Download a thumbnail for each article
- Cache the thumbnails to the filesystem
- Build a complex UI such as a custom list view layout
All of the above are potentially long-running operations that impact user experience so it's important to benchmark and optimize them across various devices. Site24x7 Mobile APM gathers and aggregates metrics from all your users across the globe by embedding an APM agent in your applications in the form of a library.
The APM agent measures the execution time of your code using transactions and components. In the previous example, the entire sequence of operations from launching the activity to rendering the final UI can be considered a transaction. The individual operations can be grouped into different component types such as HTTP, SQLite, filesystem, UI etc. Simple operations can be measured using just transactions, while complex operations can be measured using transactions with components.
Add Mobile APM?
Add Mobile APM
- Login to Site24x7 and go to Android OS section under APM tab.
- Click on Add Application button.
- Enter the Application Name and Apdex Threshold and click Save.
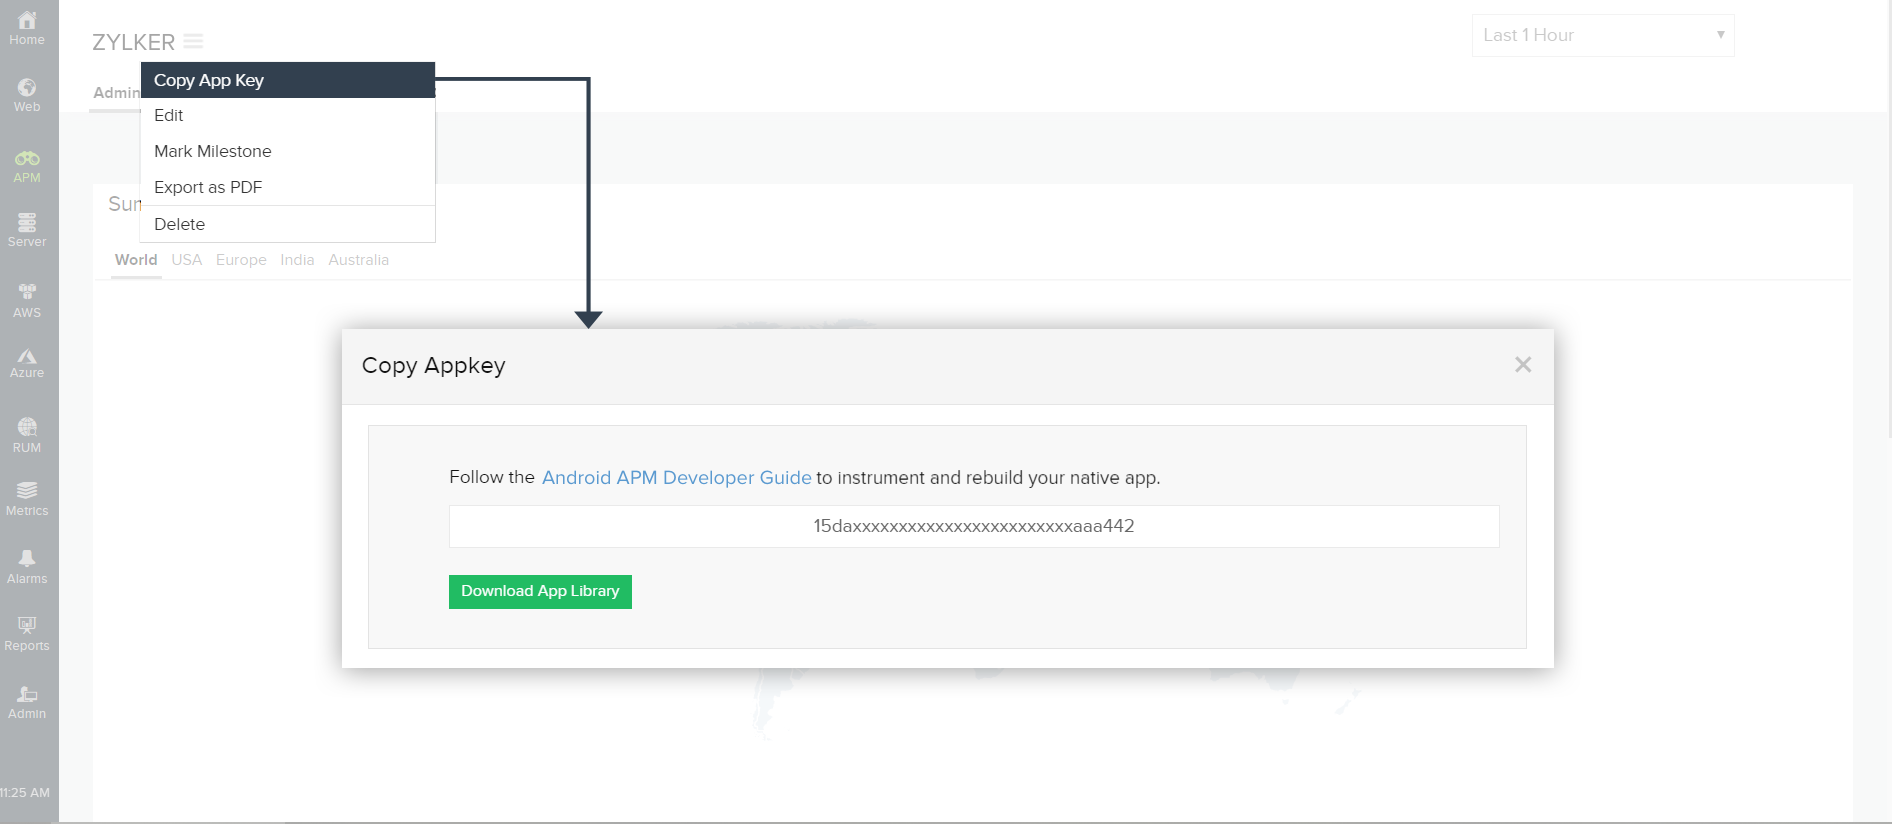
- Copy your application key by clicking on the hamburger icon (
 ) near your application name in your application screen.
Instrument and Initialize Mobile APM in your native app
Usage
Start by logging in to the Site24x7 website and creating a new Mobile APM application. You will be provided with an application key and a link to download the library files. The same application key must be used for all versions of your application.
- Step 1:
Add Mobile APM Android SDK to app level build.gradle
//project level build.gradle file
buildscript {
    repositories {
        google()
        jcenter()
        maven { url 'https://maven.zohodl.com' }
    }
}
//app level build.gradle file
repositories {
    google()
    jcenter()
    maven { url 'https://maven.zohodl.com' }
}
dependencies {
    implementation fileTree(dir: 'libs', include: ['*.jar'])
    implementation 'com.android.support:appcompat-v4:23.0.0'
    implementation 'com.android.support.constraint:constraint-layout:1.1.3'
    implementation 'com.zoho.site24x7:mobileapm:2.2.2'
    testImplementation 'junit:junit:4.12'
    androidTestImplementation 'com.android.support.test:runner:1.0.2'
    androidTestImplementation 'com.android.support.test.espresso:espresso-core:3.0.2'
}
The line's highlighted needs to be added in the app level build.gradle for monitoring to begin
Step 2:The APM agent requires the following permissions to be declared in AndroidManifest.xml:
<uses-permissionandroid: name="android.permission.INTERNET"/>Step 3:
<uses-permissionandroid: name="android.permission.ACCESS_NETWORK_STATE"/>
Initialize the APM agent by invoking Apm.startMonitoring() in the onCreate() method of your Application subclass with the application key you obtained earlier. The APM agent uploads data to Site24x7 every 60 seconds by default. You can customize the upload interval if desired. If no data has been recorded, the APM agent will not make unnecessary network connections regardless of the interval.
import android.support.v7.app.AppCompatActivity;
import android.os.Bundle;
import com.site24x7.android.apm.Apm;
public class MainActivity extends AppCompatActivity {
@Override
protected void onCreate(Bundle savedInstanceState) {
super.onCreate(savedInstanceState);
Apm.startMonitoring(getApplicationContext(), "appKey", uploadInterval)
setContentView(R.layout.activity_main);
}
Note: Perform some transactions to initiate data collection.
Step 4:Build your project.
Start a transaction?
Using Transactions
Start a transaction by invoking Apm.startTransaction()and providing it with a name. You should typically start a transaction before a long-running operation and stop it when the operation is complete. Transactions are thread-safe and can be started and stopped from different threads. A transaction object can only be started and stopped once. Transactions with the same name are averaged across the application. Thus, when the same operation is executed multiple times using the same transaction name, the average execution time is recorded.
private void listArticles() {
Transaction transaction = Apm. startTransaction ( "List Articles" );
// Perform long-running operation
Apm. stopTransaction ( transaction );
}
Group operations within a transaction using components?
Using Components
You can group operations within a transaction into components by invoking Transaction.startComponent()and specifying a type. You can use one of the predefined types such as Component.TYPE_HTTP, Component.TYPE_SQLITE, Component.TYPE_UI etc., or specify your own type. Components are thread-safe and can be started and stopped from different threads. A component object can only be started and stopped once. A component object cannot be stopped after its parent transaction has already been stopped. Multiple components in a transaction can overlap and run in parallel. Components with the same name within a transaction are averaged.
Component httpComponent = transaction .startComponent( Component.TYPE_HTTP );
Component articlesComponent = transaction .startComponent( "Download Articles" );
// Download articles
transaction .stopComponent( articlesComponent );
for (Article article in articles ) {
Component thumbnailComponent = transaction .startComponent( "Download Thumbnail" );
// Download thumbnail
transaction .stopComponent( thumbnailComponent );
}
transaction .stopComponent( httpComponent );
Apm. stopTransaction (transaction);
}
In the above example, the total time taken by HTTP operations (downloading articles and thumbnails) are measured by Component.TYPE_HTTP and the time taken for just the articles is measured by "Download Articles" . The time taken for each thumbnail is averaged and recorded by "Download Thumbnail" since it executes multiple times within a loop.
Flush the data?
Flushing Data
Sometimes it's desirable to manually flush recently recorded data to Site24x7's servers using the Apm.flush()method. You may want to do this if you record transactions just before your application or activity is destroyed. If you've set a large upload interval (the default is 60 seconds), you should manually flush data whenever appropriate in case the application is terminated before the next upload interval.
View the data
- Log in to your Site24x7 account > APM > Android OS and click on your application.
- The dashboard lists all your mobile apps along with their statuses: Up, Down, Critical, or Trouble.
- Applications that have been suspended or have configuration errors are also listed here.
- For active applications, the following metrics are listed in the dashboard:
- Response time and throughput for the chosen time period compared with the previous time period
- Crashes for the chosen time period
- Apdex score and user count for the chosen time period

Metrics and Inference
- Worldwide summary
- Response time and throughput
- Response time by geographies, carriers, devices, and OSs
- Total response time, throughput, and response time split up of individual transactions
- Crash analytics
1.Worldwide summary report
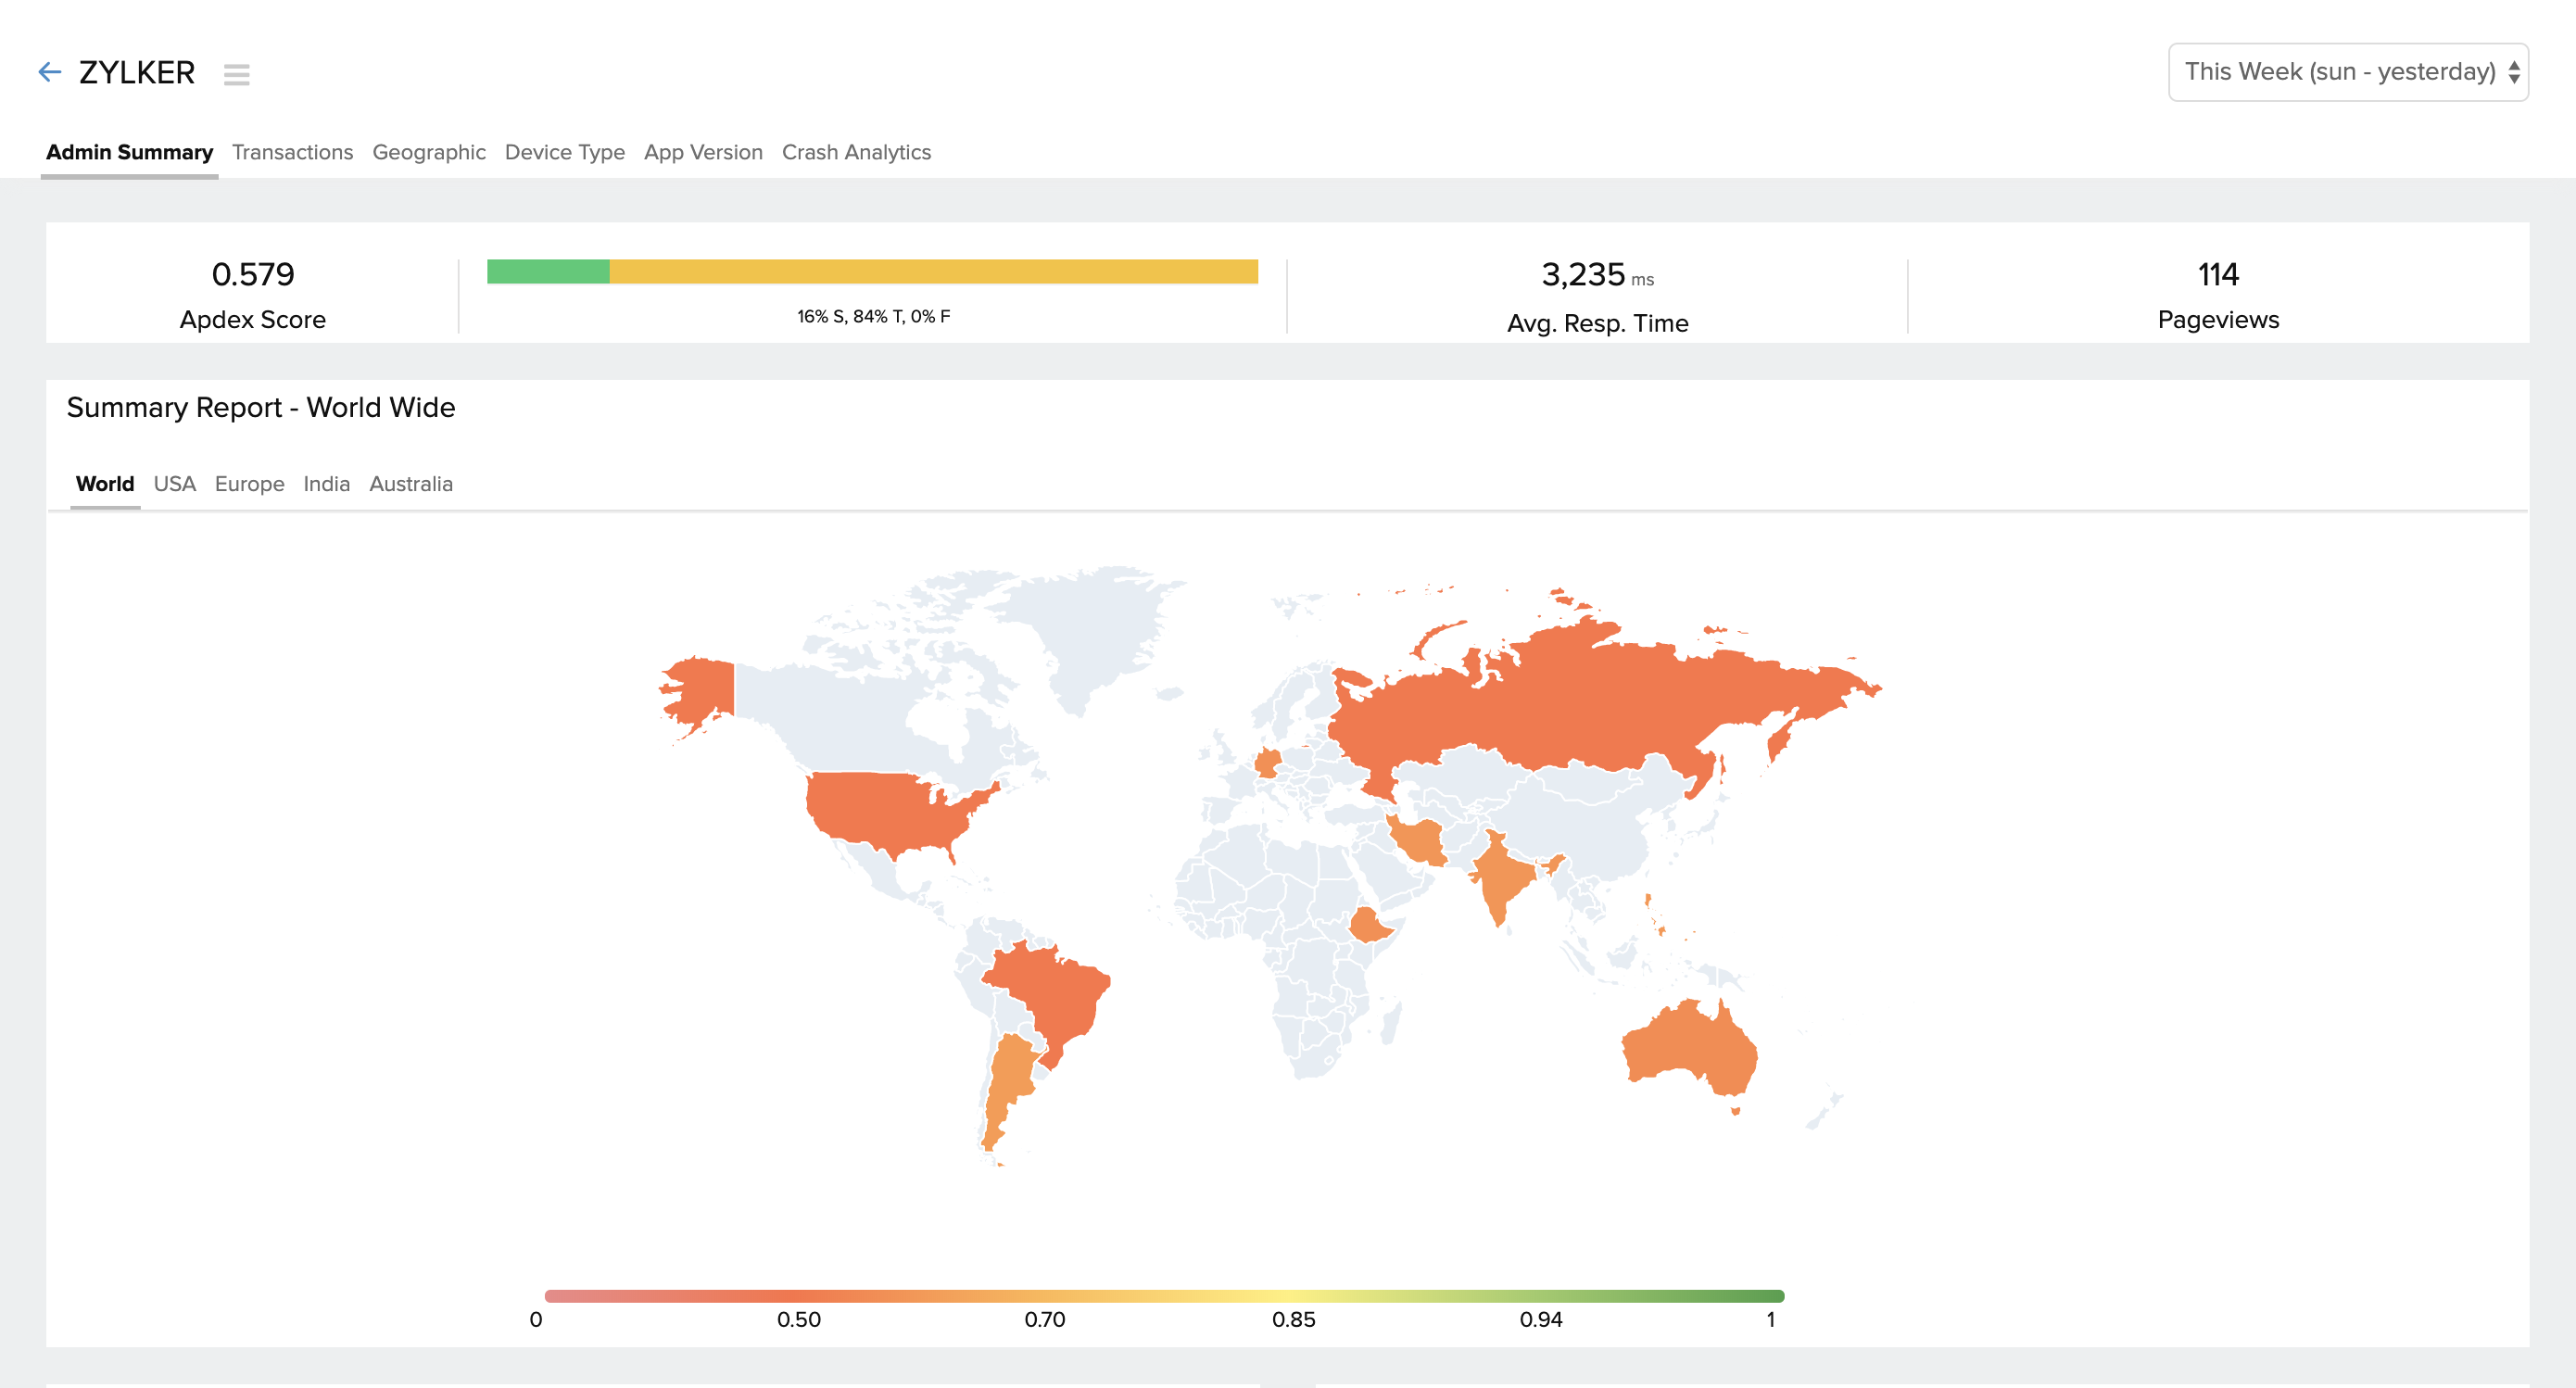
The worldwide summary report shows the performance of your application across all geographies for the chosen time period. The color code is based on the Apdex score, ranging from 0 to 1, with 0 denoting a frustrating user experience and 1 denoting a satisfied user experience. You can hover over an individual region on the map to view the Apdex score, average response time, throughput, and errors for that particular location.
2.Response time and throughput of the app
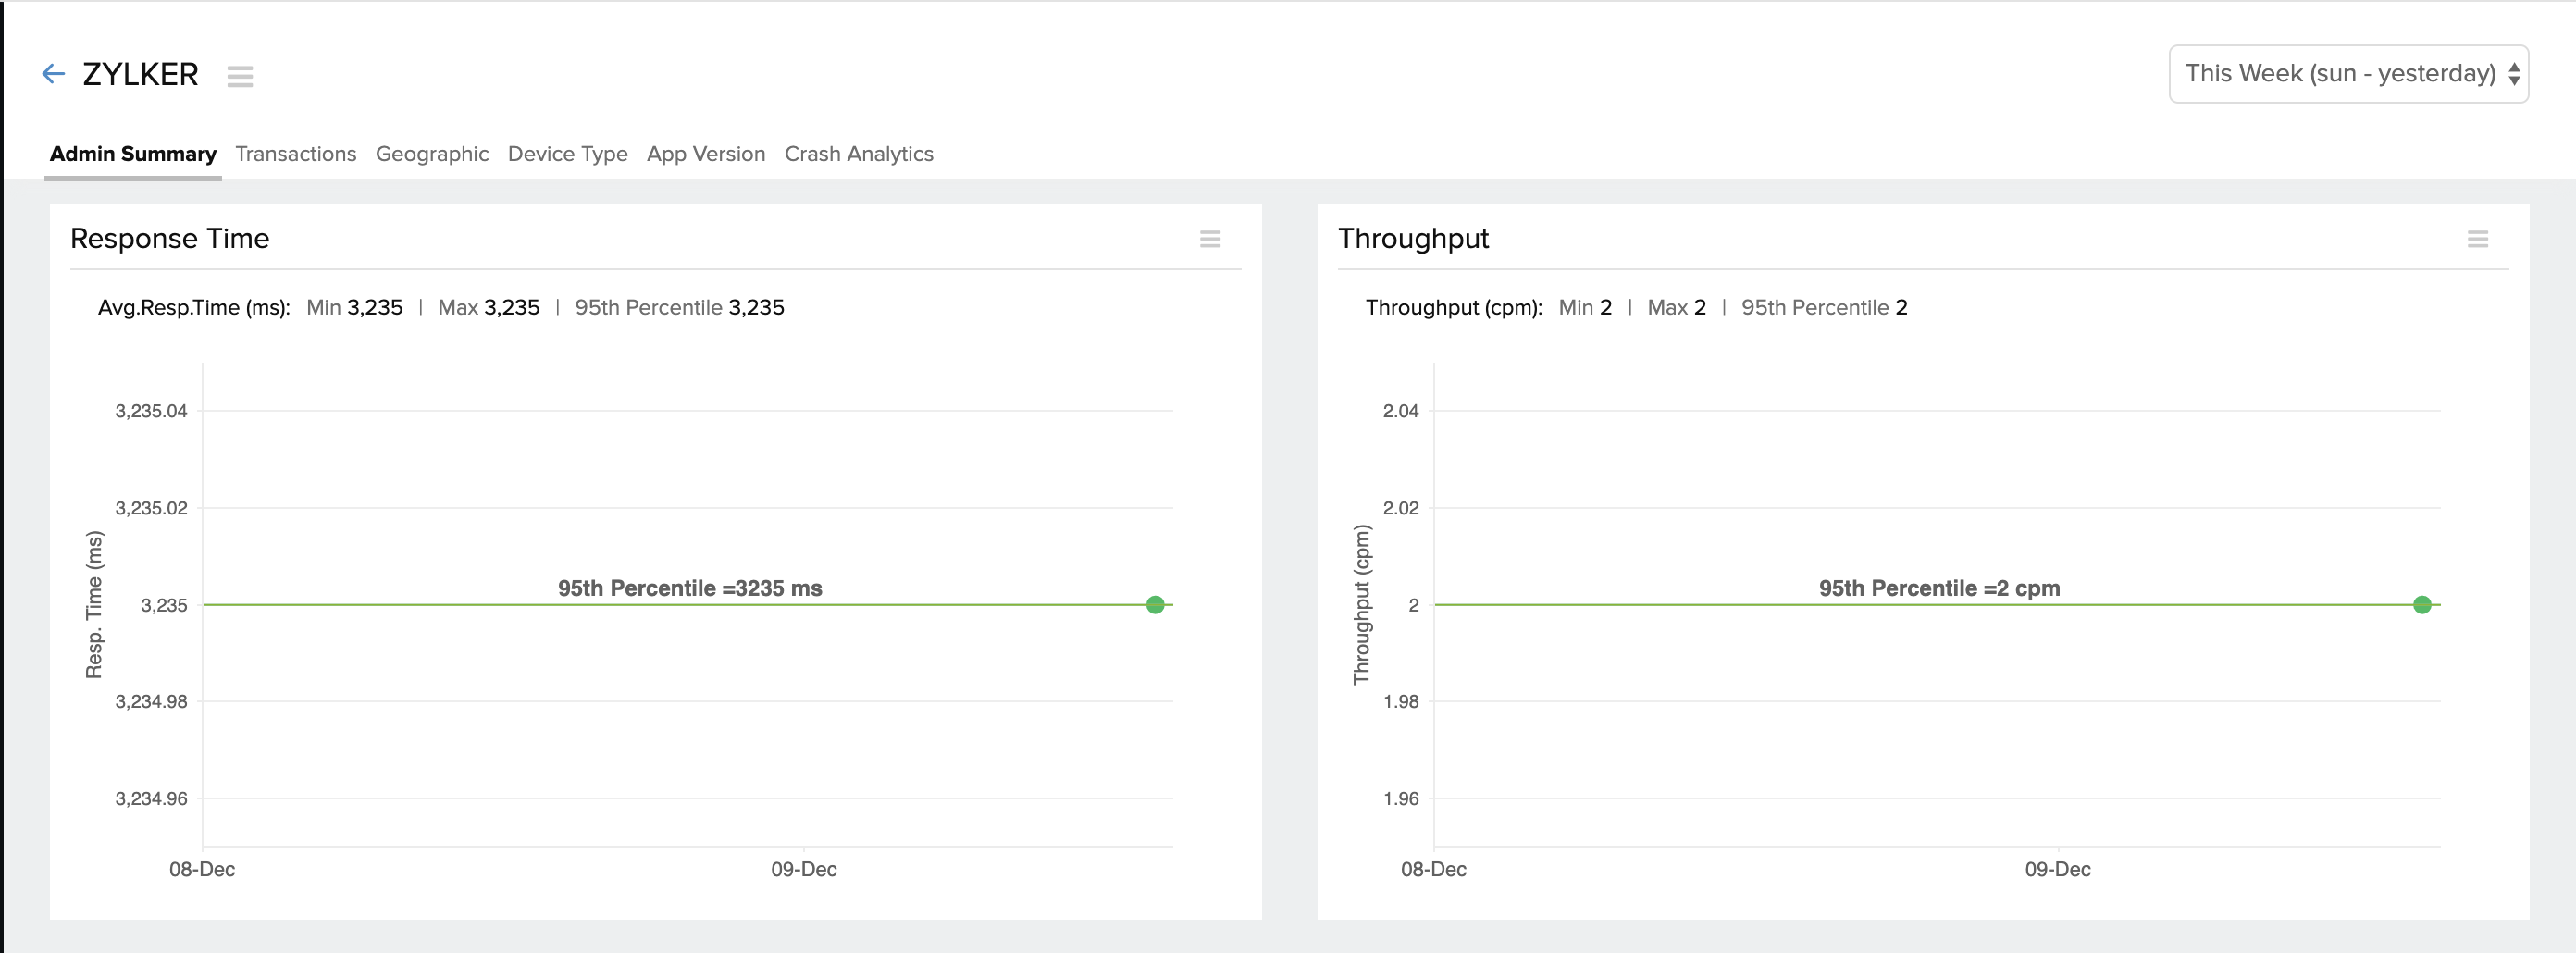
The total response time and throughput of the app for the chosen time period can be viewed from the Admin tab.
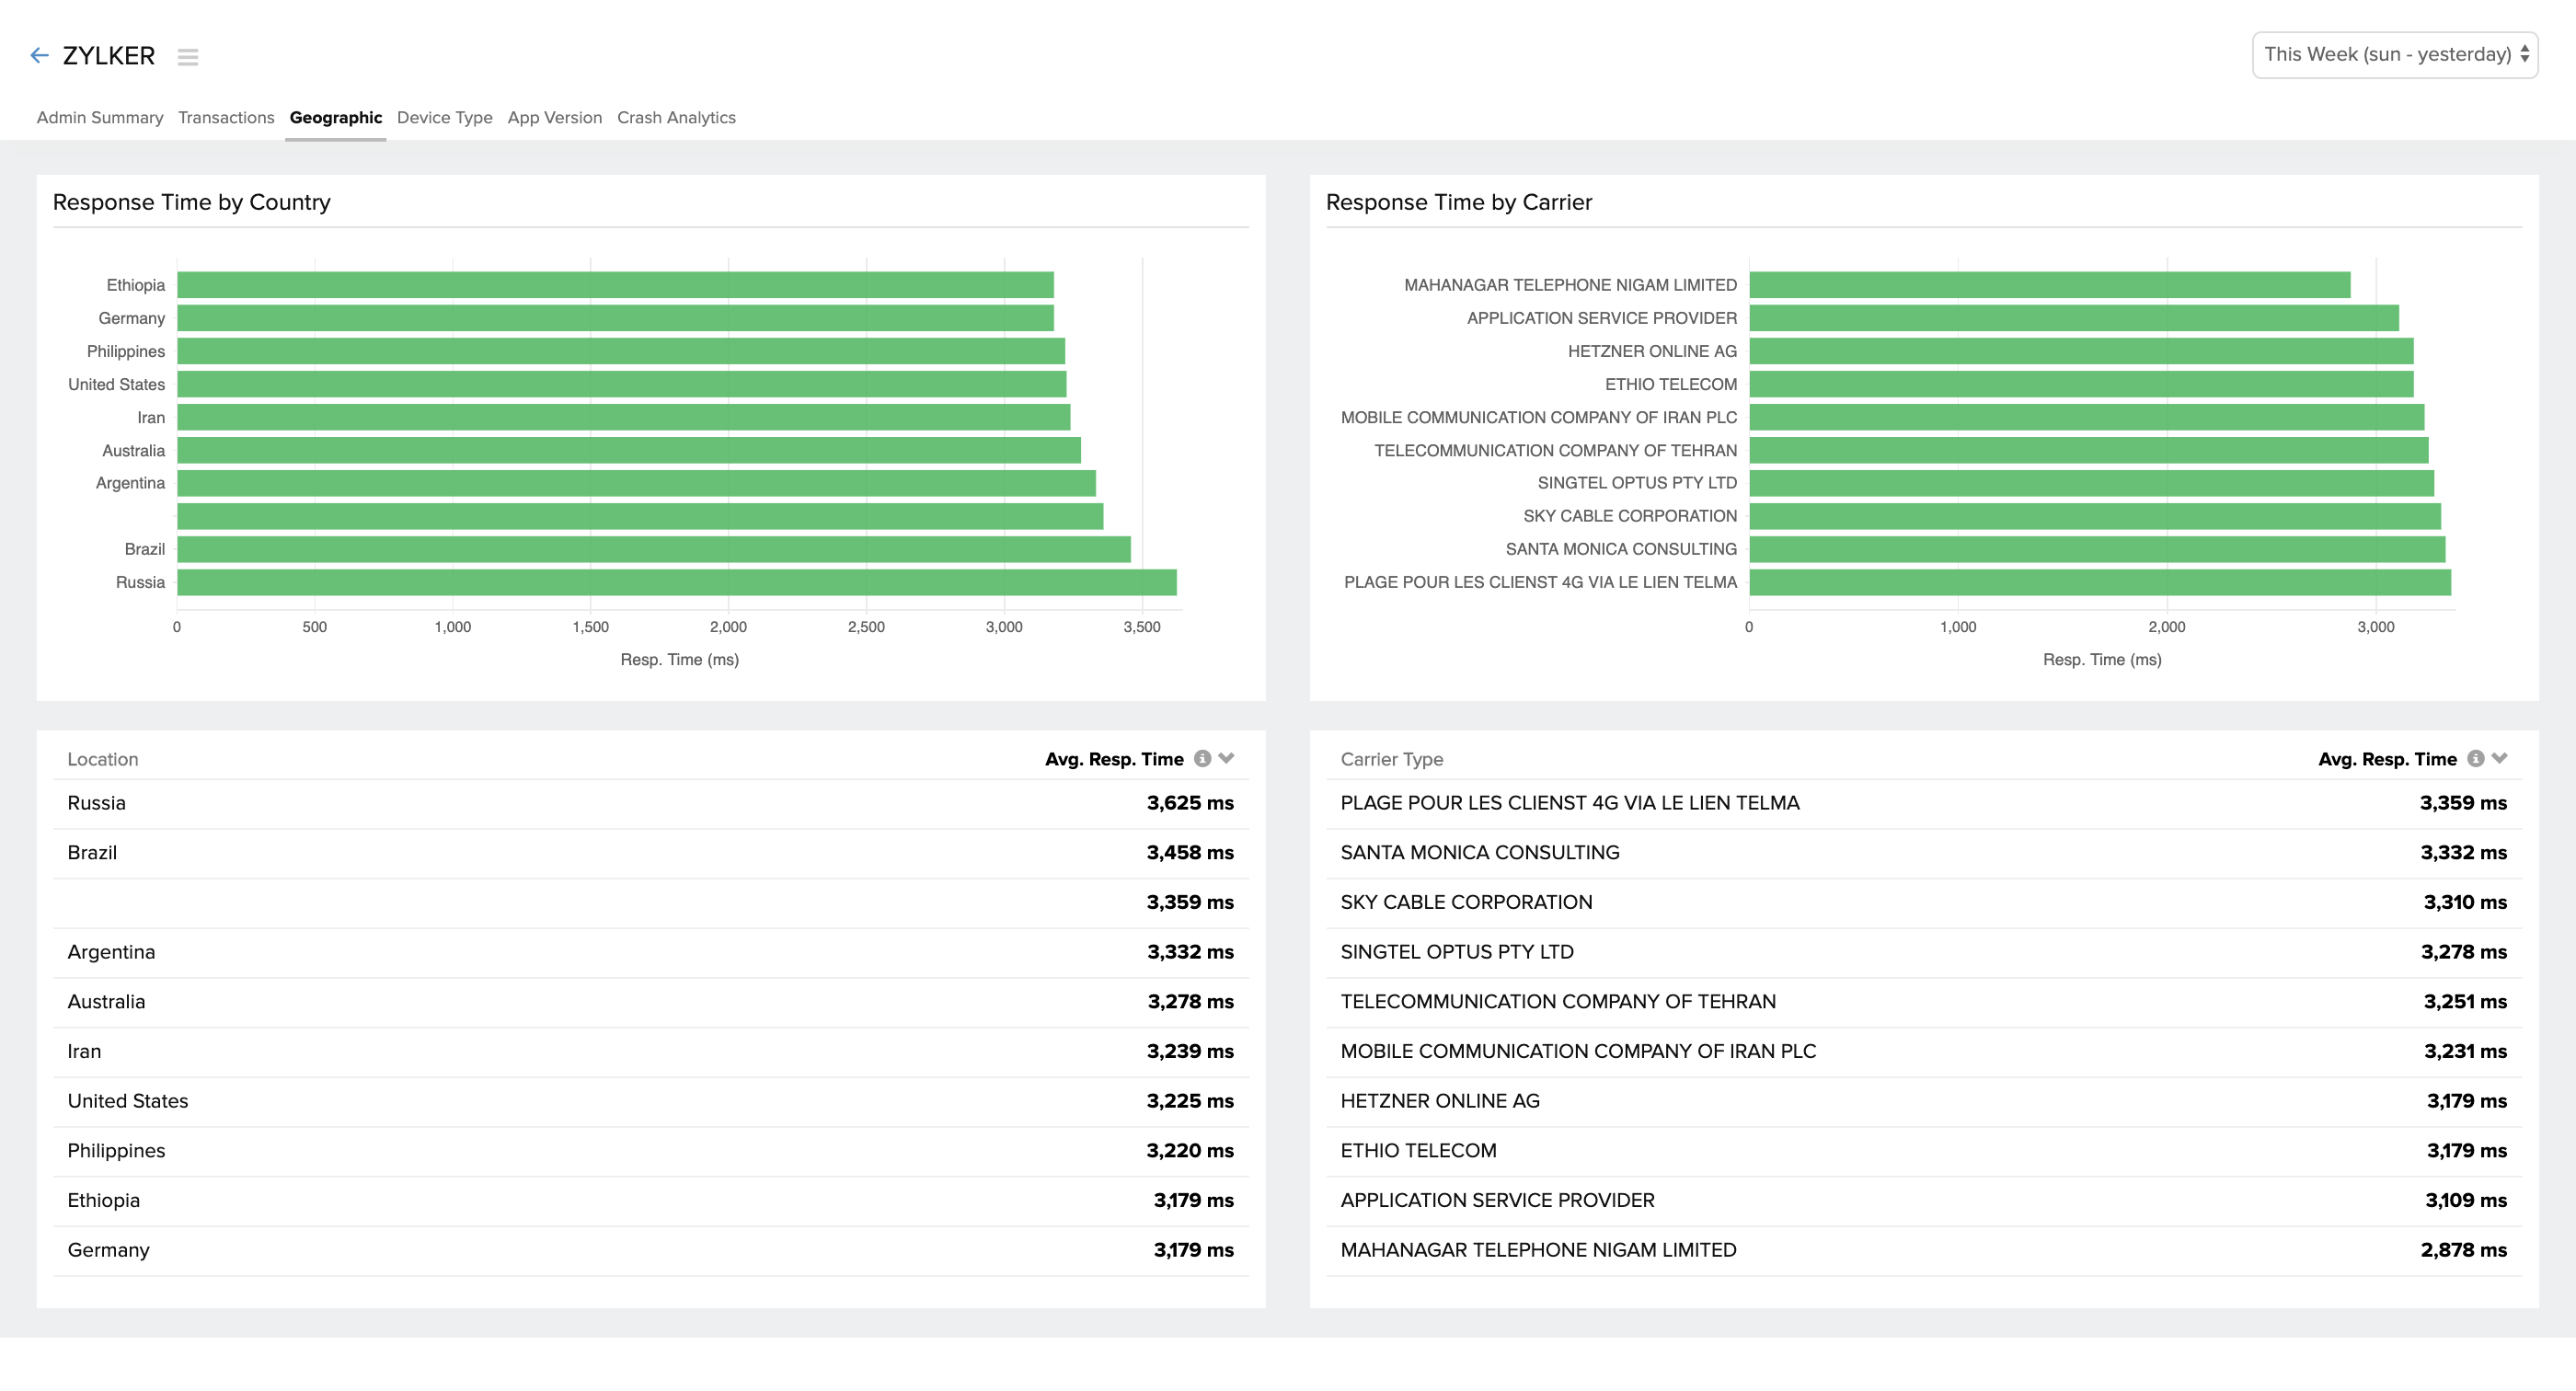
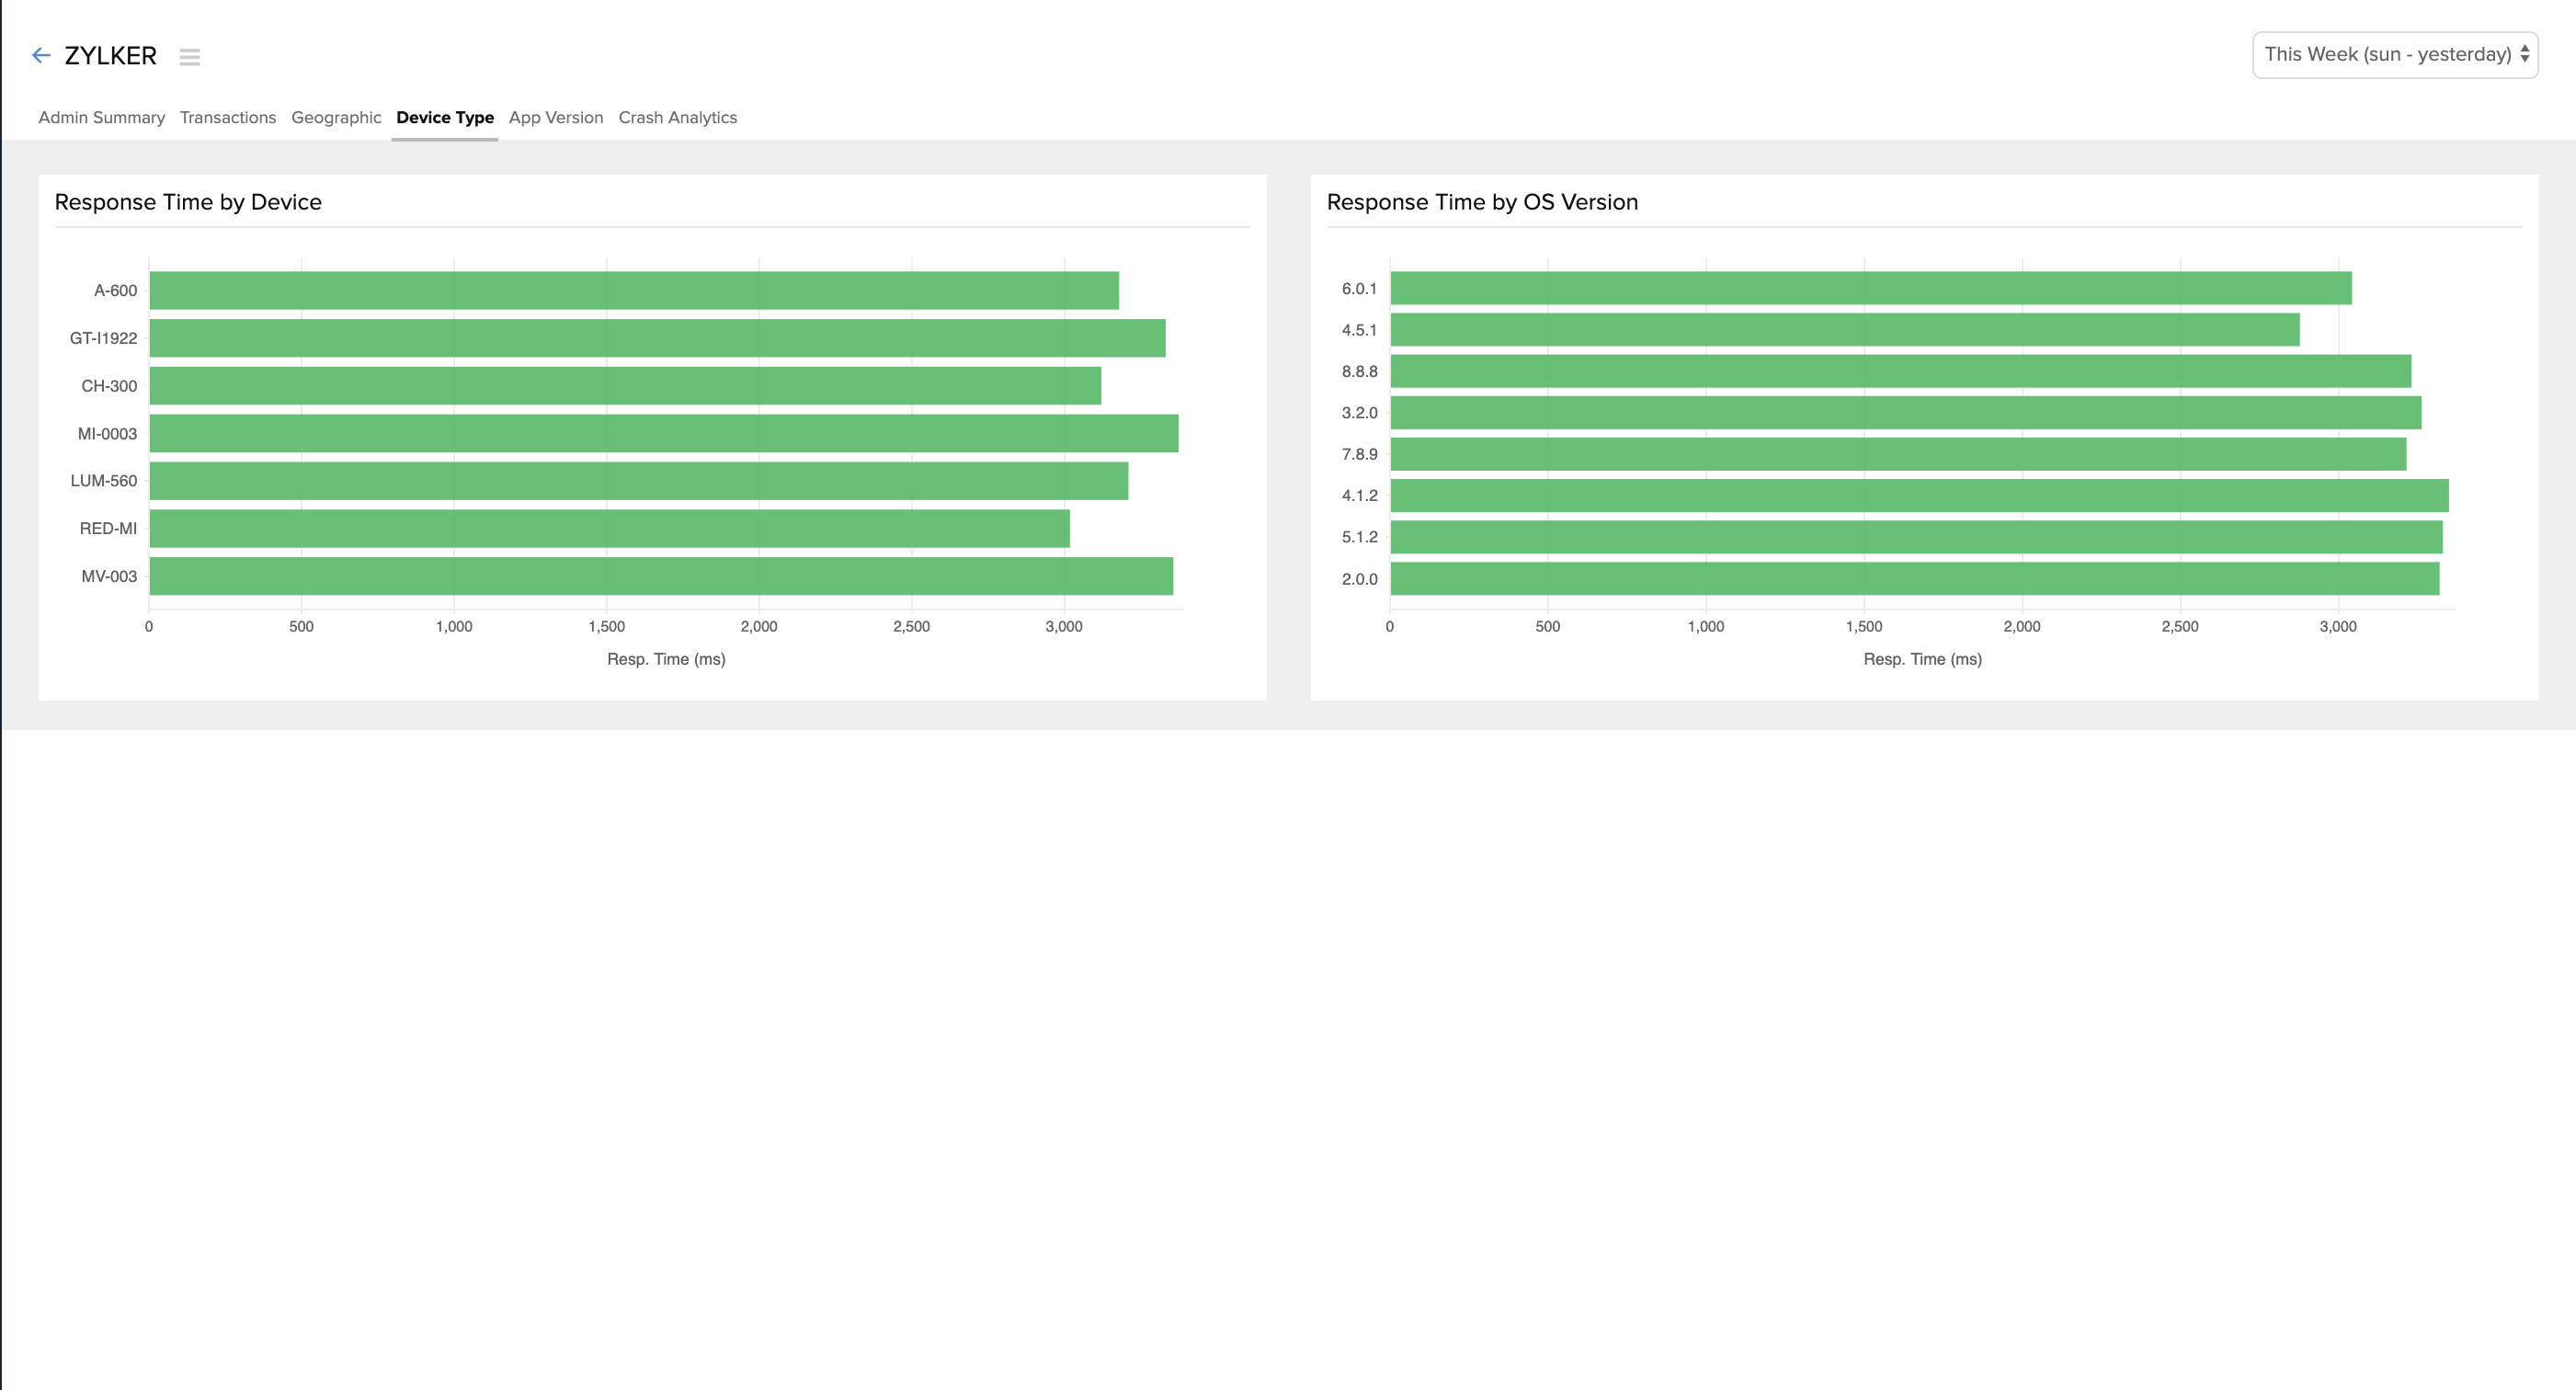
3.Response time split up by geography, carrier, device, and OS version
Your application response time may be impacted by various reasons other than your application code. Comparing your app response time across geographies, devices, and OS versions will help you narrow down the issue.
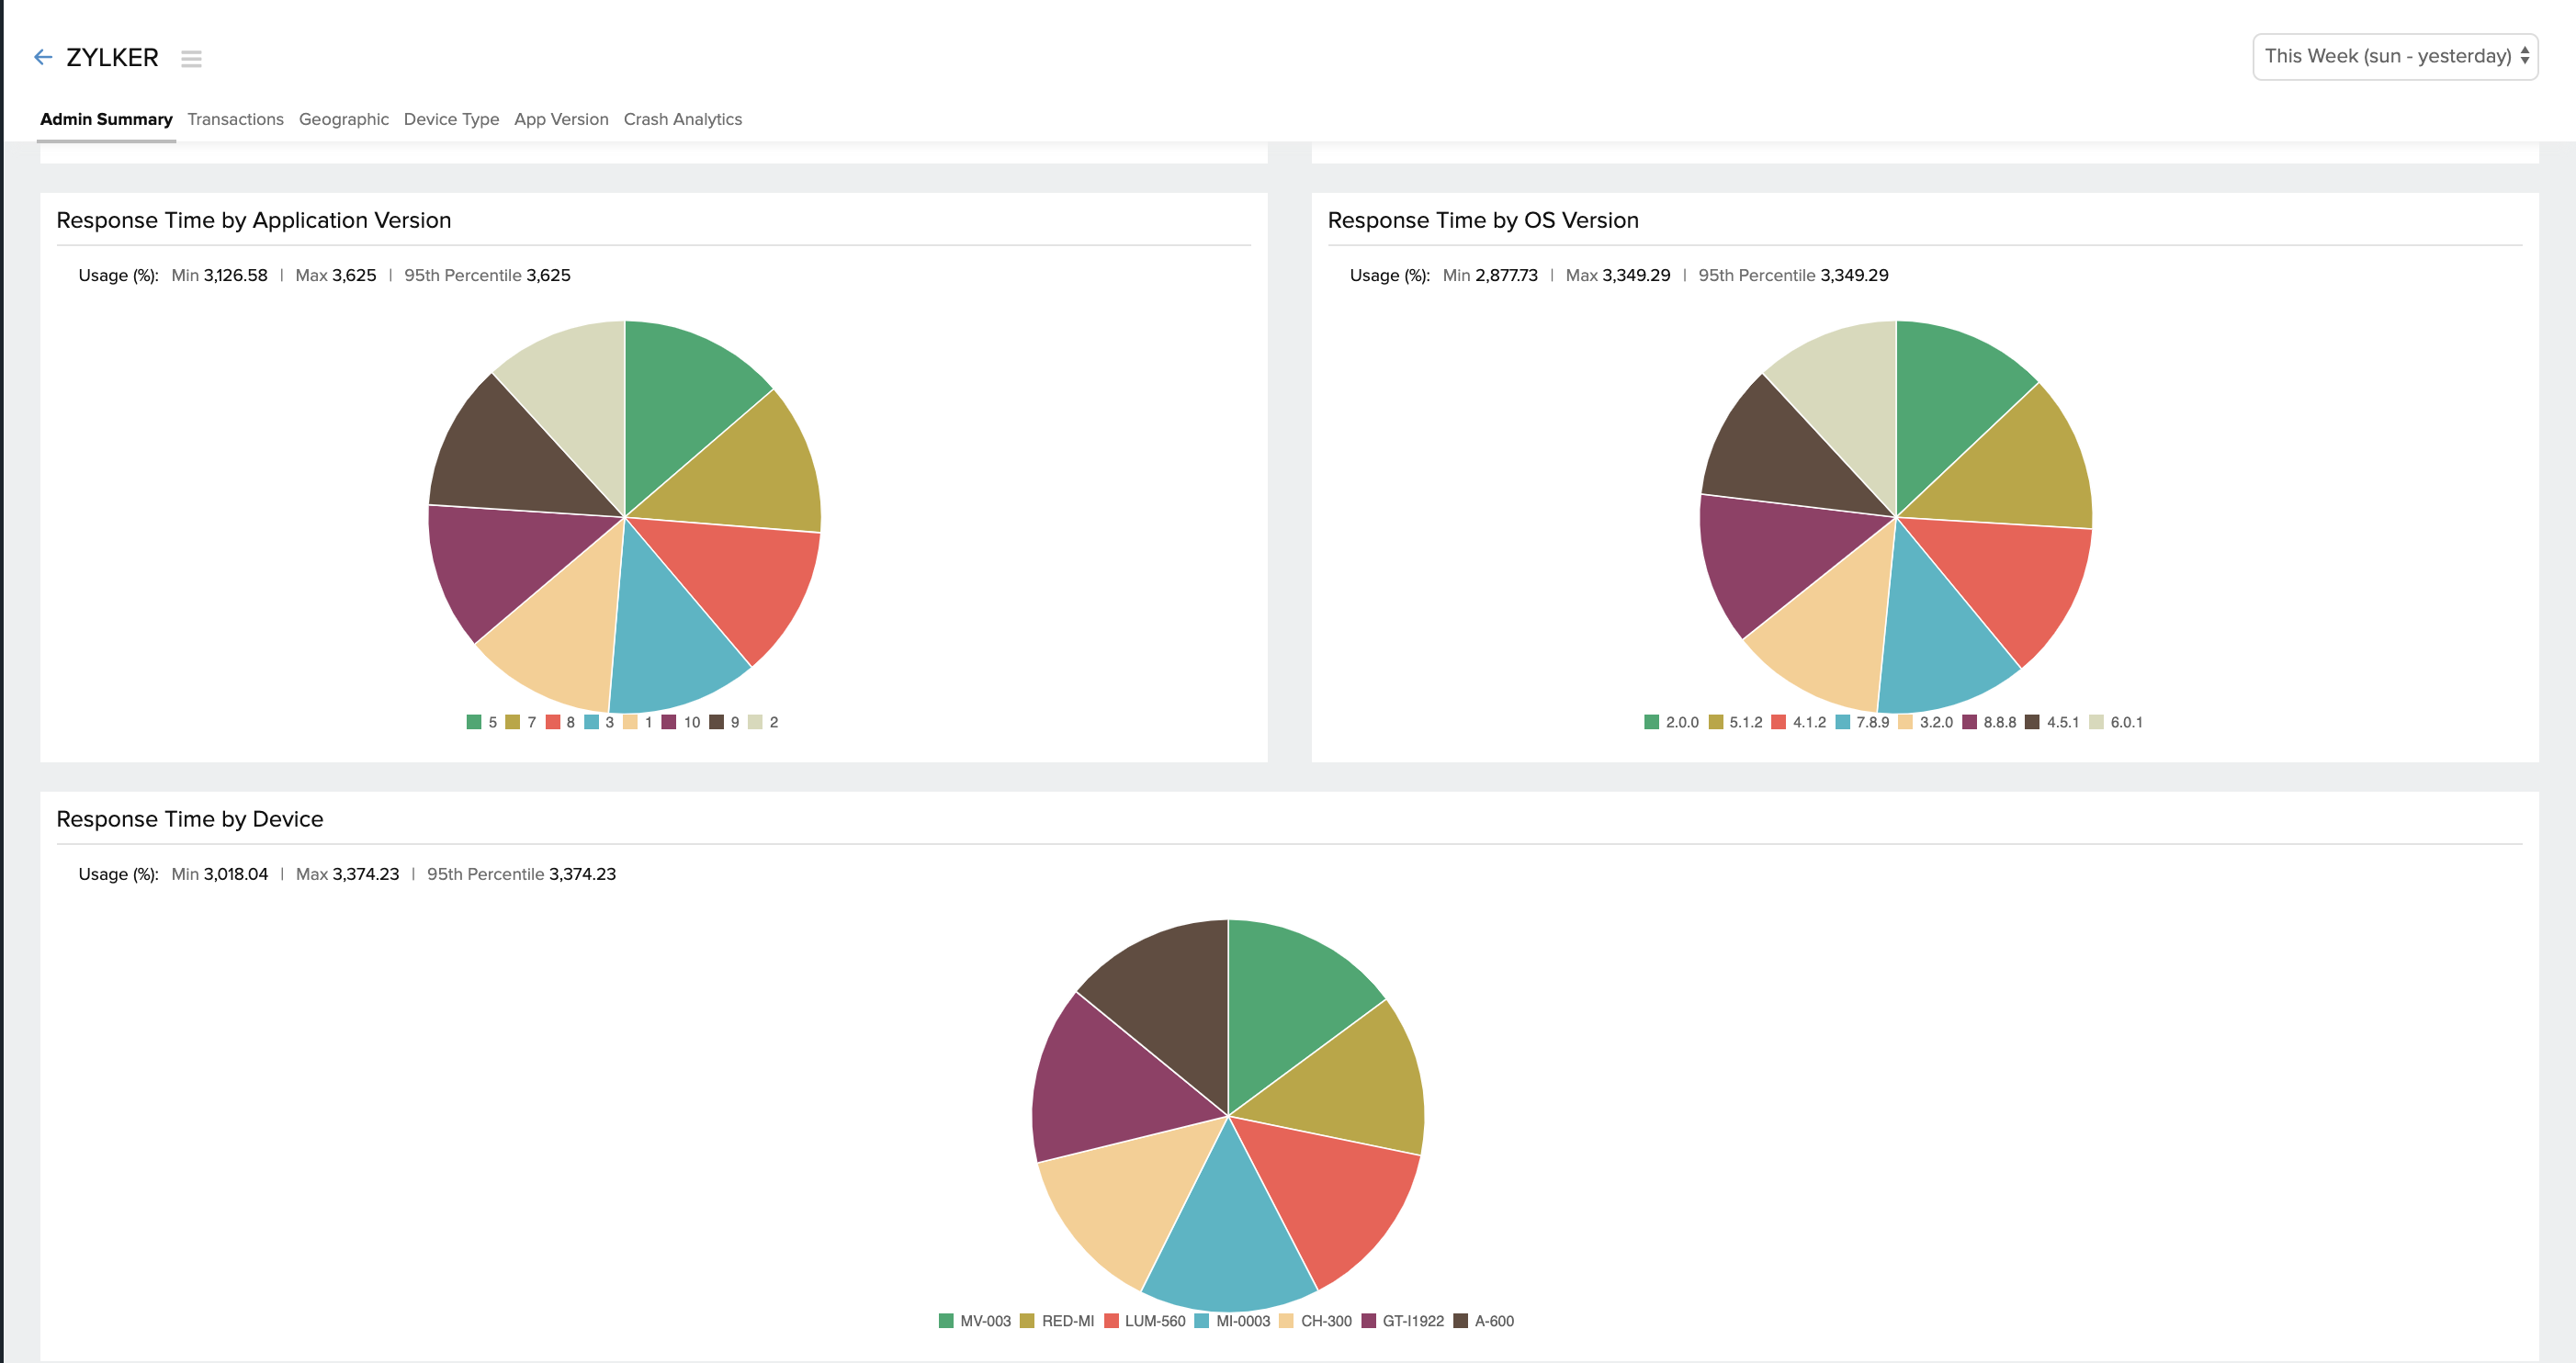
Reponse time by geographies and carriers can be viewed under the Geography tab.
Response time across various devices and OS versions can be seen under the Device Type tab.
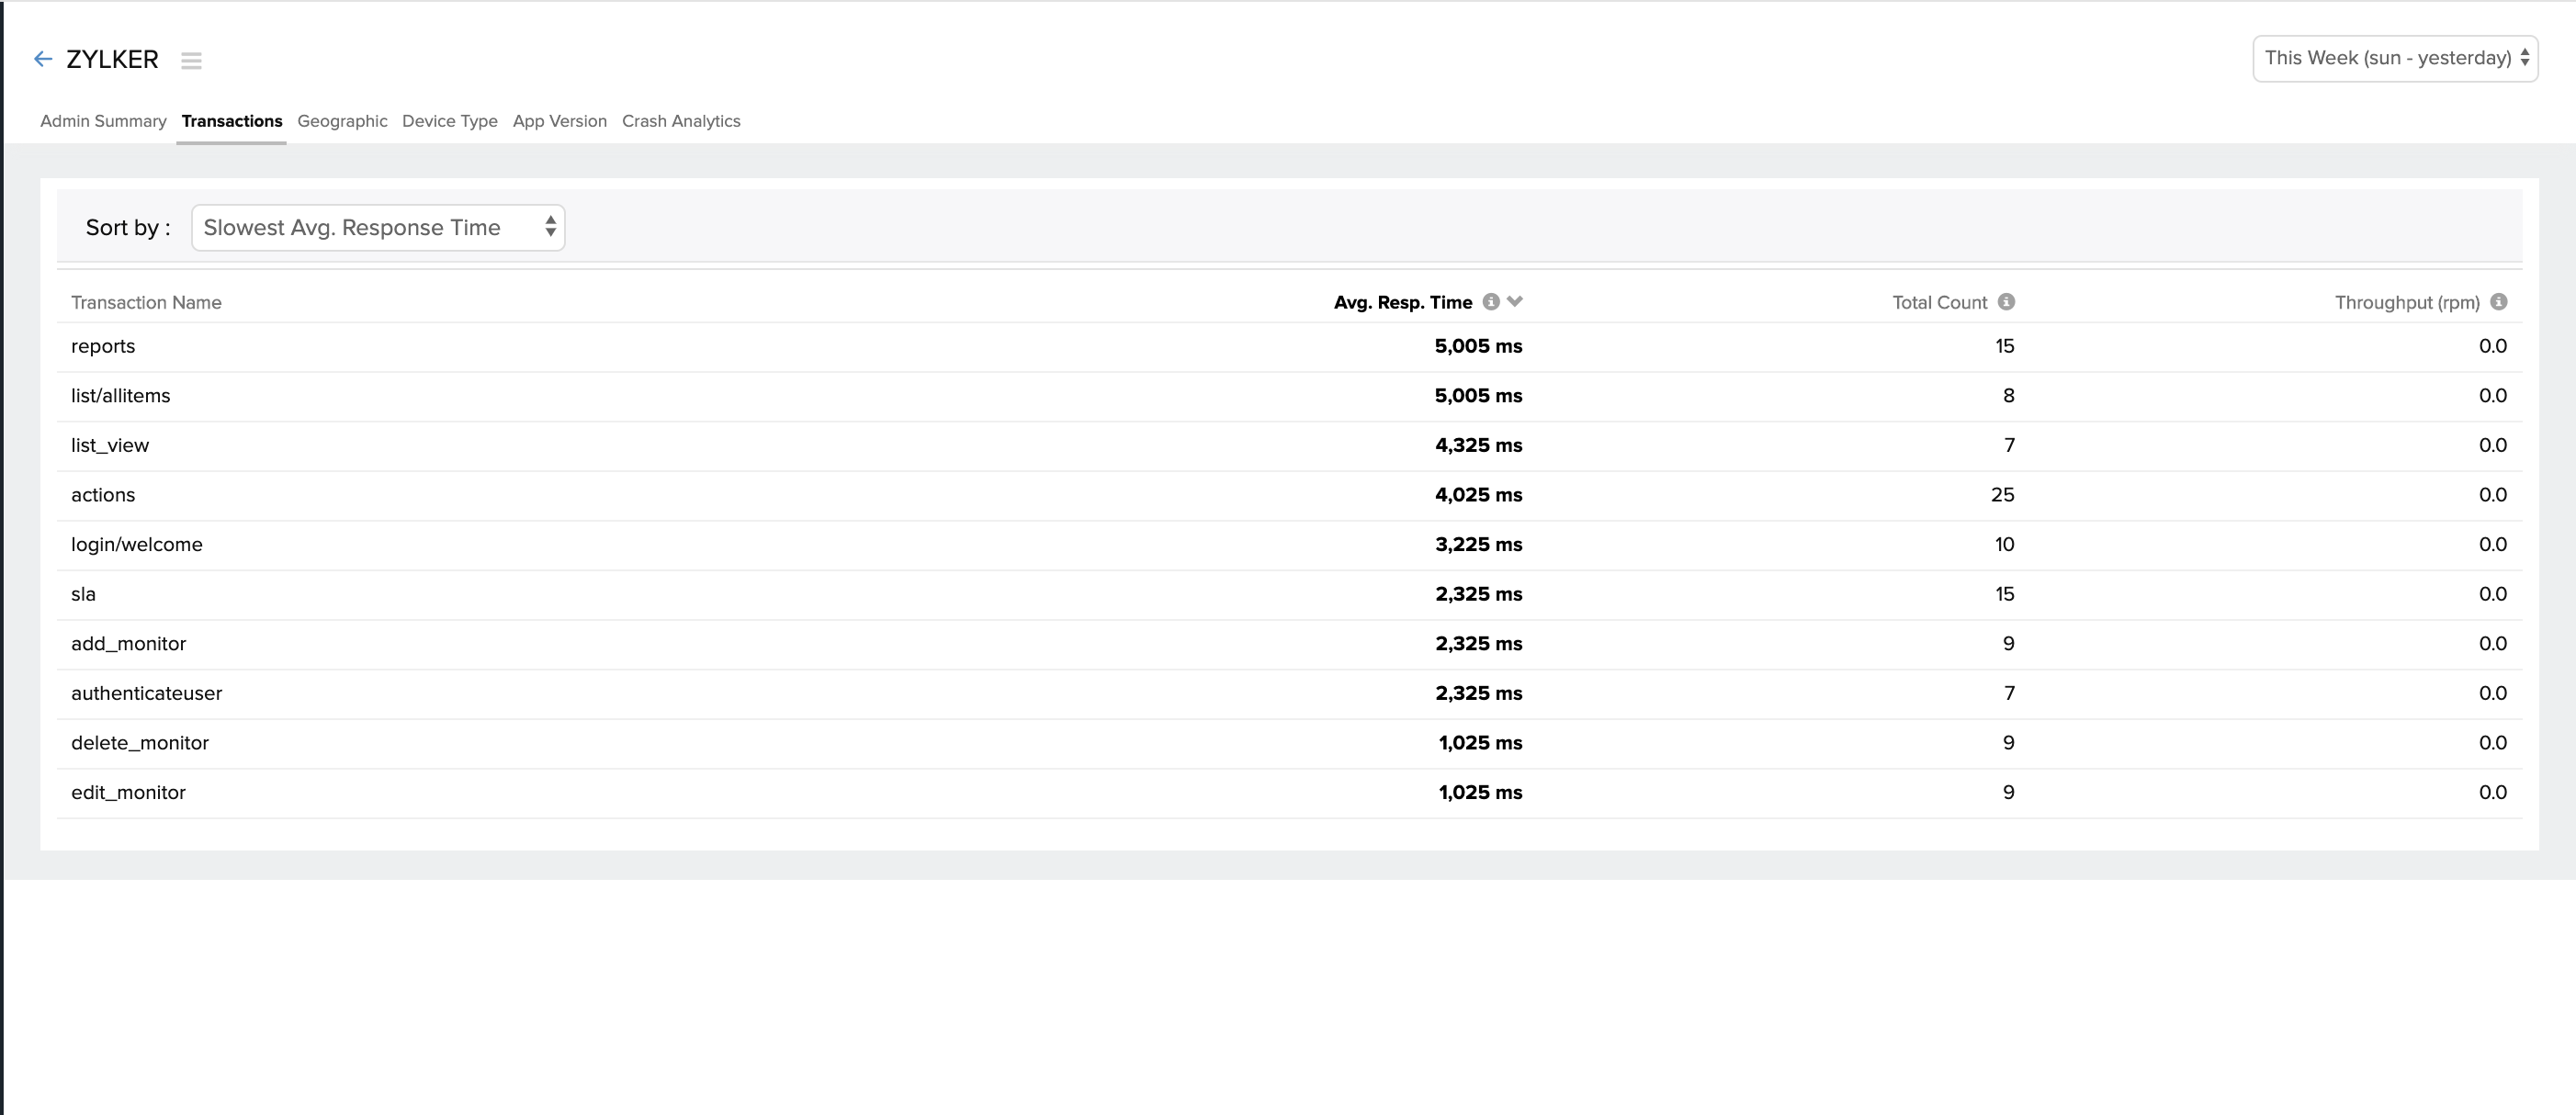
4.Response time of transactions
Response time, throughput, and count (the number of times that transaction was called) of individual transactions can be viewed under the Transactions tab.
5.Crash Analytics
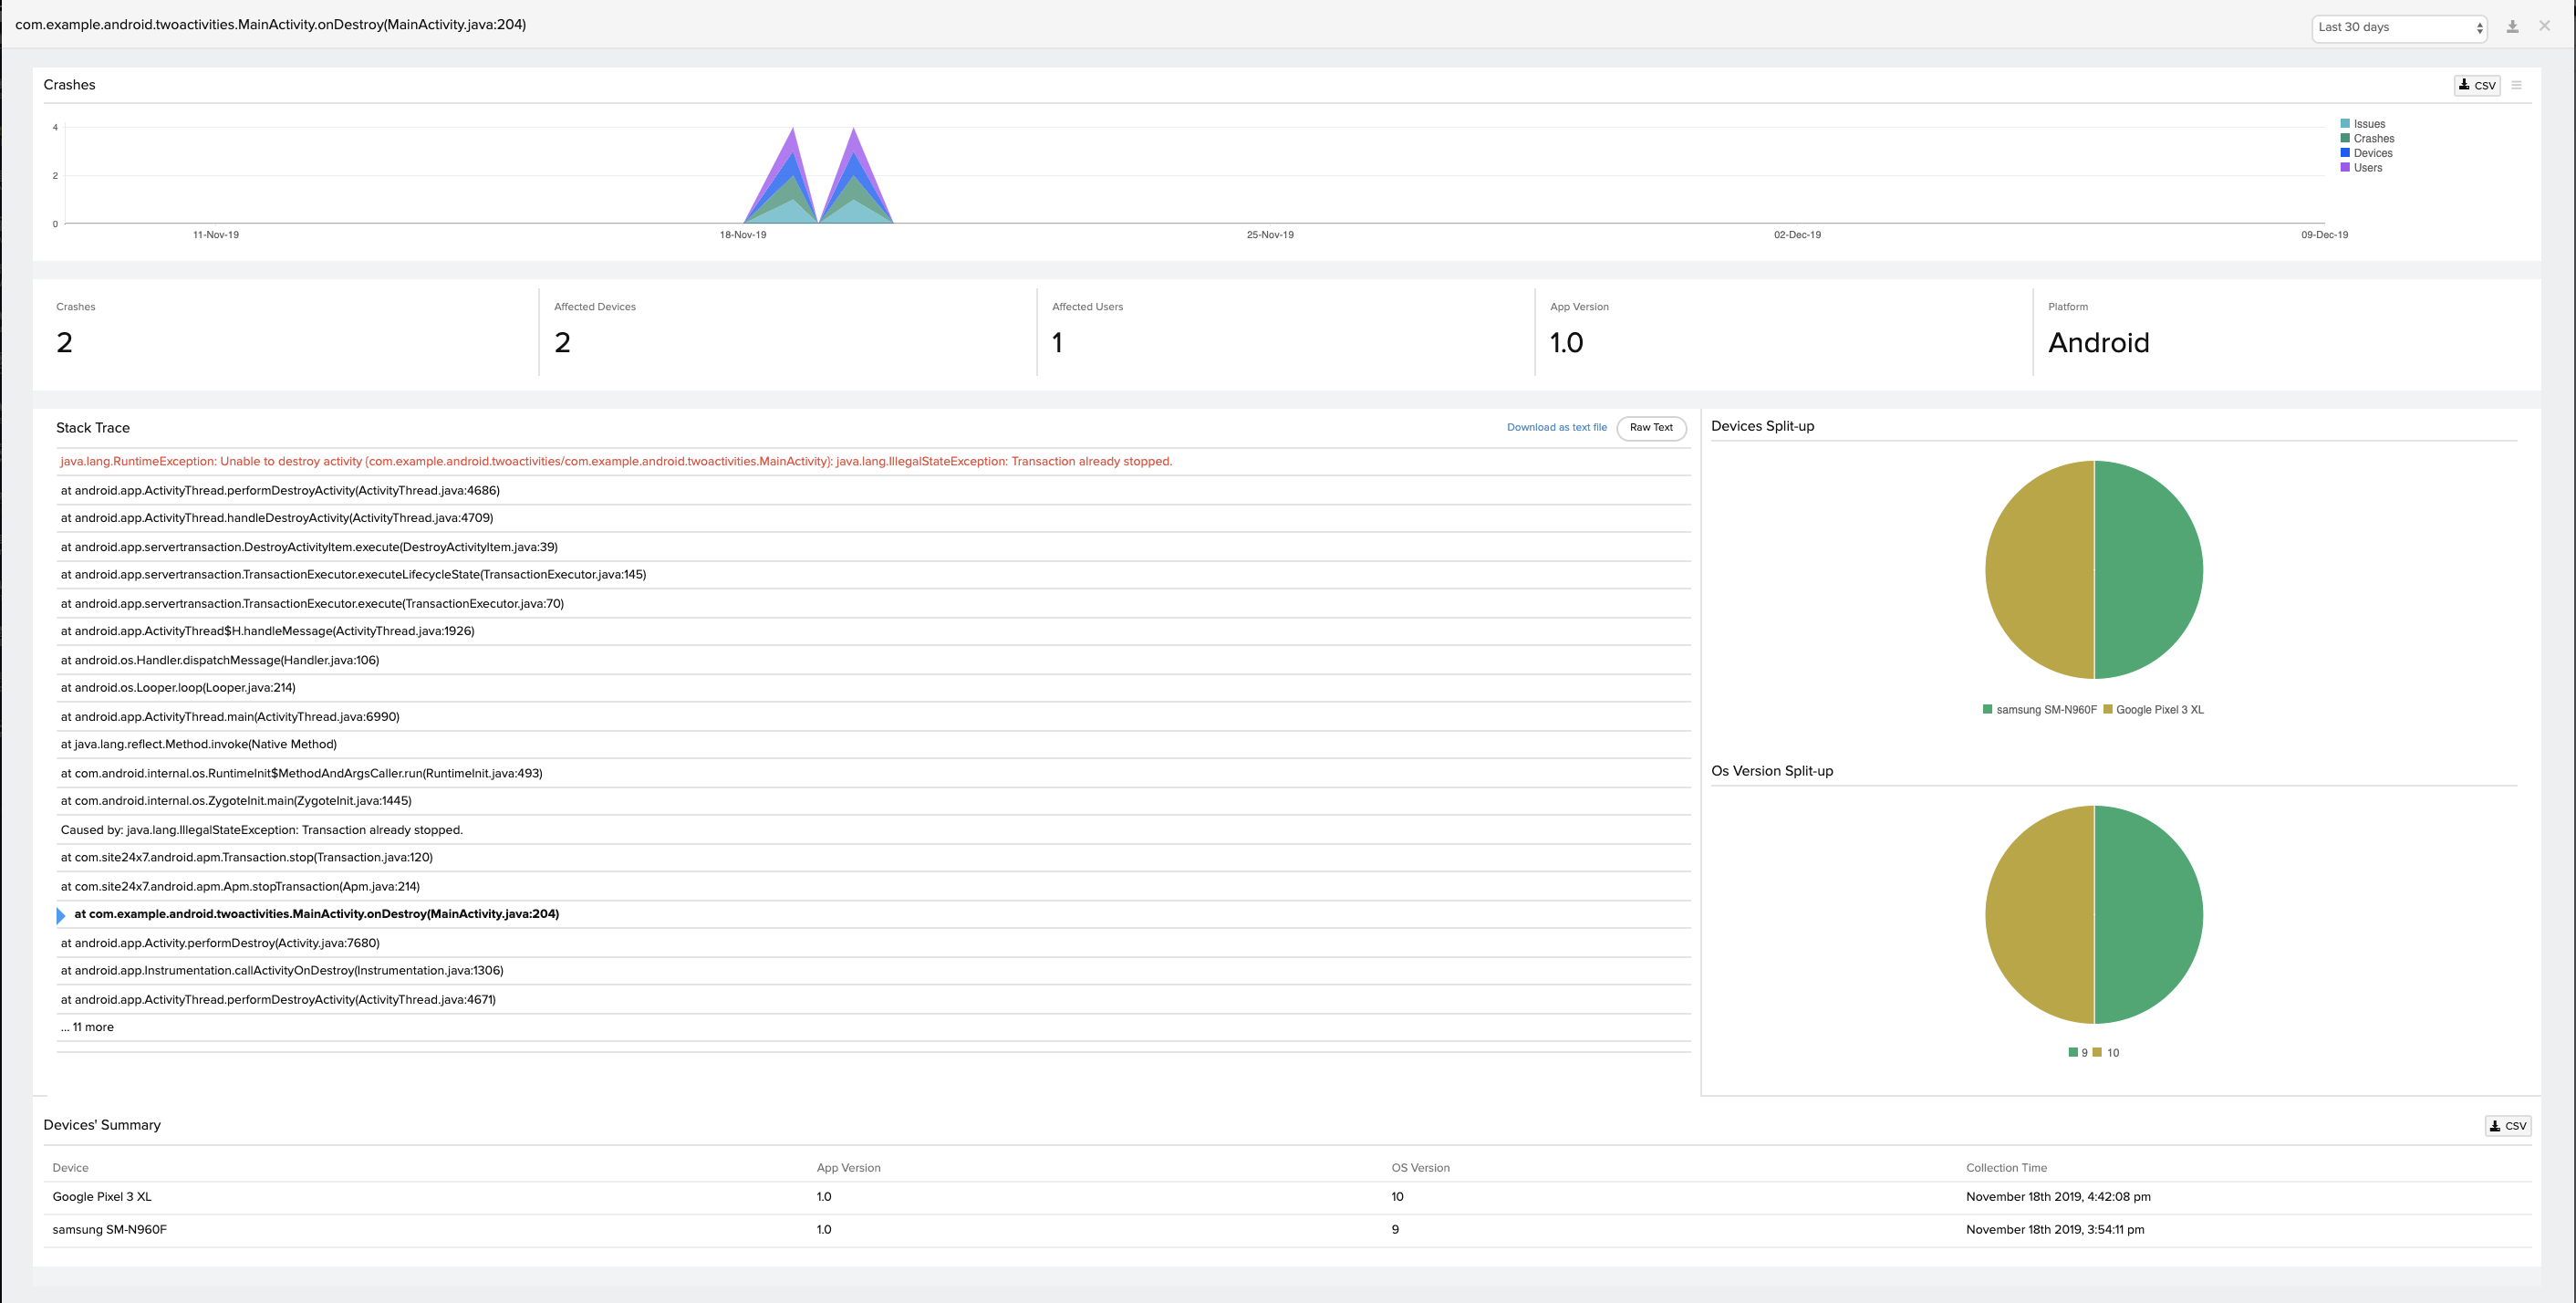
You can view the number of crashes for the chosen time period by clicking on the Crash Analytics tab. You can hover over the stacked graph on the top, to view the number of crashes across various devices, the number of issues, and the number of users who were affected by this crash. The middle band shows you the percentage change in the crashes — an increase or decrease in the total number of crashes along with the count of crash-free users. The crash summary lists the exceptions.
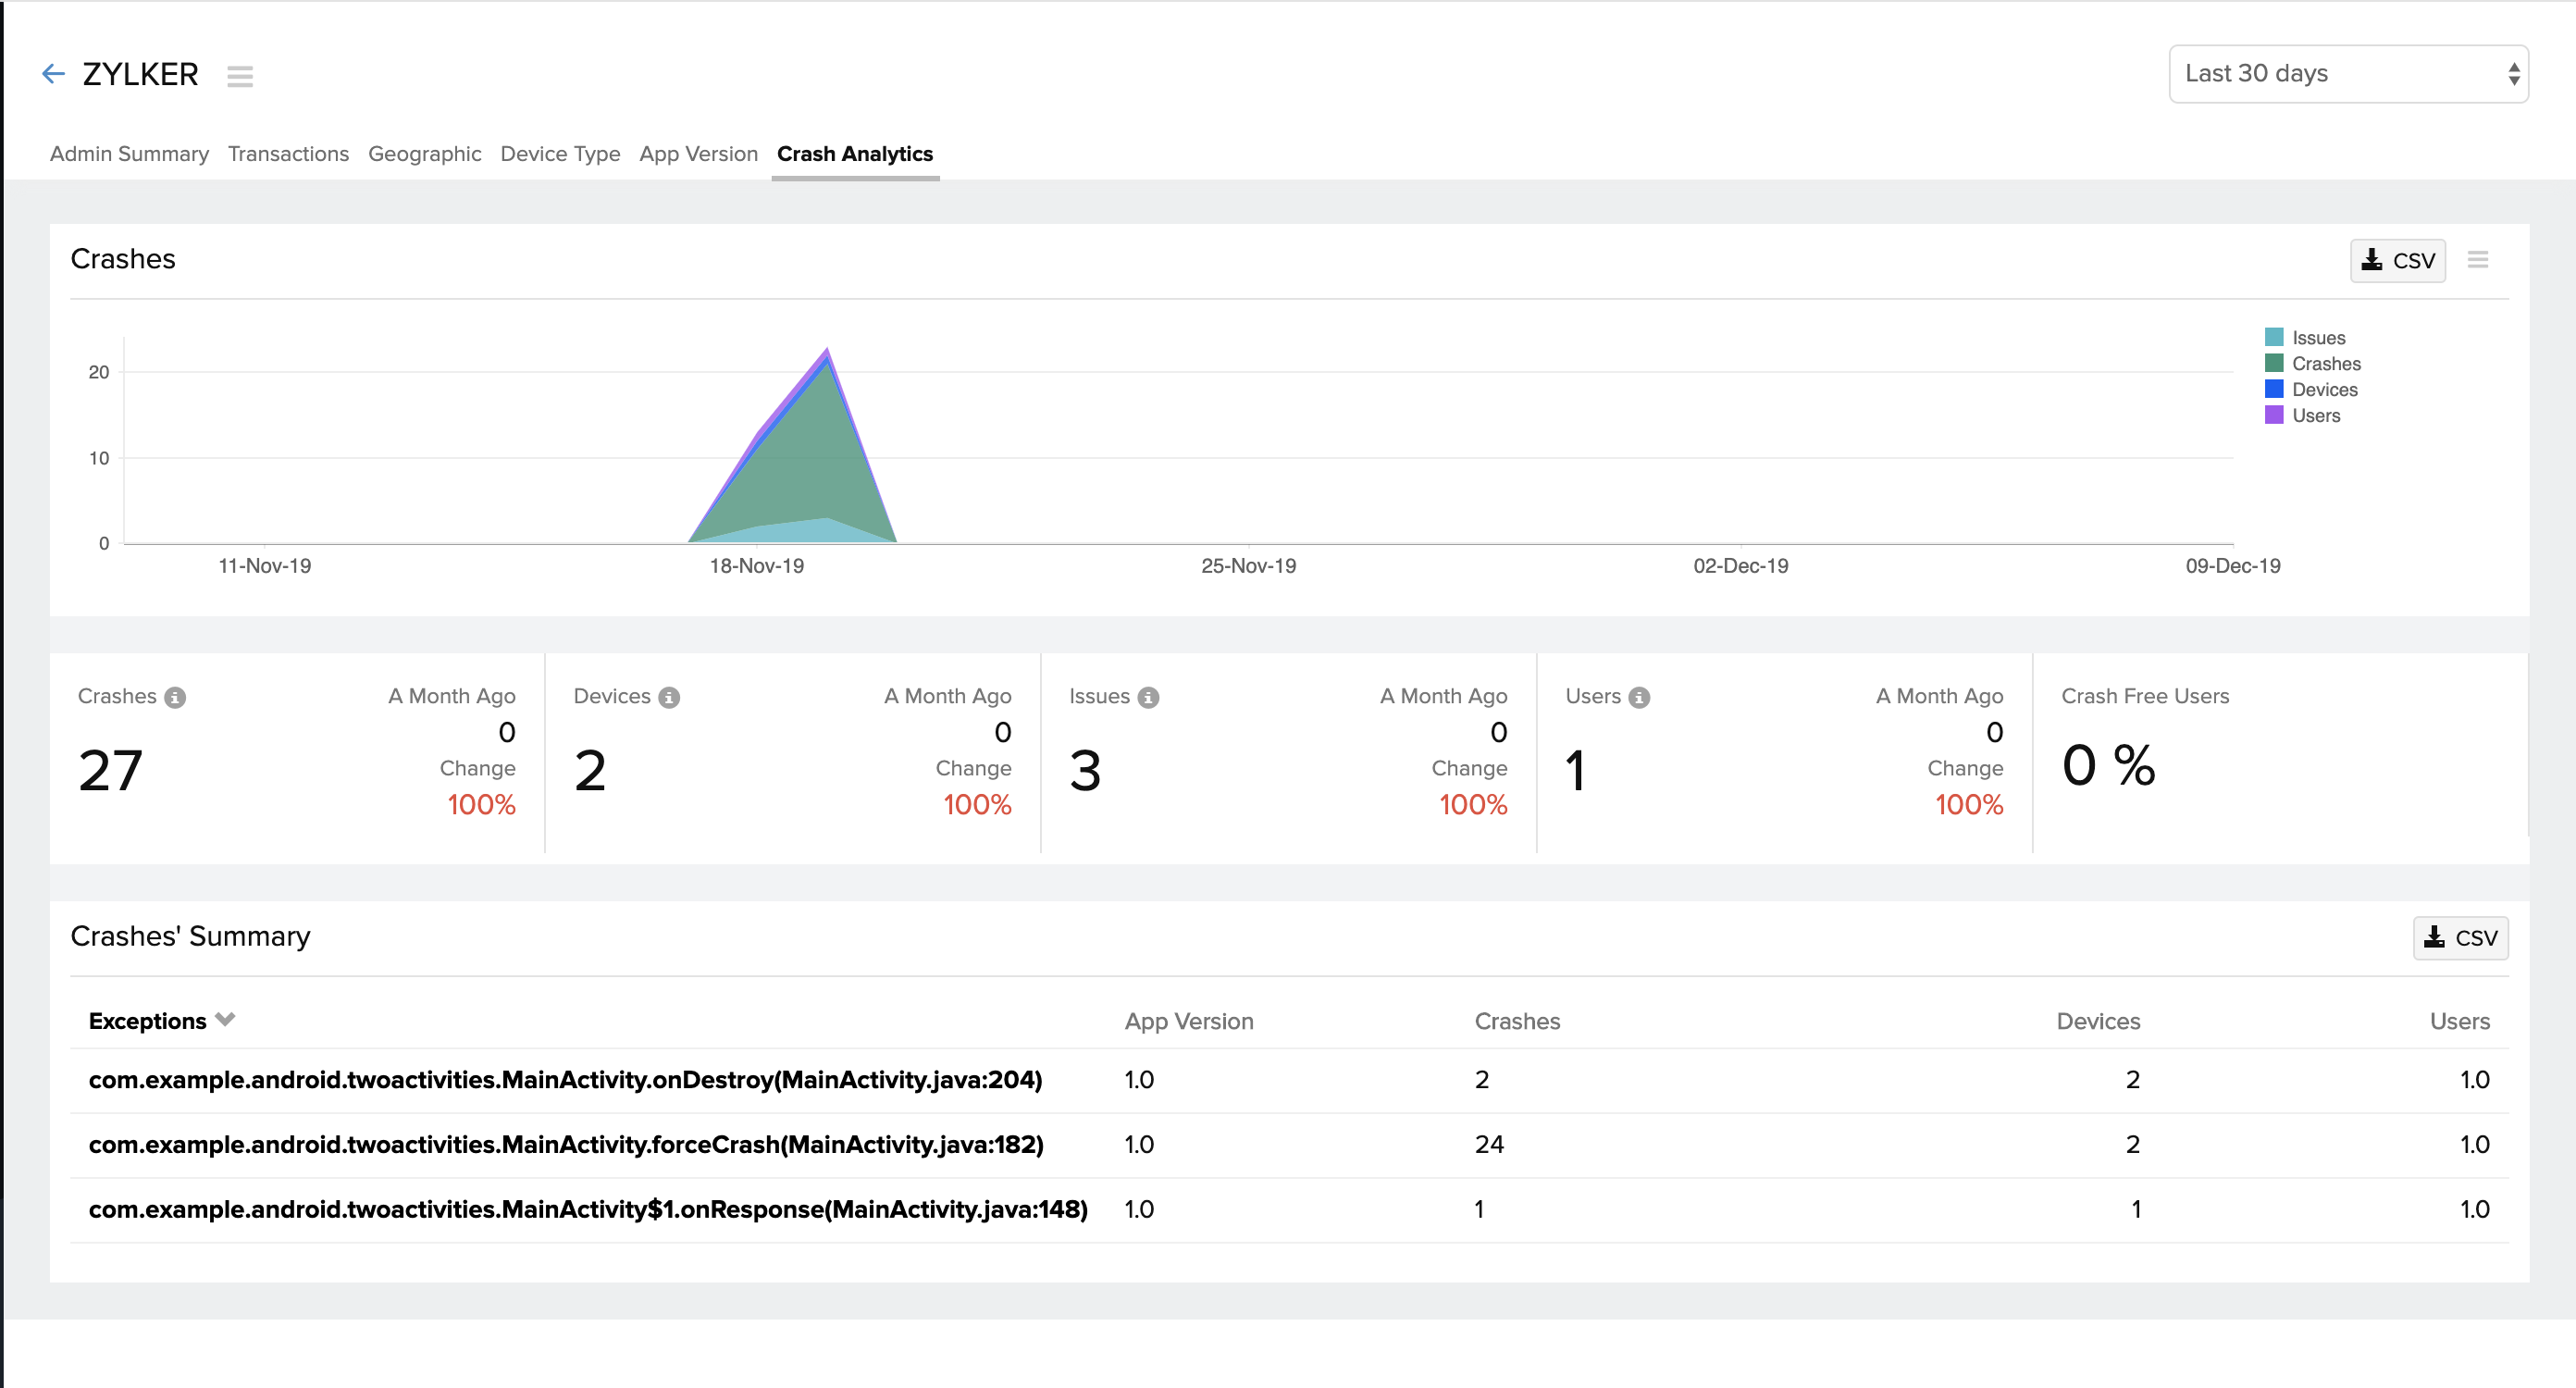
You can click on the exception to find the exact line of error.
Configure alerts?
Configure Alerts
Get notified when your application response time exceeds the specified threshold level, by configuring alerts.
You can set alerts as Trouble or Critical based on the severity level.
Follow the steps below to configure alerts:
- Log in to your Site24x7 account > APM > Android.
- Select your application > Hover over the hamburger icon > Edit monitor details.
- Under Configuration Profiles, click on (+) to add a new threshold and availability profile.
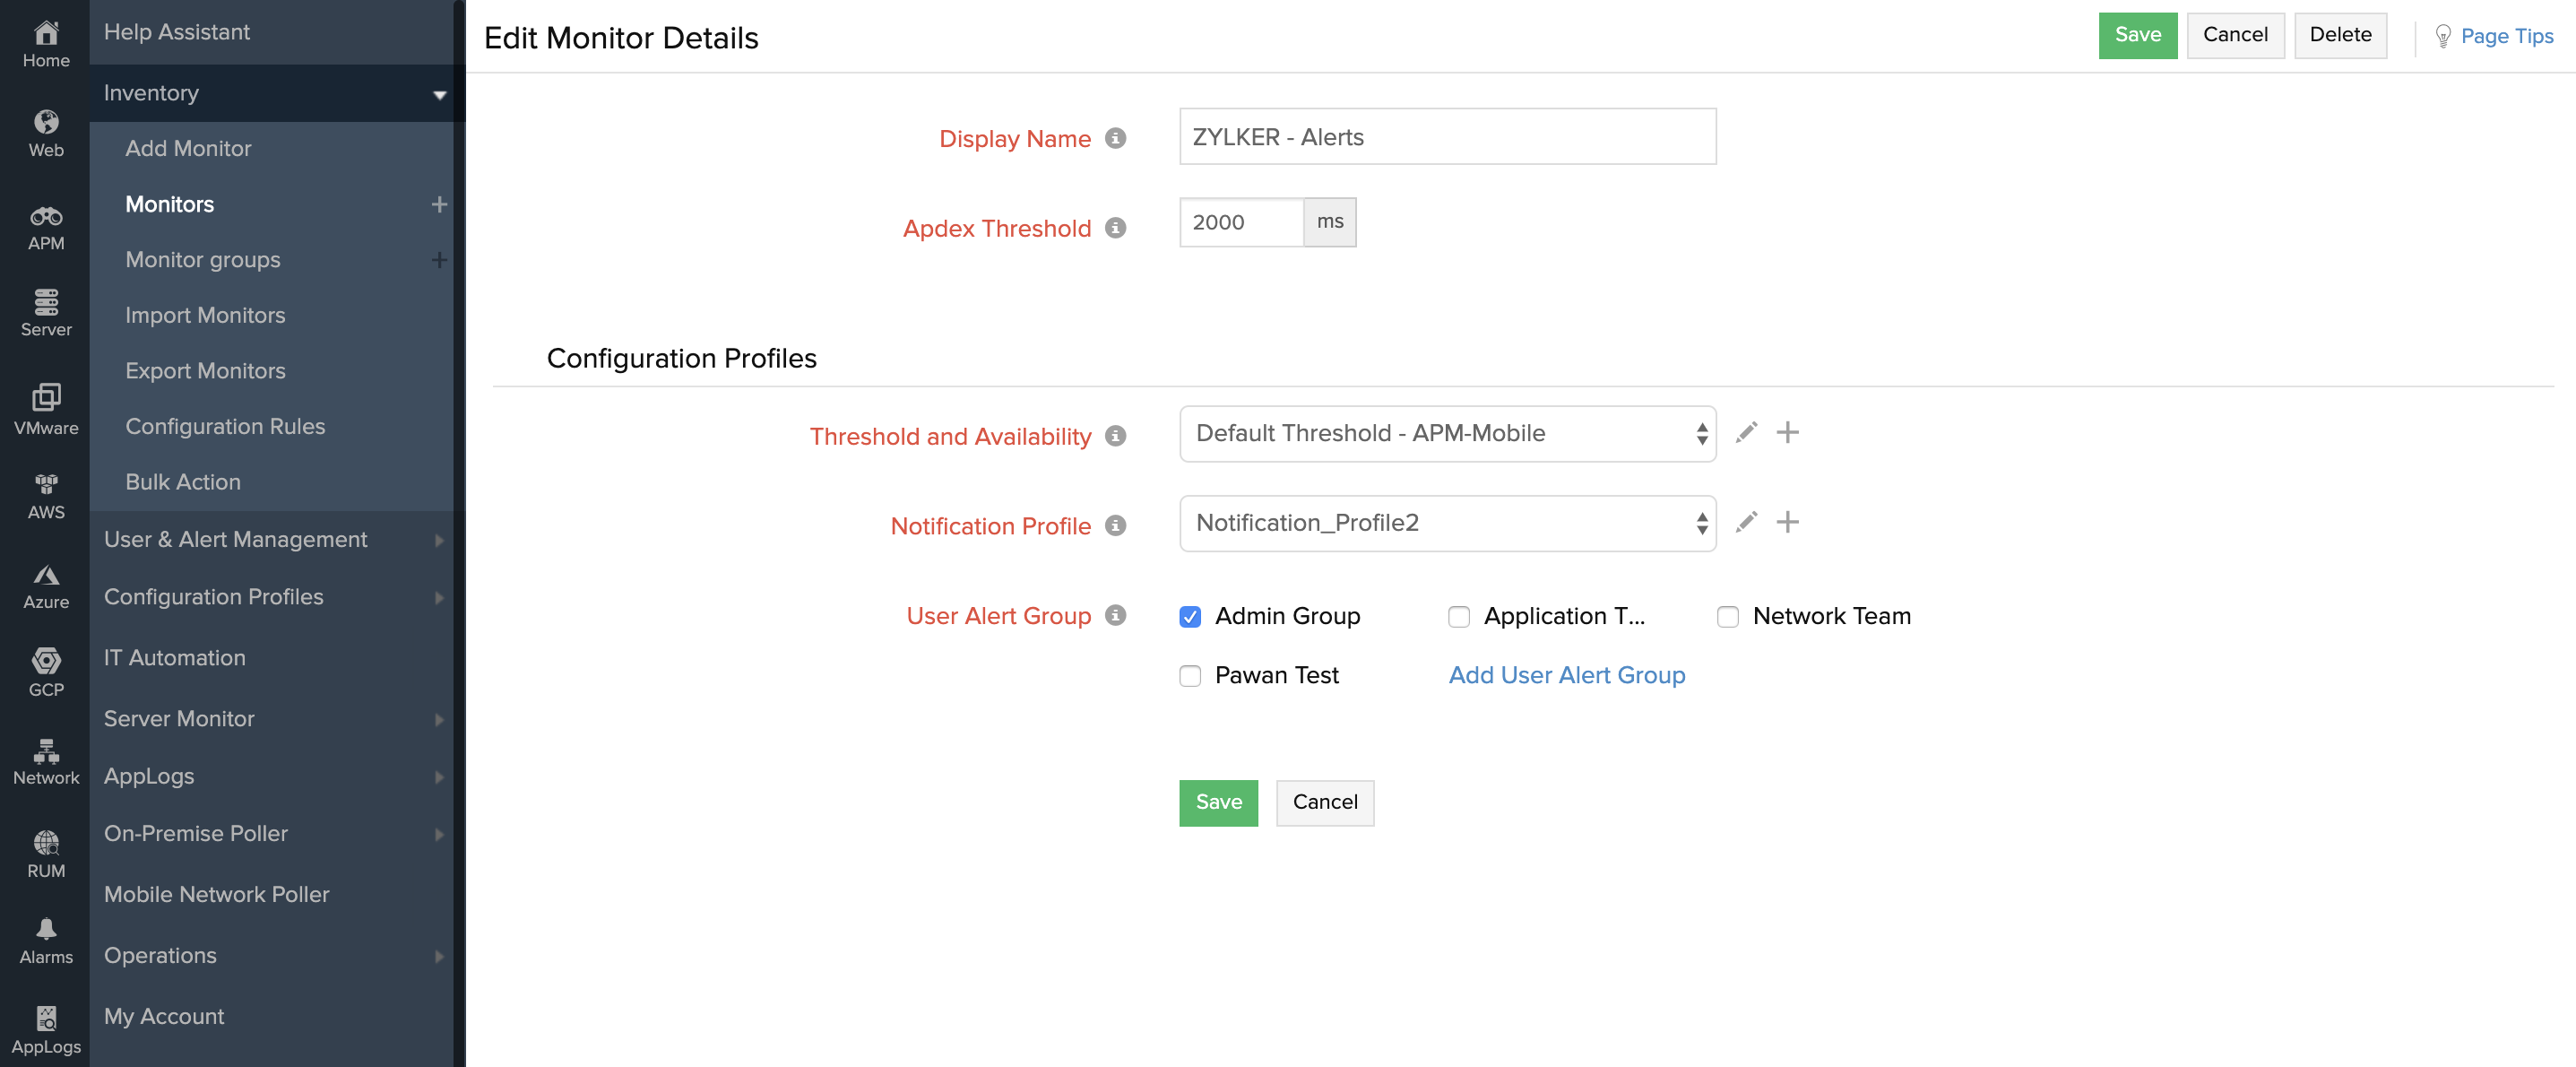
- Select your mobile application in Monitor Type and give a name for your alert.
- Enter the average response time value - you will receive alerts when your application response time exceeds this value.
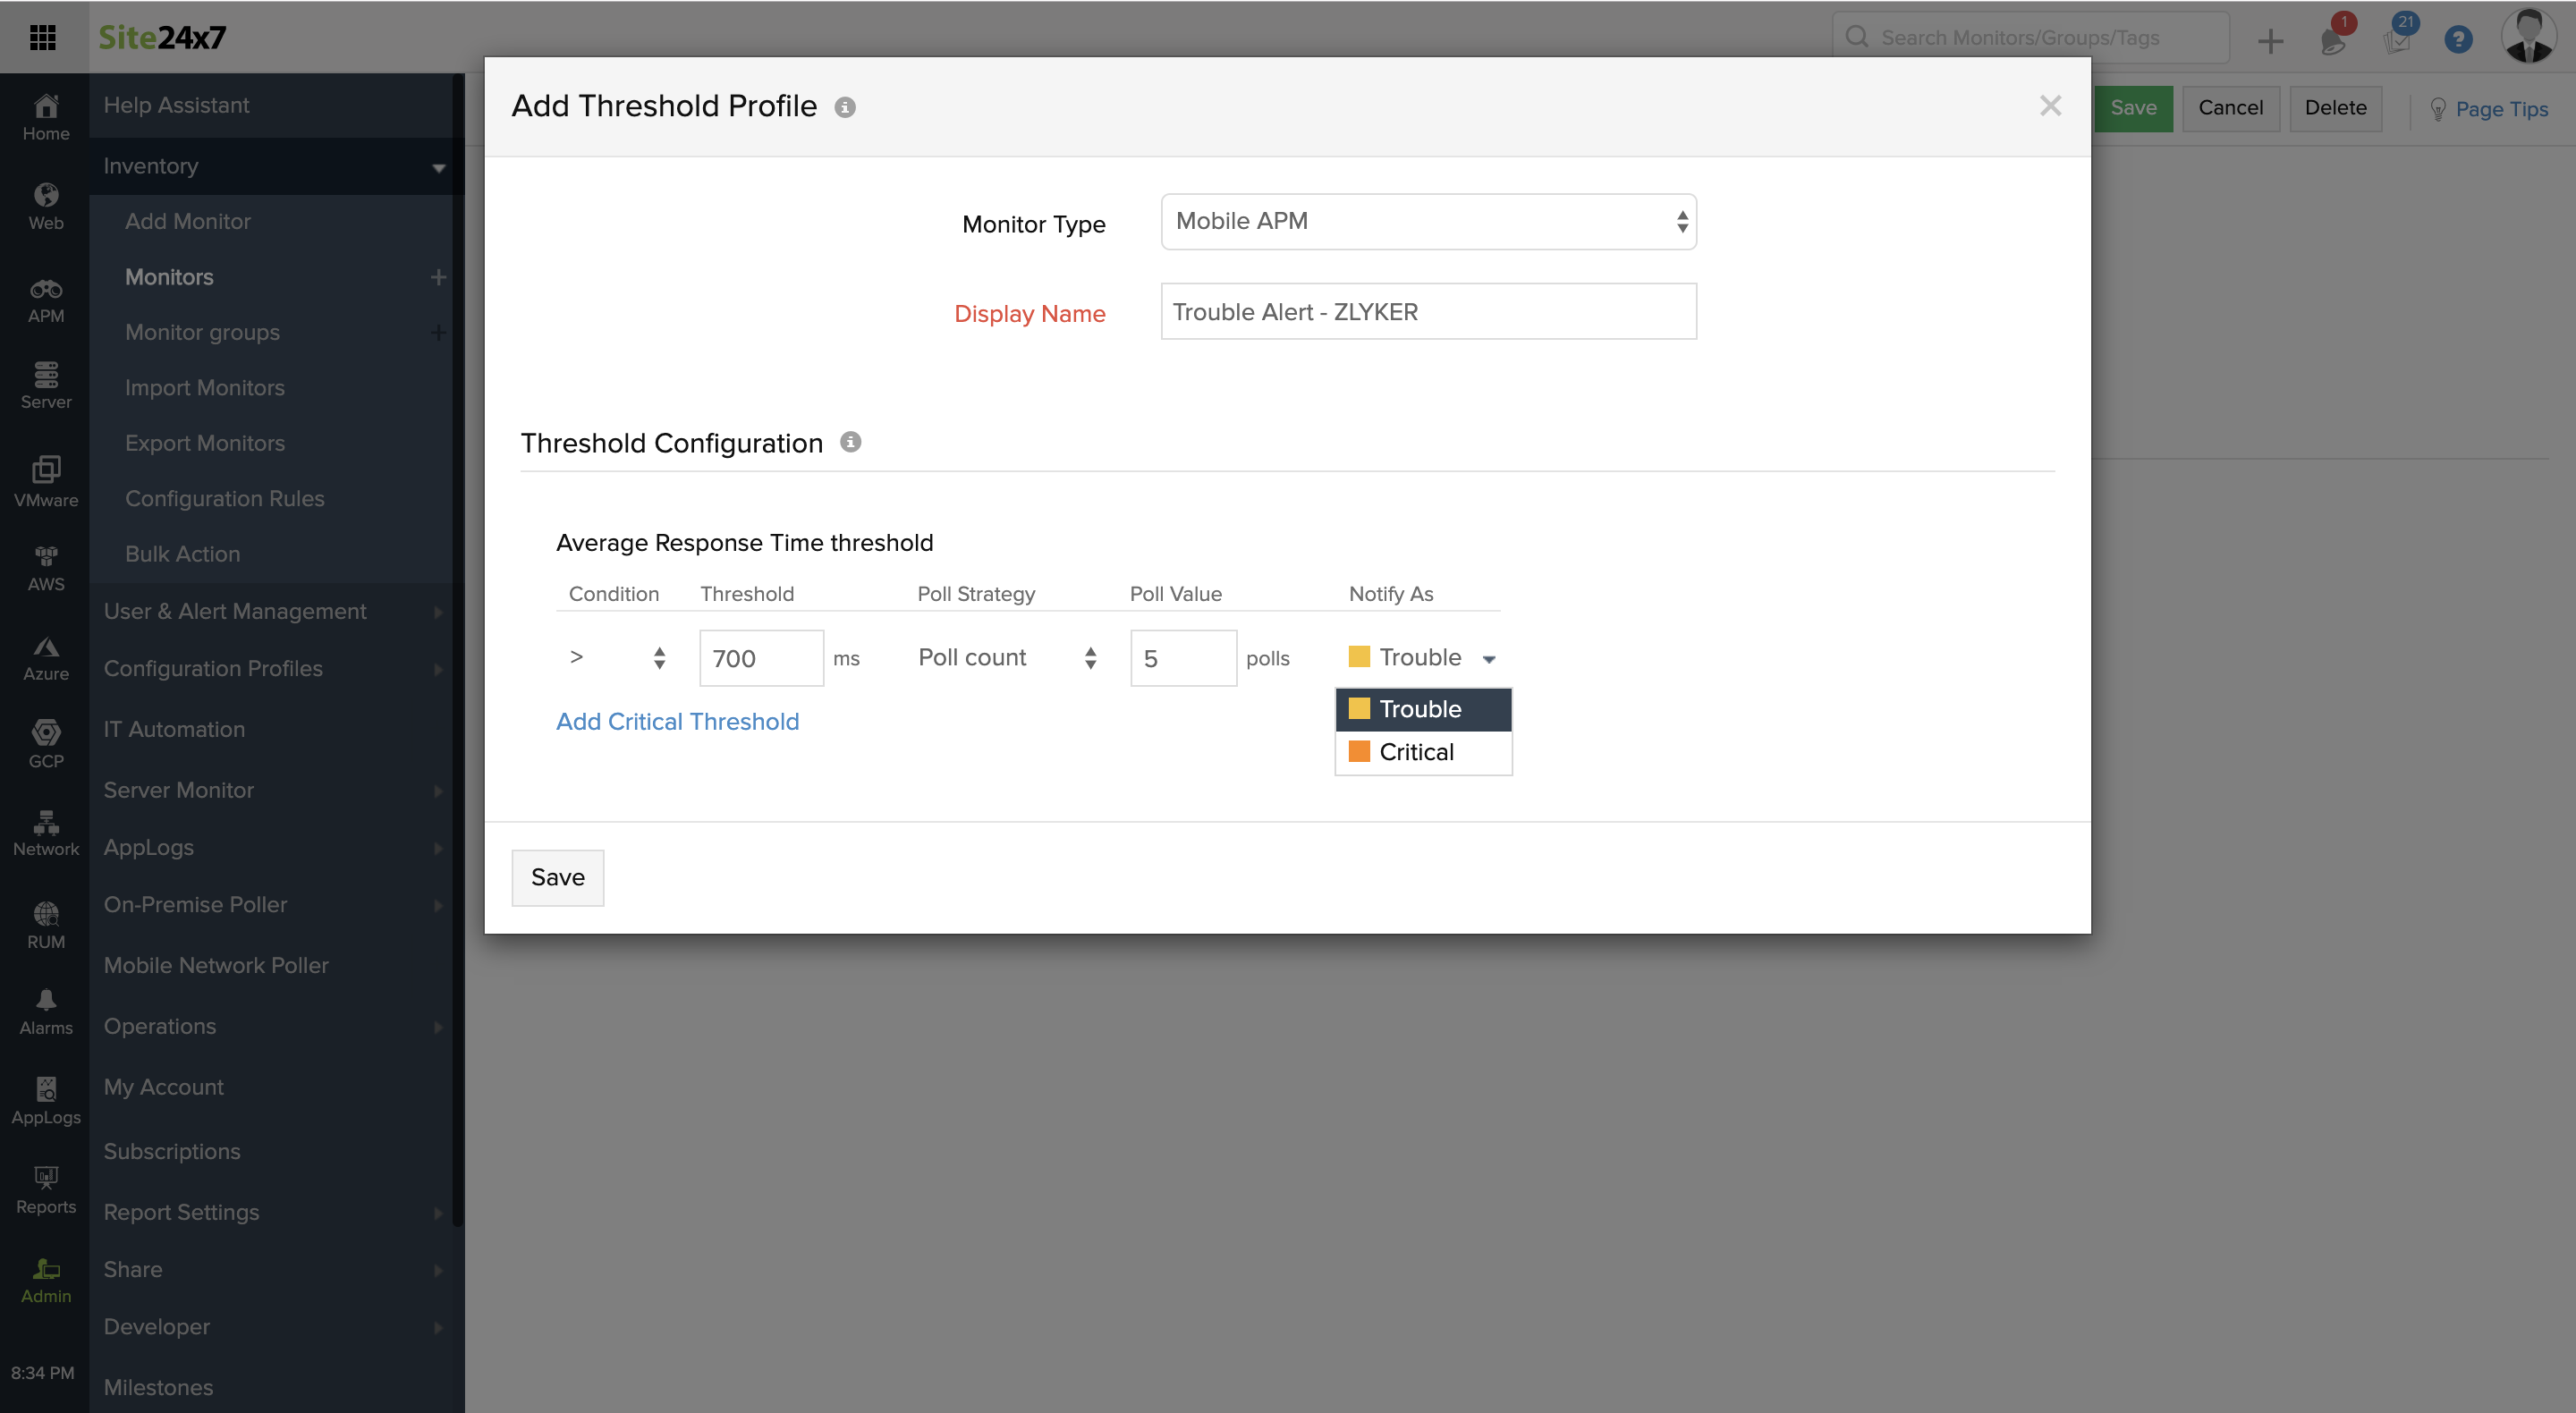
- Click Save
You can tweak the settings in Notification profile, to decide when to receive alerts when your application goes DOWN. Additionally, you can also configure user alerts groups - this lets you decide who should receive alerts when triggered.
Custom APIs
Custom APIs are used to set dynamic values for user IDs, track custom events, capture screens, and more. This document will explain the various types of custom APIs available in Site24x7 and the syntax to use them.
Available APIs:
- Initializing the SDK
- Custom User ID
- Transactions
- HTTP Call
- Screen
- Environment
- Flush
- Exclude HTTP Calls
- Exclude Screens
- Fragment Support
1. Initializing the SDK
You can use the API below to initialize the SDK with a custom upload interval. By default, the data upload interval is set to 60 seconds.
Syntax:
/**
* Initializes the APM agent.
* @param {Context} context
* The application context.
* @param {String} appKey
* The application key.
* @param {int} uploadIntervalSeconds
* The interval in seconds at which to upload data to the site24x7 servers. The default is 60 seconds.
* @throws MalformedURLException
* if {@code serverUrl} could not be parsed.
*/
Apm.startMonitoring(getApplicationContext(), "appKey", uploadInterval)
2. Custom User ID
By default, a unique user ID is generated by the SDK. If you want to customize user IDs, you can do so by implementing the following syntax. This comes in handy when you want to track metrics or debug issues specific to a particular user.
Syntax:
/**
   *@param {String} userId
   */
Apm.setUserId("user@zylker.com")
3. Transactions
You can use the API below to track custom events with application-specific timing.
Syntax:
/**
   *Transaction (can contain multiple components)
   *@param {String} transactionName
   *Component
   *@param {String} transactionName
   *@param {String} componentName
   */
Transaction transaction = Apm. startTransaction ( "List Articles" );
Component httpComponent = transaction .startComponent( Component.TYPE_HTTP );
Component articlesComponent = transaction .startComponent( "Download Articles" );
    // Download articles
     transaction .stopComponent( articlesComponent );
     for (Article article in articles ) {
     Component thumbnailComponent = transaction .startComponent( "Download Thumbnail" );
    // Download thumbnail
     transaction .stopComponent( thumbnailComponent );
     }
transaction .stopComponent( httpComponent );
Apm. stopTransaction (transaction);
4. HTTP Call
By default, network requests that use the following networking libraries are automatically captured.
- java.net.HttpURLConnection
- javax.net.ssl.HttpsURLConnection
- OkHttpLibrary (will provide Interceptor)
Syntax:
/**
   *Introducing Site24x7LoggingInterceptor for tracking HTTP calls made using OkHttp Library or Retrofit.
   */
OkHttpClient client = new OkHttpClient.Builder()
     .addNetworkInterceptor(new Site24x7LoggingInterceptor())
     .build();
Using the request body:
Request request = new Request.Builder()
     .url(url)
     .build();ResponseBody body = client
     .newCall(request)
     .execute()
     .body();Using Retrofit:
Retrofit retrofit = new Retrofit.Builder()
     .baseUrl(BASE_API_URL)
     .client(client)
     .build();
If you want to add more HTTP calls, use the API below.
Syntax:
/**
   *@param {String} url
   *@param {String} requestMethod
   *@param {long} startTime
        You can get it from System.currentTimeMillis()
   *@param {long} loadTime
        Measured in Millis
   *@param {int} responseCode
   *@param{String} screen
        The screen in which the HTTP call is made.
   */
Apm.addHttpCalls("https://www.example.com", "GET", 1642743078700, 526, 200, "paymentscreen" )
5. Screen
By default, all screens are captured; however, if you want to add missing screen, use the API given below.
Syntax:
/**
   *@param {String} screenName
   *@param {String} orientation
   *@param {long} loadTime measured in millis
   *@param {long} startTime measured in millis
   */
Apm.addScreen("DetailScreen", "portrait", 50, 1642743078700)
6. Environment
You can use the API below to set custom environment details for filtering data across various environment setups like development, debug, production, or release.
Syntax:
/**
   *@param {String} environment
        Custom environment types like debug, release, or beta release.
   */
Apm.setEnvironment("release")
7. Flush
You can use the API below to immediately upload recorded data to the server instead of waiting for the next upload interval. By default, the flush interval is set to 60 seconds.
Syntax:
Apm.flush()
If there's no network available, data will be held in the queue until the next upload interval. If you've configured a long upload interval, you may need to manually flush data when your activities or services are destroyed.
8. Exclude HTTP Calls
You can exclude custom URLs from tracking by passing a list of URLs as an argument to the API below.
Syntax:
/**
@param {Lis<String>} listOfUrls
*/
Apm.excludeHttpCalls( Arrays.asList("example.com") )
9. Exclude Screens
You can exclude custom screens from tracking by passing a list of screens as an argument to the API below.
Syntax:
/**
   @param {List<String>} listOfScreens
   */
Apm.excludeScreens( Arrays.asList("customScreenName") )
10. Fragment Support
You can use the following line of code to track fragments automatically.
Syntax:
this.getSupportFragmentManager().registerFragmentLifecycleCallbacks(new Site24x7FragmentLifeCycleCallbacks(), true);
Add the above line to the onCreate method of the Launching Activity.
/**
*Enables fragment support for other activities
*/
Apm.enableFragmentSupport()
Release Notes
Version 2.2.2
02 April 2024
Enhancement:
- Support for checking whether the Activity is an instance of FragmentActivity when registering with fragment lifecycle callbacks.
Bug fix:
- The NullPointerException issue when handling lifecycle callbacks for React Native has been fixed.
Version 2.2.1
05 February 2024
Enhancement:
- Support for the Flutter framework.
Version 2.2.0
21 December 2023
New Features:
The following are the mobile vitals features:
- Support for capturing application start up time (both warm and cold launches).
- Support for automatically calculating slow & frozen frames for view controllers.
Enhancement:
- The session time has been limited to 15 minutes.
Version 2.1.1
15 November 2022
Issue Fixes:
- java.io.IOException- The unexpected end of stream issue has been resolved.
- java.io.FileNotFoundException- When the HTTP URL name exceeds the maximum allowed characters, this exception is thrown. This issue has been fixed.
Version 2.1.0
13 May 2022
Issue Fixes:
- java.lang.IllegalStateException- The "Monitoring already started" exception has been resolved.
- java.lang.ClassCastException- The exception that occurred while capturing fragments has been resolved.
New Features:
- API for configuring a custom environment.
- API for enabling support for fragments.
- API to begin monitoring with context, application key, and upload interval.
- Support for Retrofit and Okhttp client using Site24x7LoggingInterceptor.
Enhancement:
- Enhanced Crashlytics support.
Version 2.0.0
04 June 2021
Enhancements:
- Support for tracking HTTP calls with the request method, response time, throughput, status codes, platform, and screens.
- Support for tracking screens based on the response time, throughput, and count.
- Support for automatic tracking of views and navigations.
- Support for manually tracking views.
- Tracking of user sessions is enabled, with a session timeout of 60 minutes.
- Support for manually adding user IDs.
- Support for tracking all HTTP calls for the following packages:
- java.net.HttpURLConnection
- javax.net.ssl.HttpsURLConnection
- Support for manually adding any other HTTP calls.
