Collecting Network Load Balancer logs using the Lambda Function
Network Load Balancer access logs provide details about traffic patterns in your network that help you identify and troubleshoot issues with ease. Integrate your Network Load Balancer access logs with Site24x7's log management capability, and utilize an intuitive web client that helps you quickly identify errors. Learn more about log management with Site24x7.
Create a Log Profile
To collect the Network Load Balancer logs you will first need to create a Log Profile. Navigate to Admin > AppLogs > Log Profile > Add Log Profile, and follow the instructions below:
- Profile Name: Enter a name for your Log Profile.
- Log Type: Choose ELB Network Log. If you haven't enabled ELB access logs in your AWS account, please follow the instructions given here.
- Log Source: Choose Amazon Lambda.
- Click Save.
- Configure the Lambda function as described here.
Configure the Lambda Function
- Choose Lambda from the Services drop-down list, and choose Create Function. Select Author from scratch, define a name for the function, and choose Python 3.7 as the Runtime.
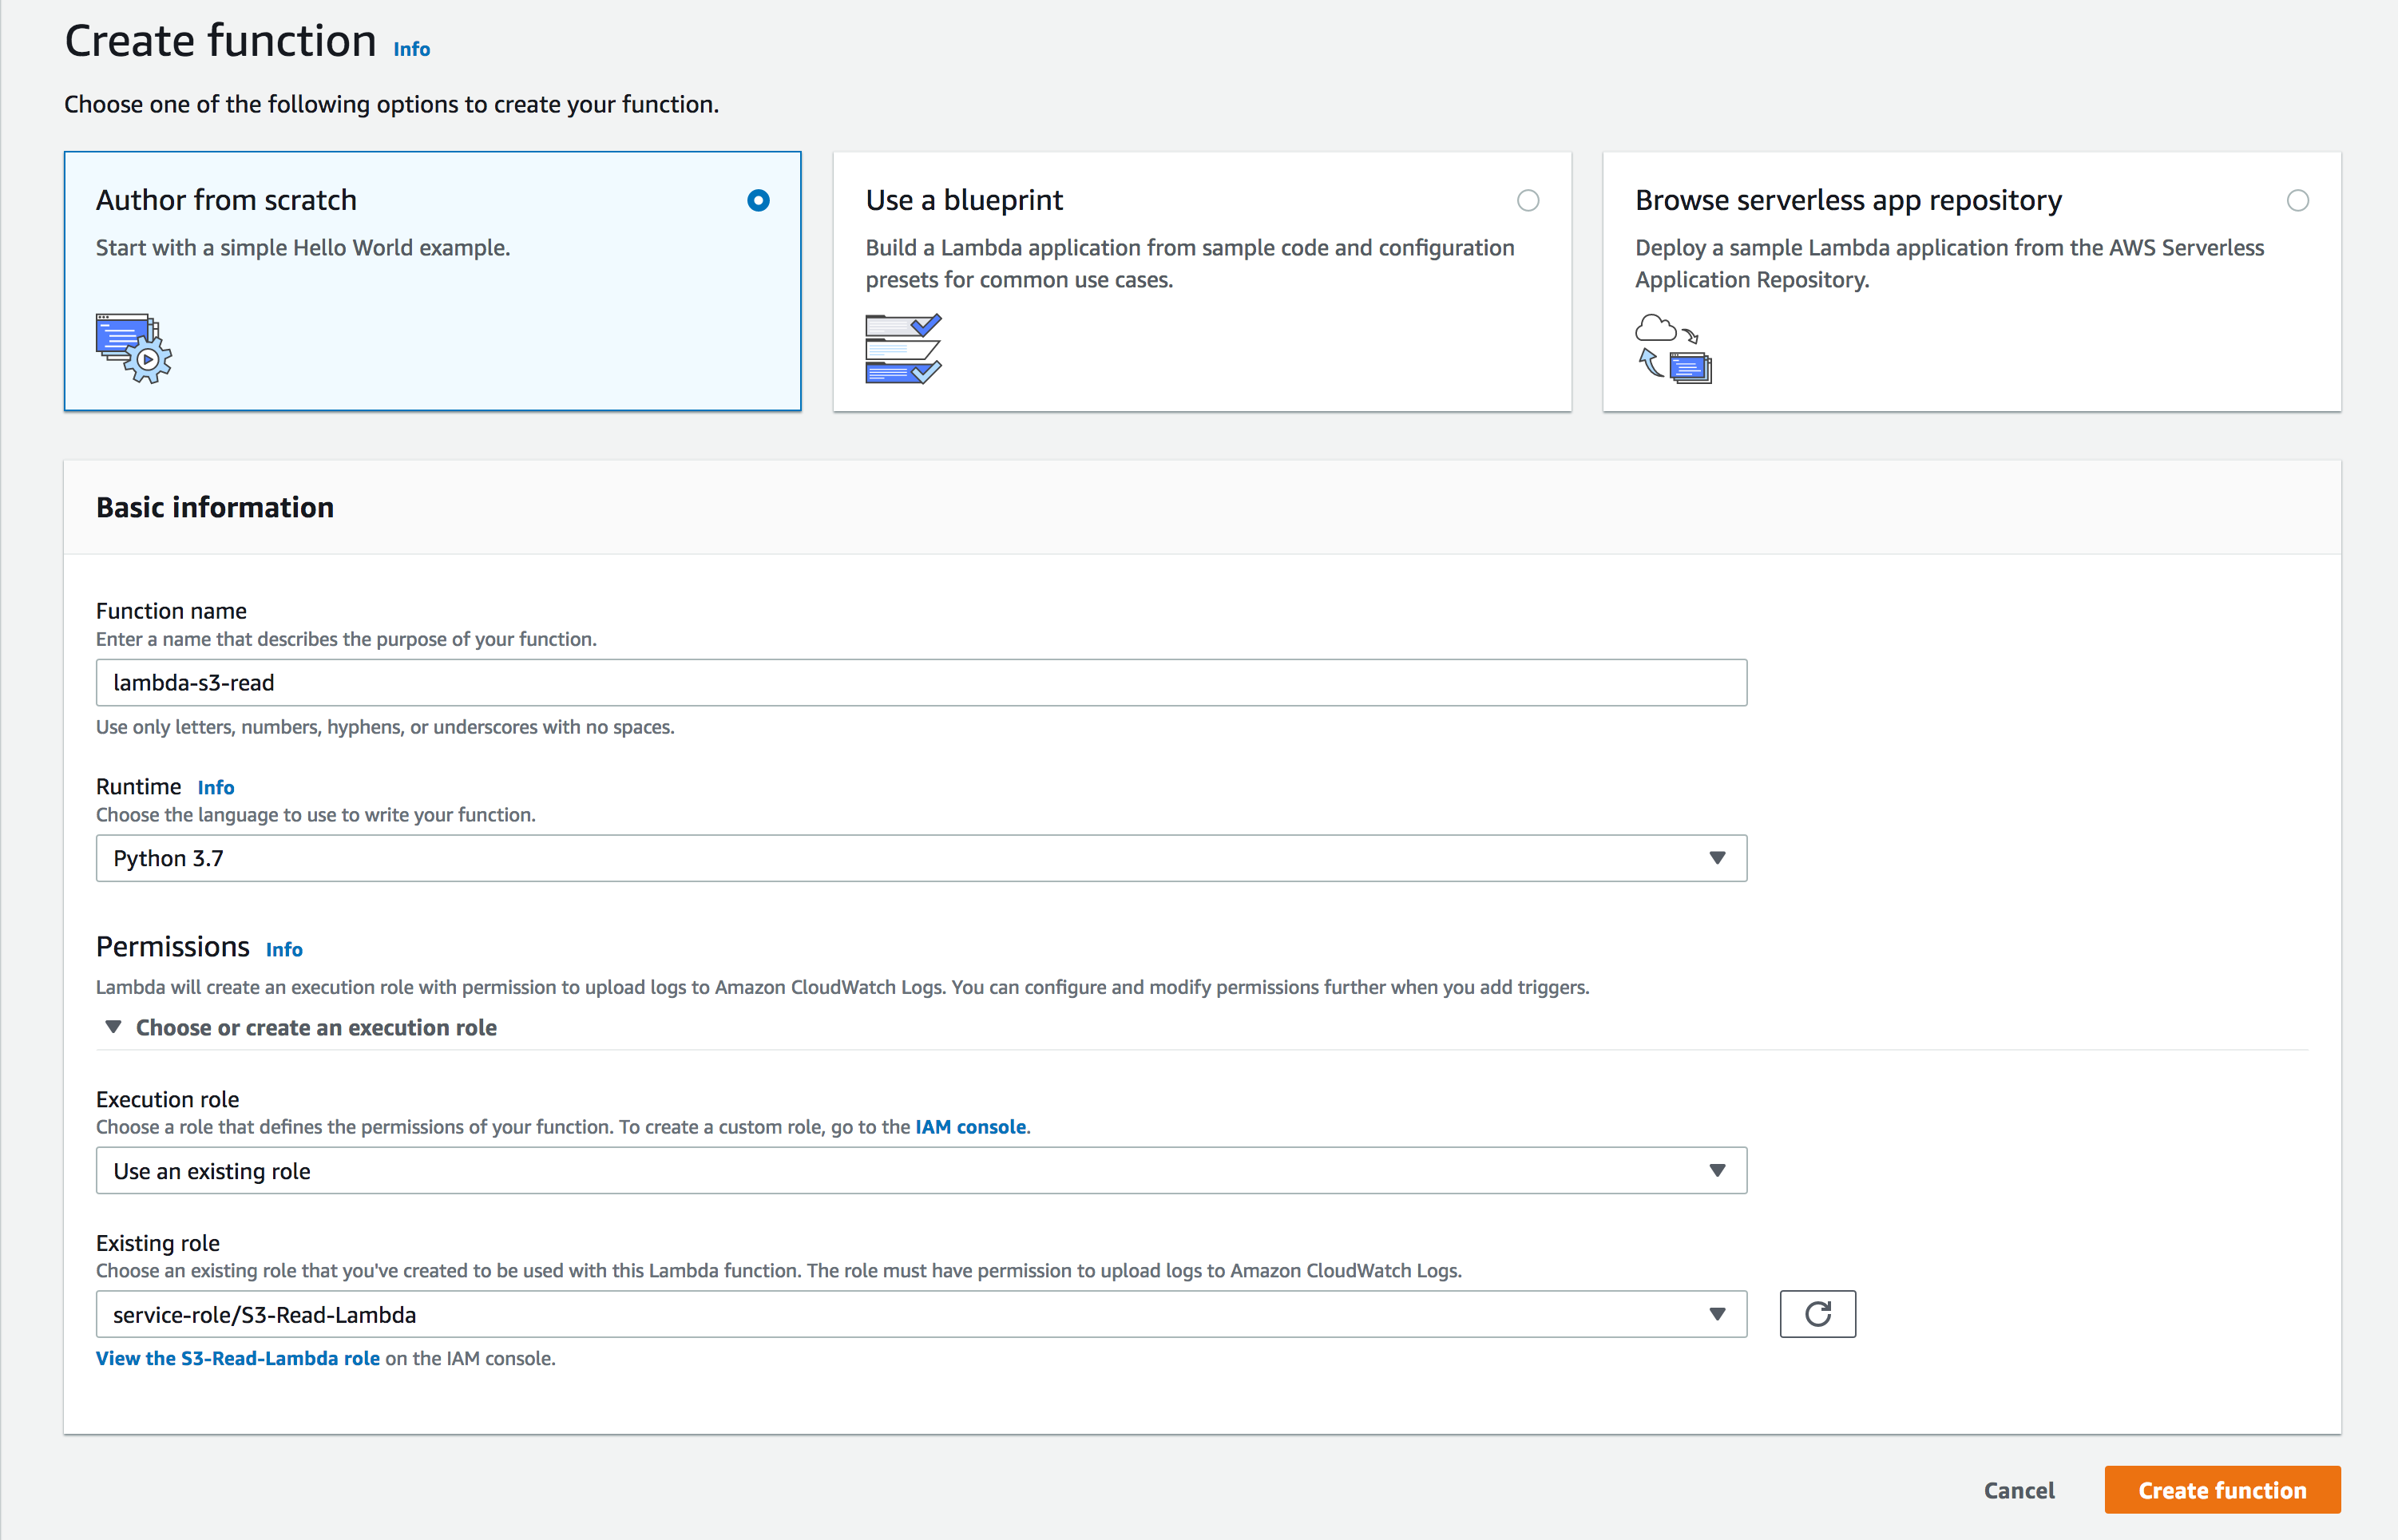
- Permissions: You can choose an existing IAM role or create a new role from the AWS Policy Template. From the Policy Template drop-down select Amazon S3 Object Read-only permission, and enter a role name. You also have the option to create a new user role and extend permission to other services as well.
- Add triggers: Scroll down to choose S3 Bucket. Any log file added to the S3 bucket will be sent to Site24x7 by the Lambda Function.
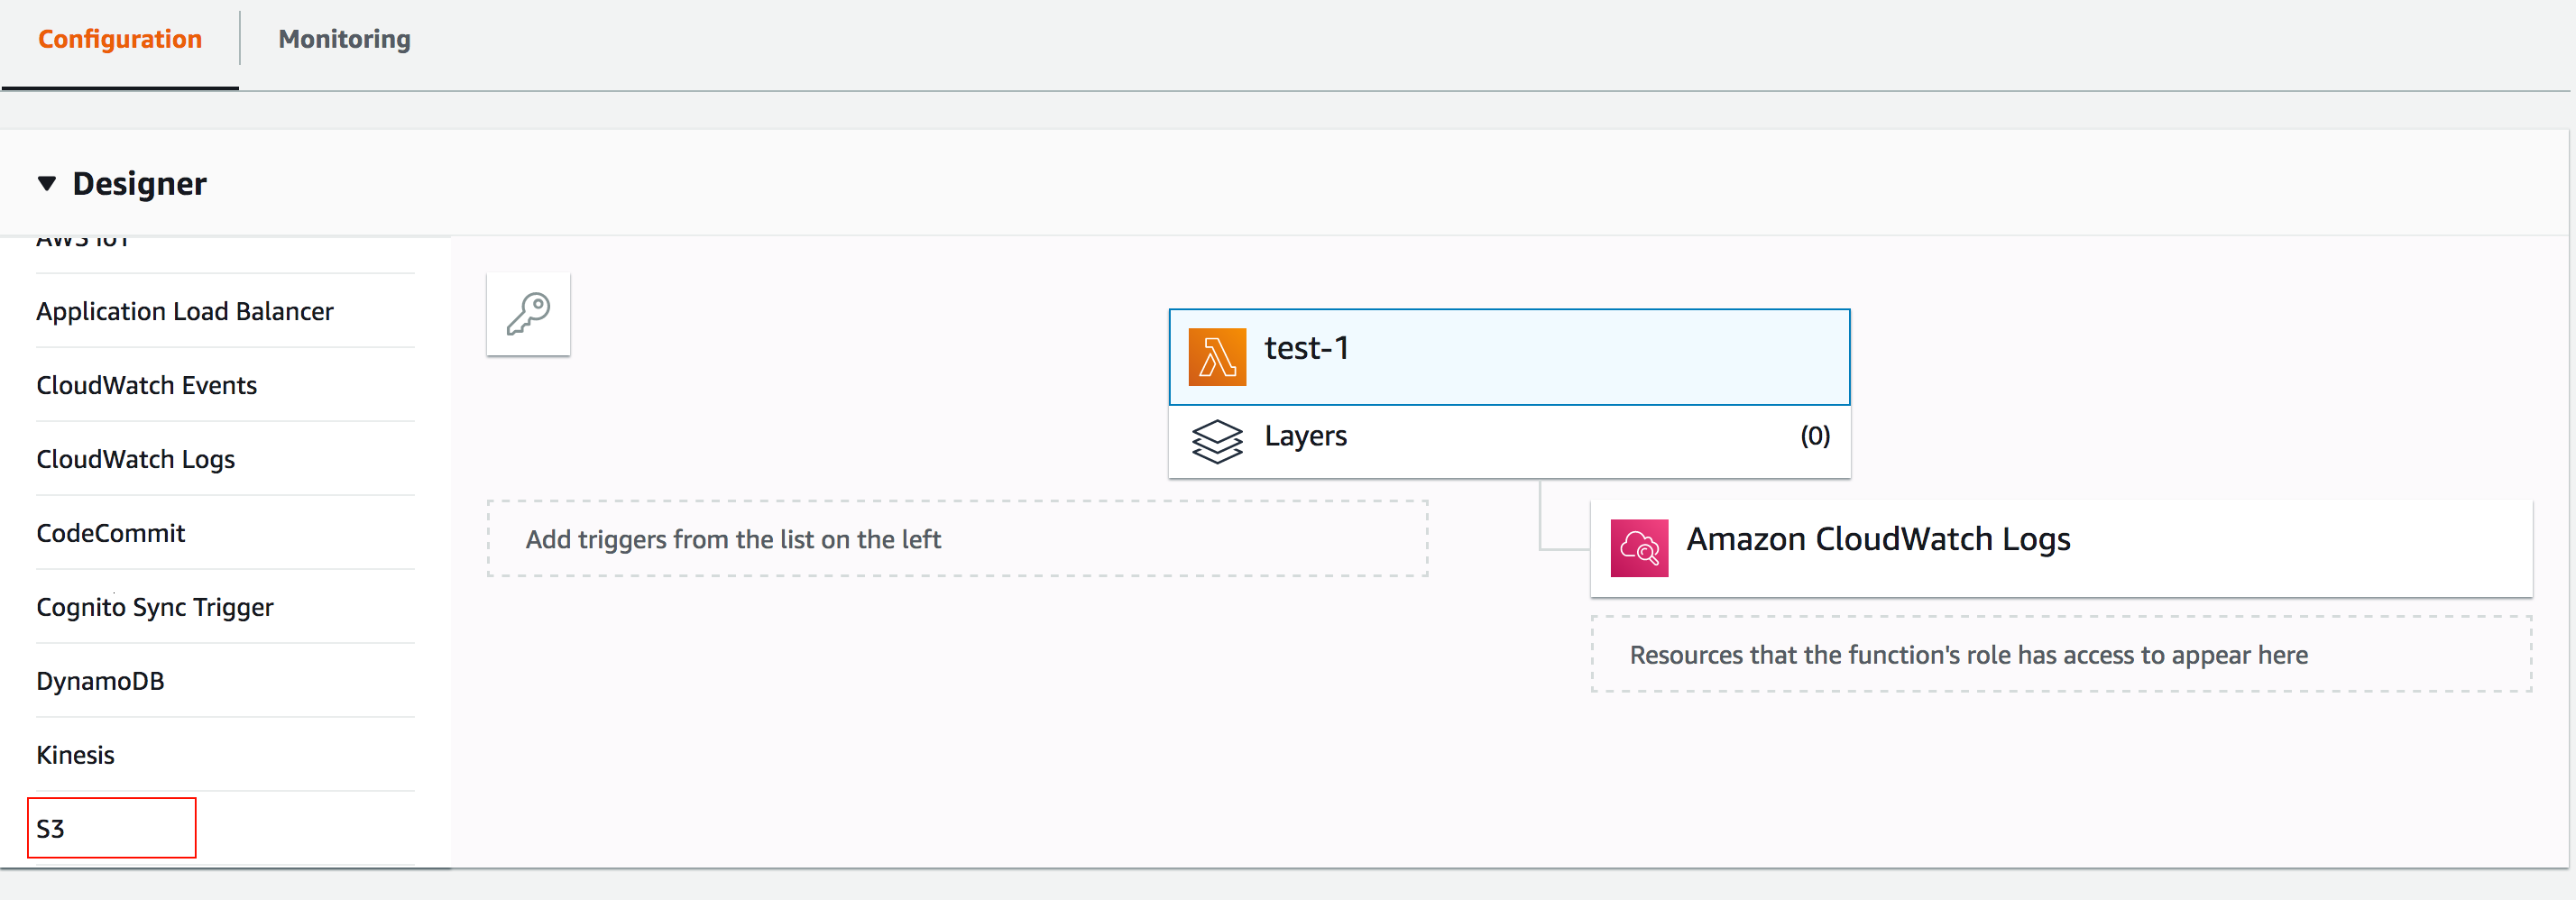
- Configure Triggers
- Bucket:Enter the name of the S3 bucket from which logs will be collected.
- Event type: Choose All object create events.
- Click Add.
- In the window that opens, click on the Lambda Function as shown:

- Scroll to the editor, and place the code provided in the link below:
https://github.com/site24x7/applogs-aws-lambda/blob/master/s3/s3-sender.py
- After entering the code, navigate to the Site24x7 web client, select Admin > Applogs > Log Profile, then select the created Log Profile, and copy the code that appears on the screen as the input for the variable logTypeConfig.
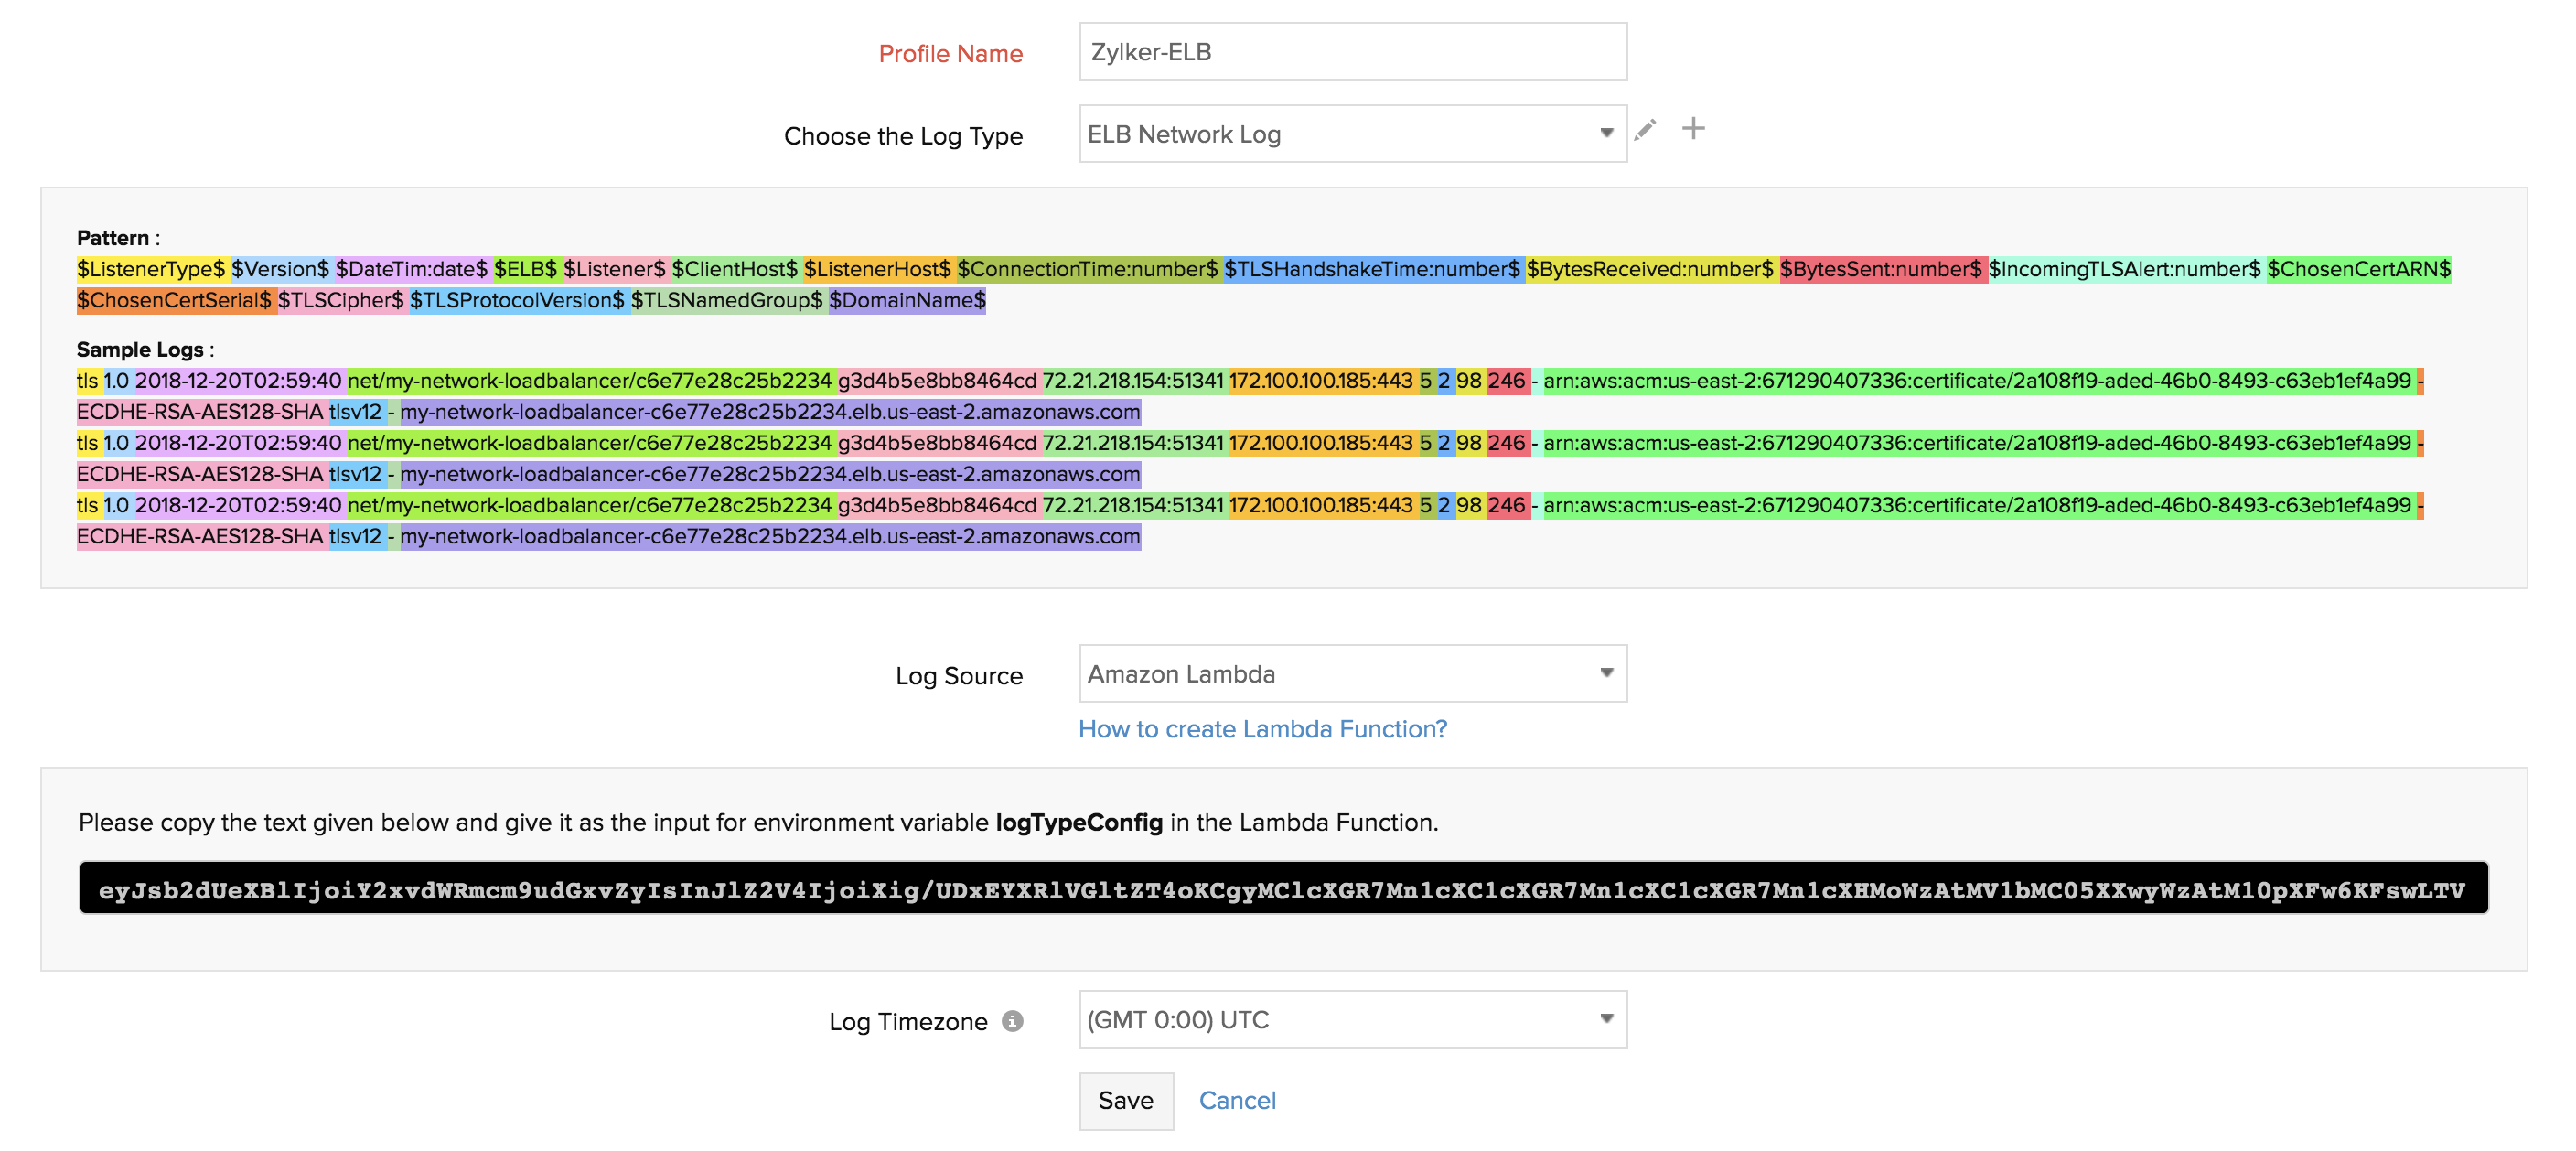
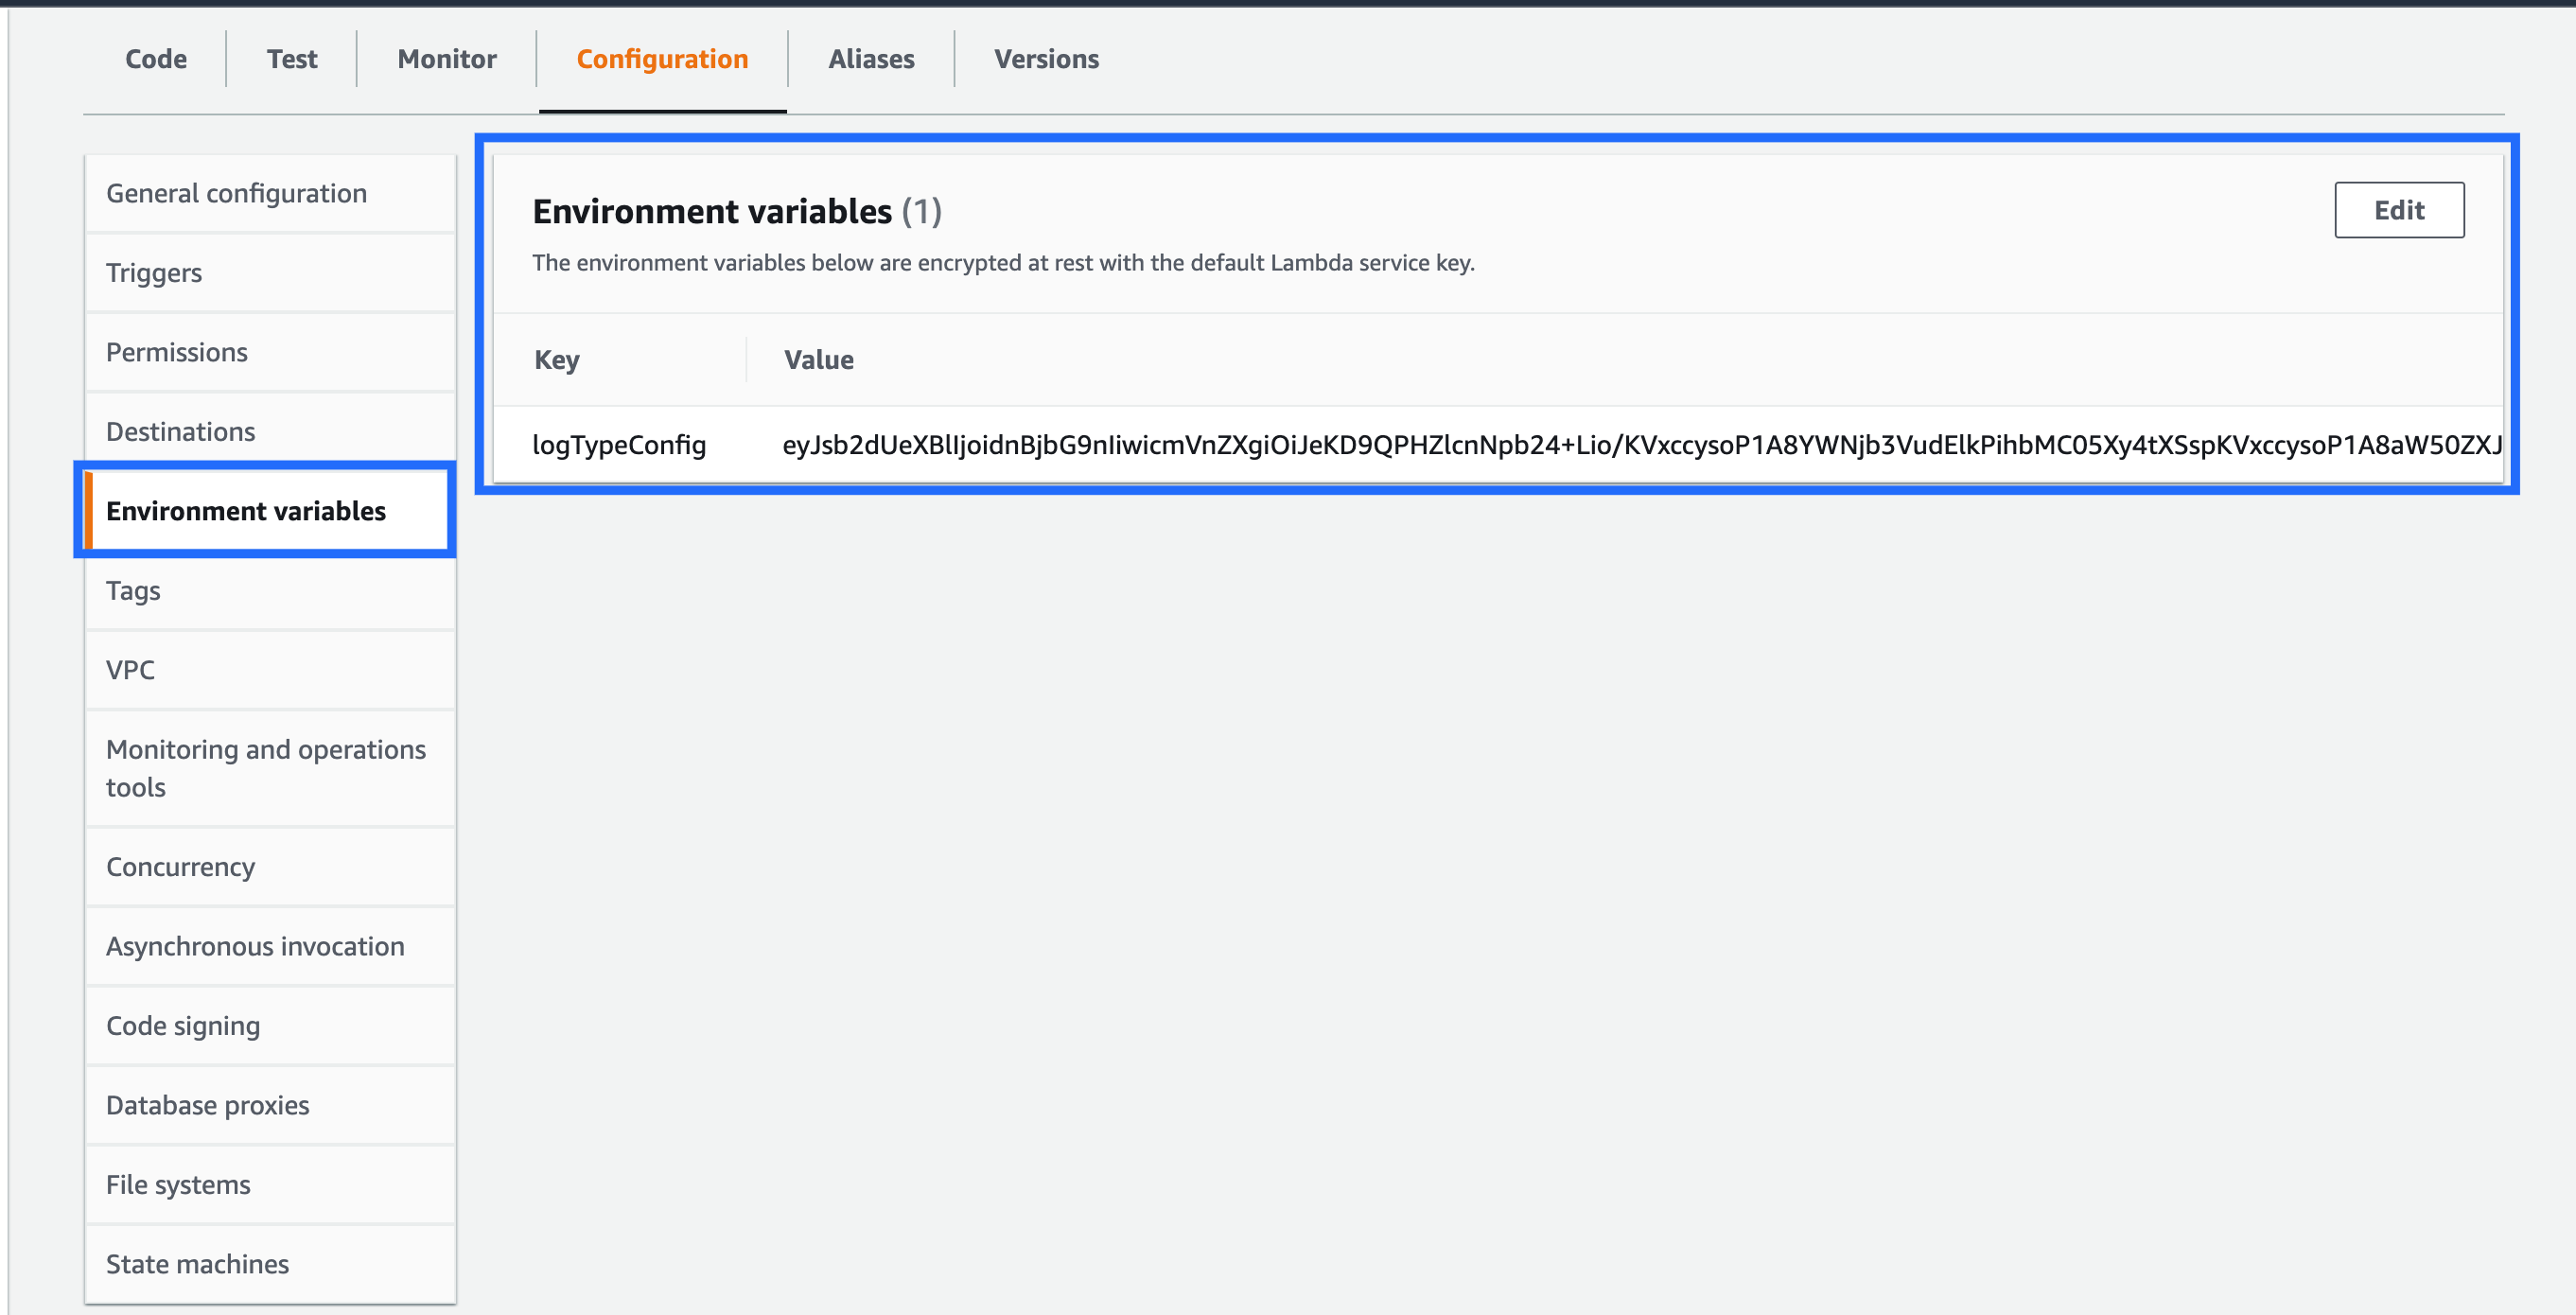
- Paste this code under Environment Variable with the field name logTypeConfig in the AWS console.
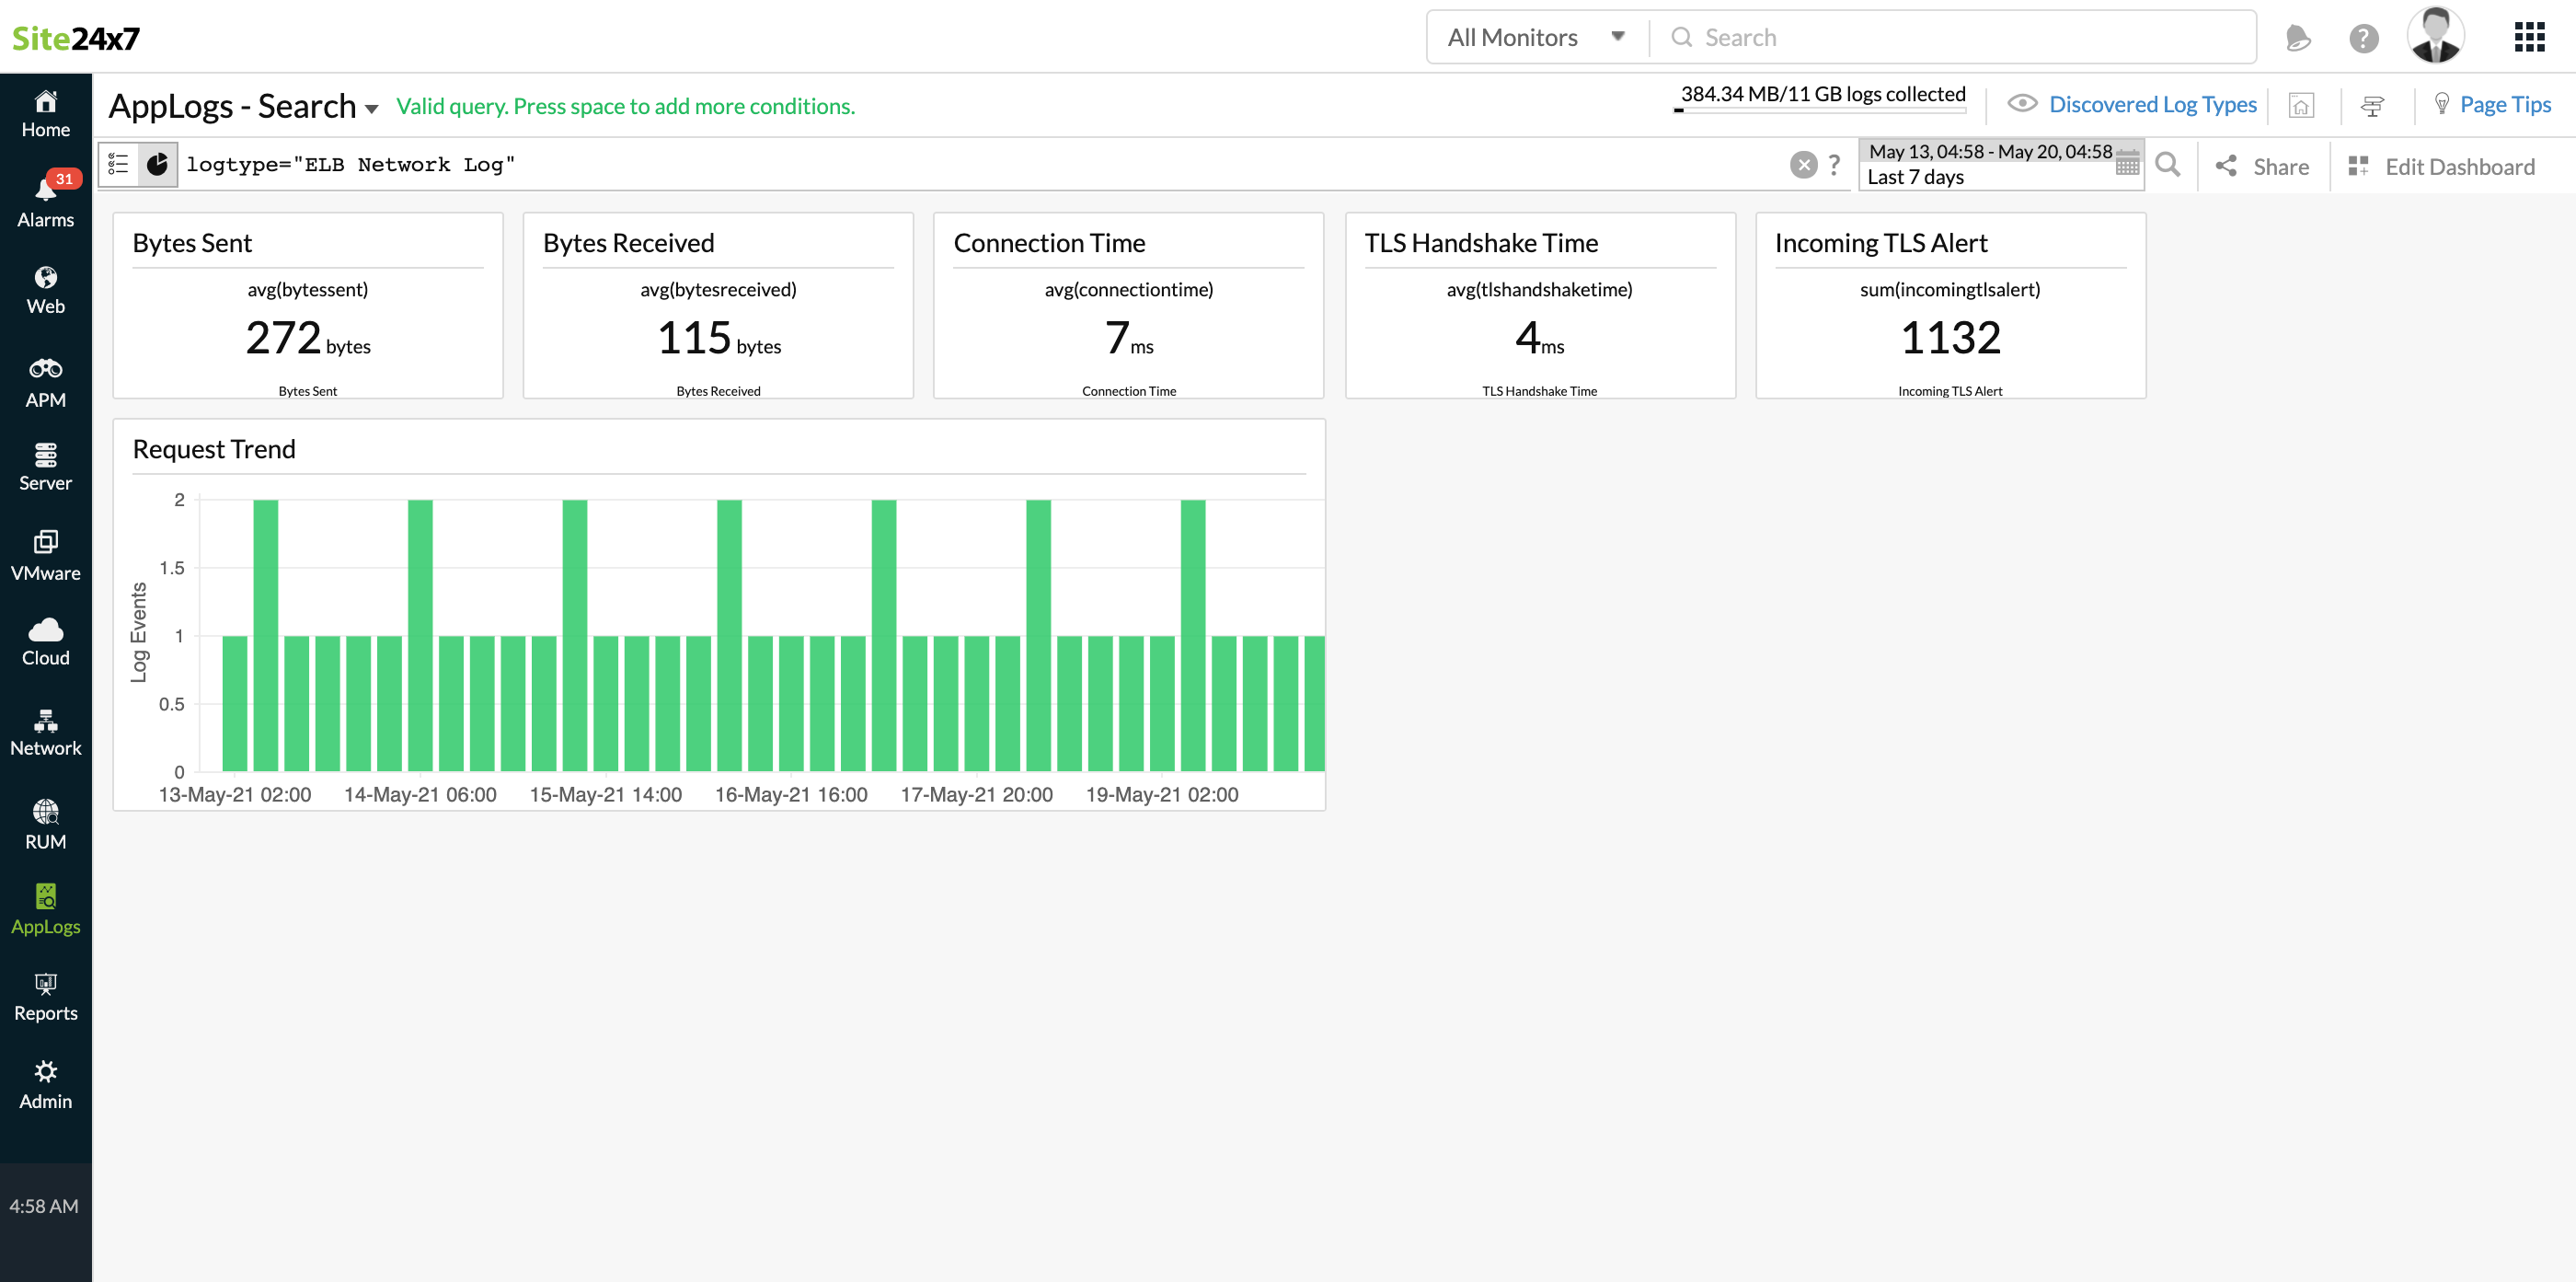
ELB Network Load Balancer logs dashboard
AppLogs creates an exclusive dashboard for every Log Type, and shows a few widgets by default. Here's a list of the widgets available in the Network Load Balancer logs dashboard:
- Average Bytes Transferred
- Bytes Received
- Connection Time
- TLS Handshake Time
- Incoming TLS Alert
- Request Trend
In addition to the default widgets, your saved searches will also be added to the dashboard automatically.
