Envoy Proxy Logs
Envoy proxy is an open-source service proxy that is designed especially for cloud-native applications. This high-performance distributed proxy is intended for both single and large services as well as applications. Site24x7 AppLogs provides built-in support for Envoy proxy logs.
Getting started
1. Log in to your Site24x7 account.
2. Download and install the Site24x7 Server Monitoring Agent (Windows | Linux).
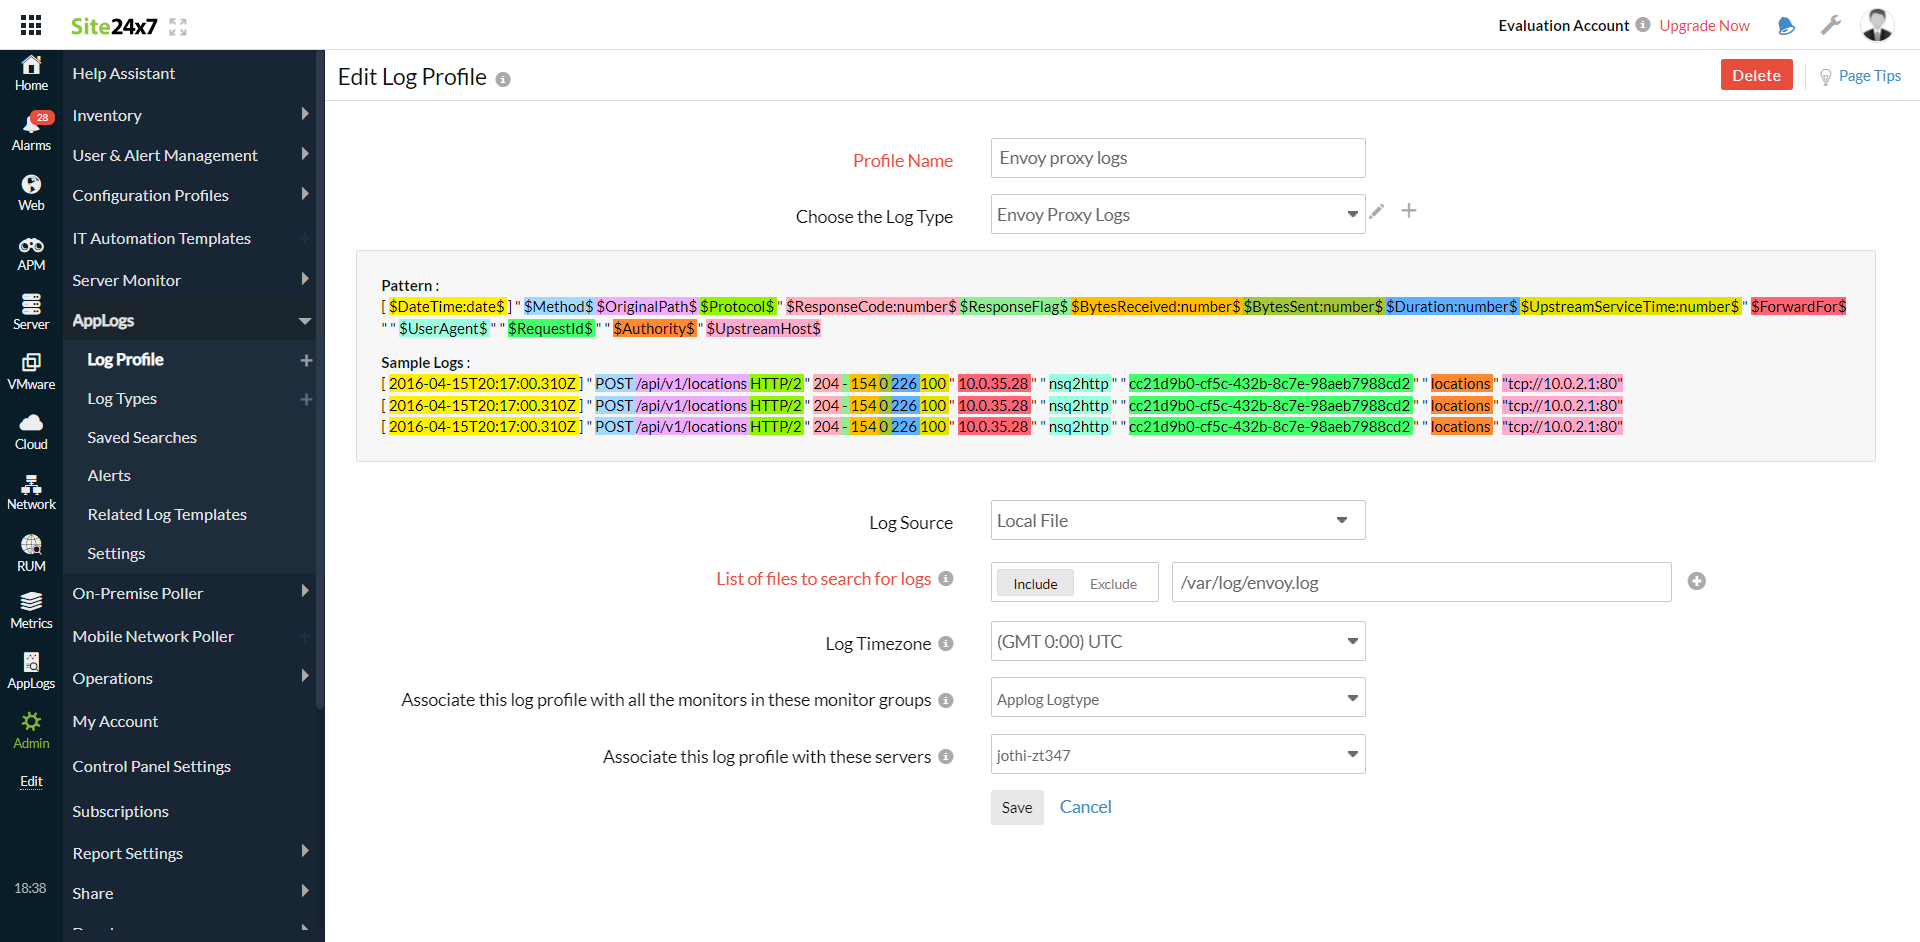
3. Go to Admin > AppLogs > Log Profile and select Add Log Profile.
4. Enter the Profile Name.
5. Select Envoy proxy logs from the Choose the Log Type dropdown.
- The Sample Logs and Log Pattern are displayed below.
Sample Logs:
[ 2016-04-15T20:17:00.310Z ] " POST /api/v1/locations HTTP/2 " 204 - 154 0 226 100 " 10.0.35.28 " " nsq2http " " cc21d9b0-cf5c-432b-8c7e-98aeb7988cd2 " " locations " "tcp://10.0.2.1:80"
[ 2016-04-15T20:17:00.310Z ] " POST /api/v1/locations HTTP/2 " 204 - 154 0 226 100 " 10.0.35.28 " " nsq2http " " cc21d9b0-cf5c-432b-8c7e-98aeb7988cd2 " " locations " "tcp://10.0.2.1:80"
[ 2016-04-15T20:17:00.310Z ] " POST /api/v1/locations HTTP/2 " 204 - 154 0 226 100 " 10.0.35.28 " " nsq2http " " cc21d9b0-cf5c-432b-8c7e-98aeb7988cd2 " " locations " "tcp://10.0.2.1:80"
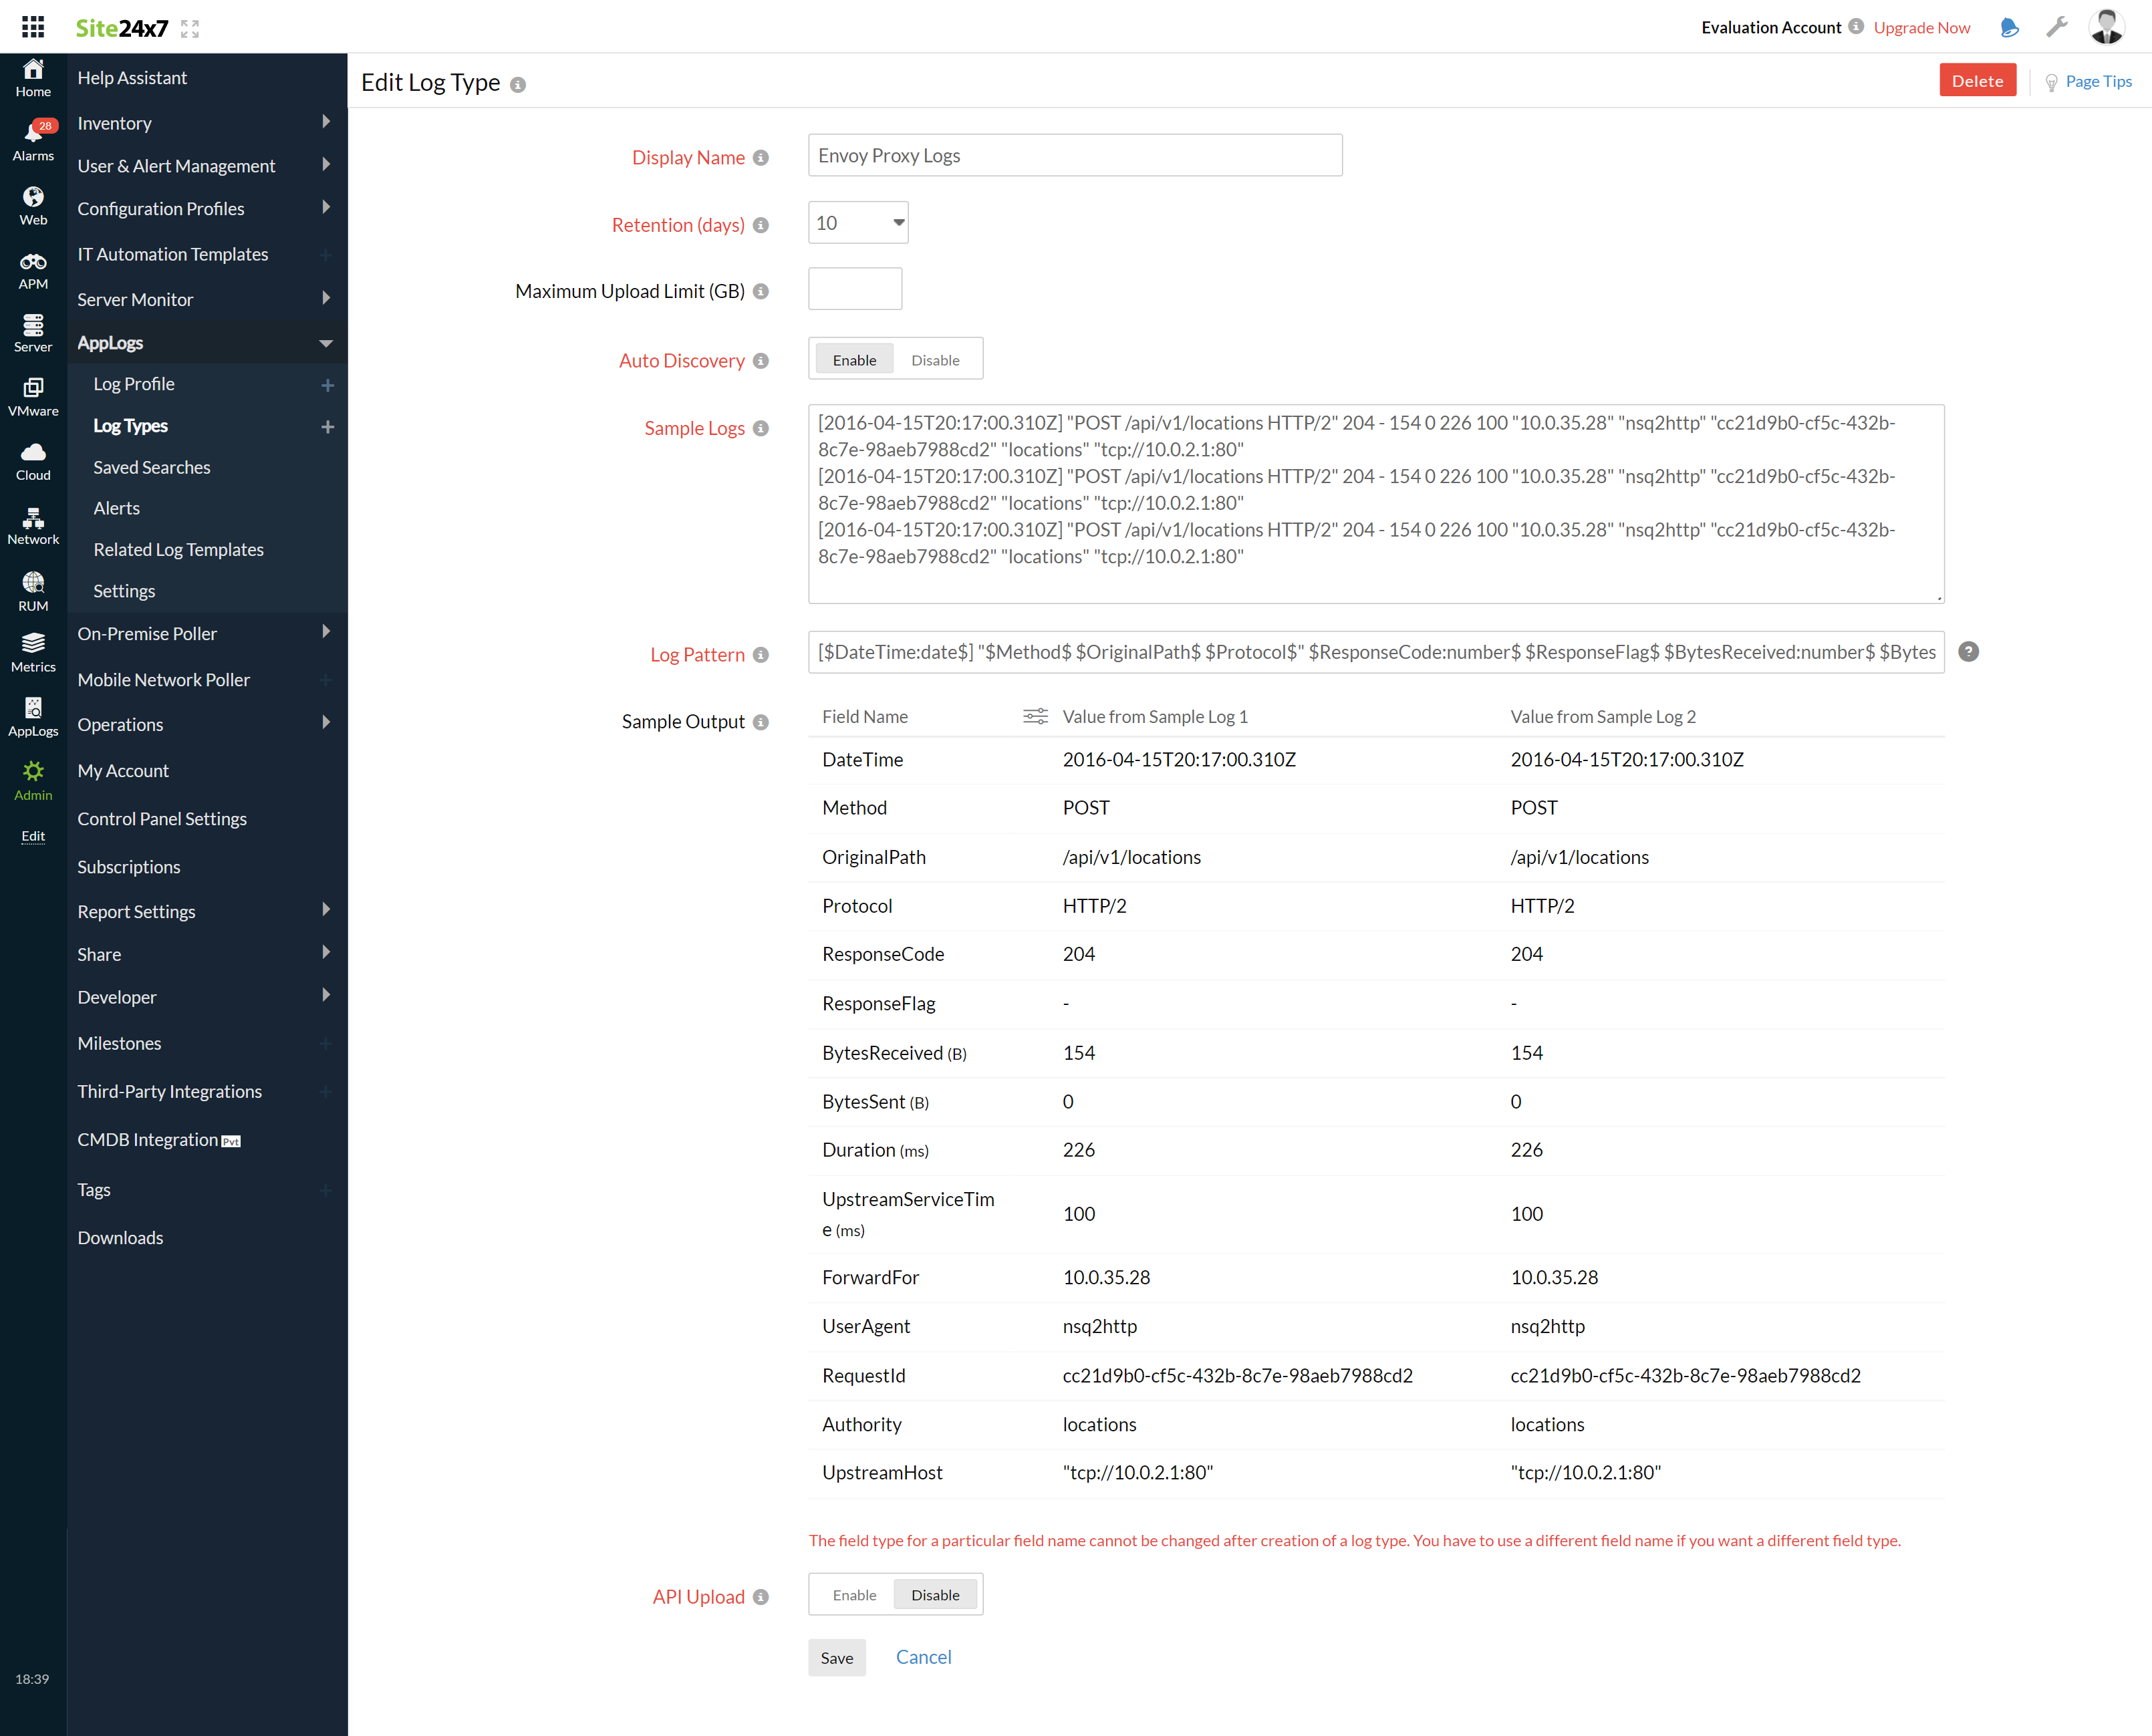
These logs are separated into fields, each of which takes its respective value and is then uploaded to Site24x7.
- By default, this is the Log Pattern identified by AppLogs for Envoy proxy logs:
[ $DateTime:date$ ] " $Method$ $OriginalPath$ $Protocol$ " $ResponseCode:number$ $ResponseFlag$ $BytesReceived:number$ $BytesSent:number$ $Duration:number$ $UpstreamServiceTime:number$ " $ForwardFor$ " " $UserAgent$ " " $RequestId$ " " $Authority$ " $UpstreamHost$
- You can add a custom Log Pattern instead of the default one. To do so, click the pencil icon and specify your pattern.

6. Select the Local File as the Log Source.
7. By default, the path below is used as the file source:
Linux: "/var/log/envoy.log"
- If your source path is different from the default path, specify in the List of files to search for logs field.
8. Select either monitors or monitor groups to collect the logs.

9. Click Save.
Dashboard
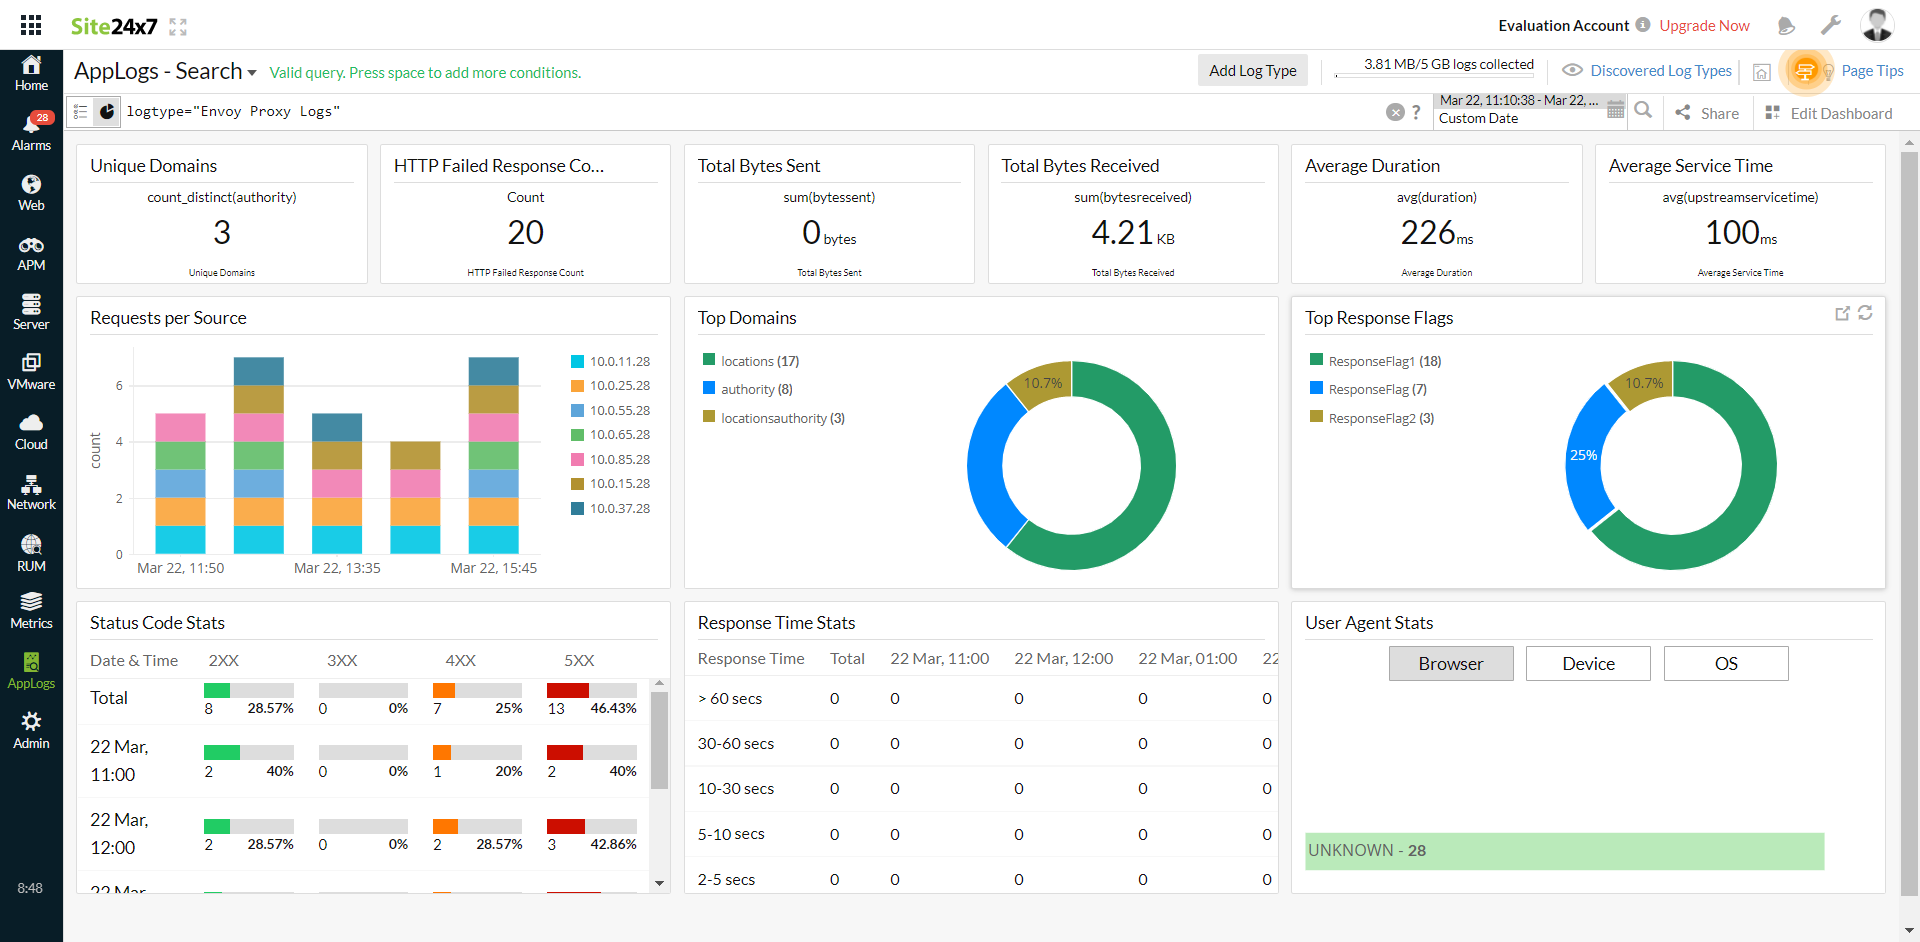
AppLogs creates an exclusive dashboard for every log type and shows a few widgets by default. Here's a list of the widgets available on the Envoy proxy logs dashboard:
- Unique Domains
- HTTP Failed Response Count
- Total Bytes Sent
- Total Bytes Received
- Average Duration
- Average Service Time
- Requests per Source
- Top Domains
- Top Response Flags
- Status Code Stats
- Response Time Stats
- User Agent Stats

Related log types
-
On this page
- Getting started
- Dashboard
- Related log types
