Performance Metrics of Web Transaction Monitor
Interpret Web Transaction Results
Web Transaction tracks the availability and performance of multi-step web transactions, such as online shopping carts or bank transactions. The monitor checks for web application response time. It senses the server response time of the web application sequence in which only the HTML content of the requests is analyzed.
Site24x7's Web dashboard has a custom status banner, which identifies the various configured monitors by segregating them based on their operational status and state. You can also view the number of operational monitors and alert credits remaining in your account. By clicking the "+ Buy More" button, you can purchase additional monitors and alert credits. The main result page is divided into two sections; Response Time which shows response time metrics of your website in a graphical format and Availability & Response Time by Location, which gives a tabular view of location wise availability and other related metrics. You can share the monitor details via an email. Email can be sent to only those verified users who have agreed to receive emails from Site24x7.
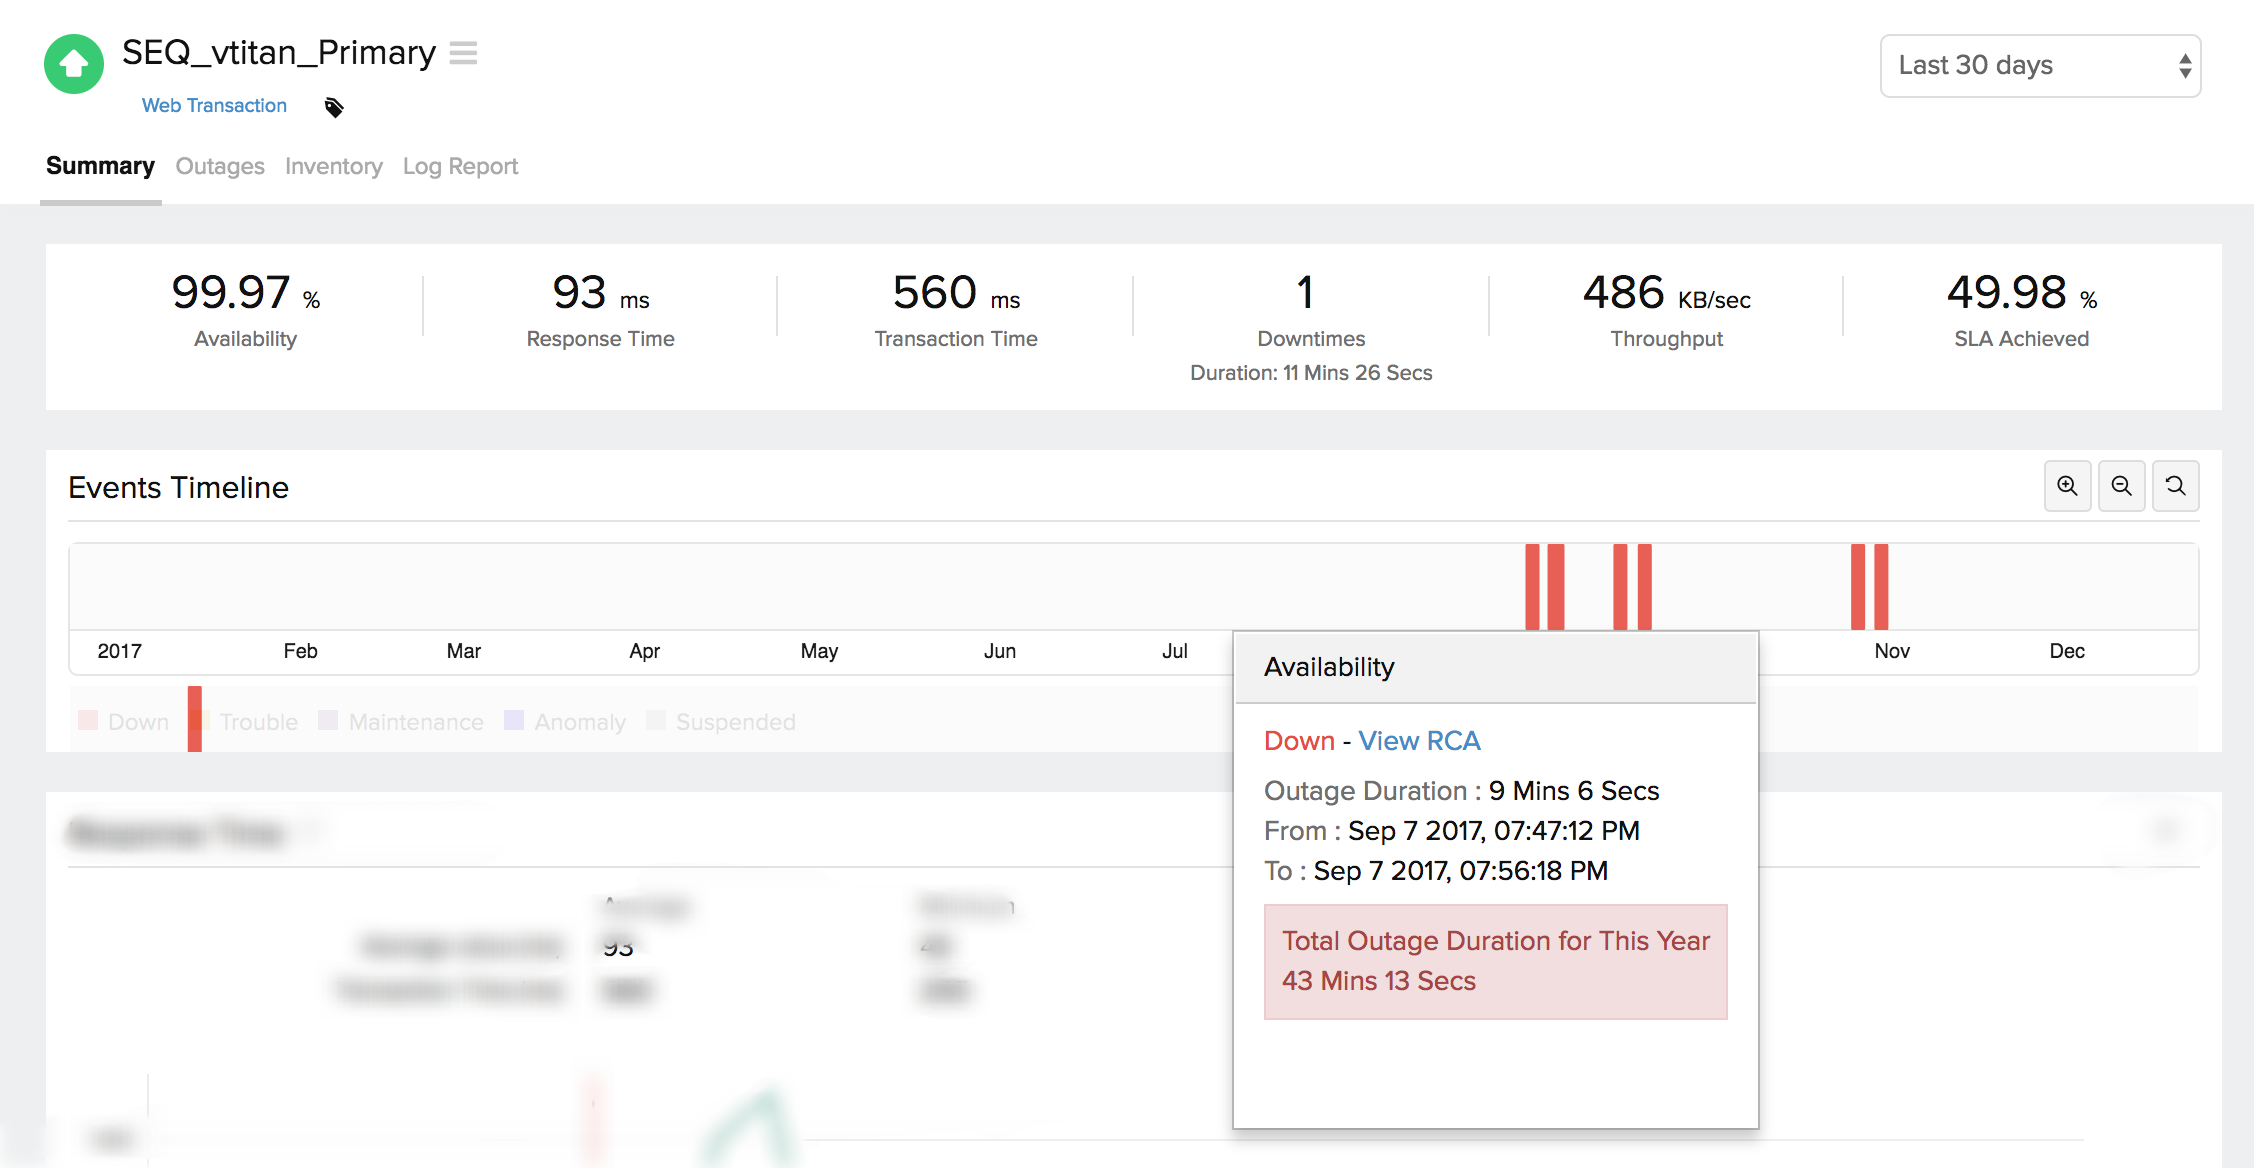
Events Timeline:
Events timeline widget records all the past events of your selected monitor for a selected time range. You can identify/decode various events from the past, which includes Down, Critical, Trouble, Maintenance, Suspended, or Anomalies. Each event are color coded for easy identification. Events can be drilled down to extract maximum data and facilitate easy troubleshooting. You can also track the actual outage period and the total outage duration during a specific block of time.
Navigate to Web icon and click the appropriate Web Transaction listed in the monitor summary. This page would cause the following metrics displayed in the form of graphs and tables:
- Apdex Score: It is a measure of the end user customer satisfaction levels. Apdex Score can be classified as follows:
- Apdex score > 0.9 means Satisfied.
- Apdex score >0.5 & <0.9 means Tolerating.
- Apdex score < 0.5 means Frustrated.
- Response Time and Response Time by Location indicate the location based total time taken to retrieve the entire HTML content of the webpage. Average response time and Average response time by Location data are presented in a tabular layout for easy assimilation.
- Response Time (ms) for Steps by Location shows you the location wise time taken to download the entire HTML content of the web page.
- Transaction Time and Transaction Time by Location indicate the location based time taken to complete a transaction for your recorded steps. Transaction time metrics of the Web Transaction Monitor are presented in a graphical format. Average Transaction time and Average Transaction time by Location data are presented in a tabular layout for easy assimilation.
- Transaction Time (ms) for Steps by Location shows you the location wise time taken to complete a transaction for each of your recorded steps.
- Availability & Response Time by Location, which gives a graphical and tabular view of location wise availability and other related metrics.
Apdex Score and Performance Benchmarking:
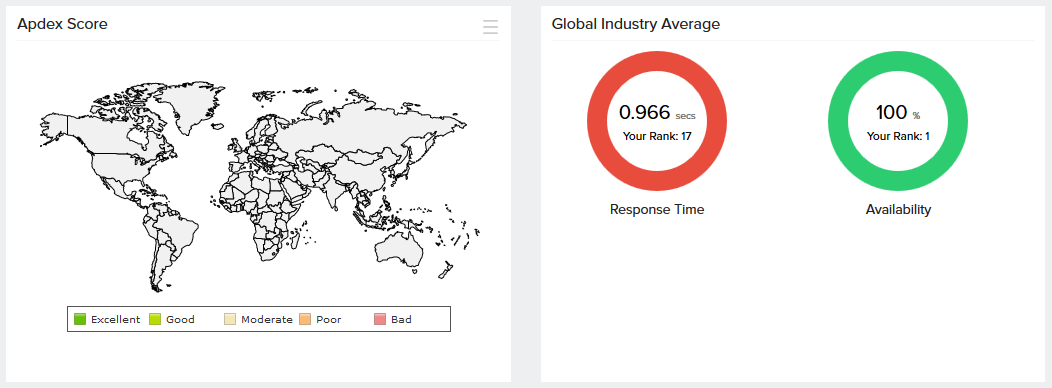
With our RUM integration widget, you can instantly use the Apdex industry standard for measuring the satisfaction of a user using your application or service, you can understand how your applications are performing from your users’ perspective, i.e, “Satisfied”, “Tolerating” or “Frustrated”. The time period can be chosen from the History Data for the section.
The benchmarks widget is now integrated with-in the client letting you compare your website performance with industry peers. With our performance benchmarking widget, you can instantly view and compare your average response time and availability of your service with respect to your industrial peers. This can be viewed across various industrial verticals.
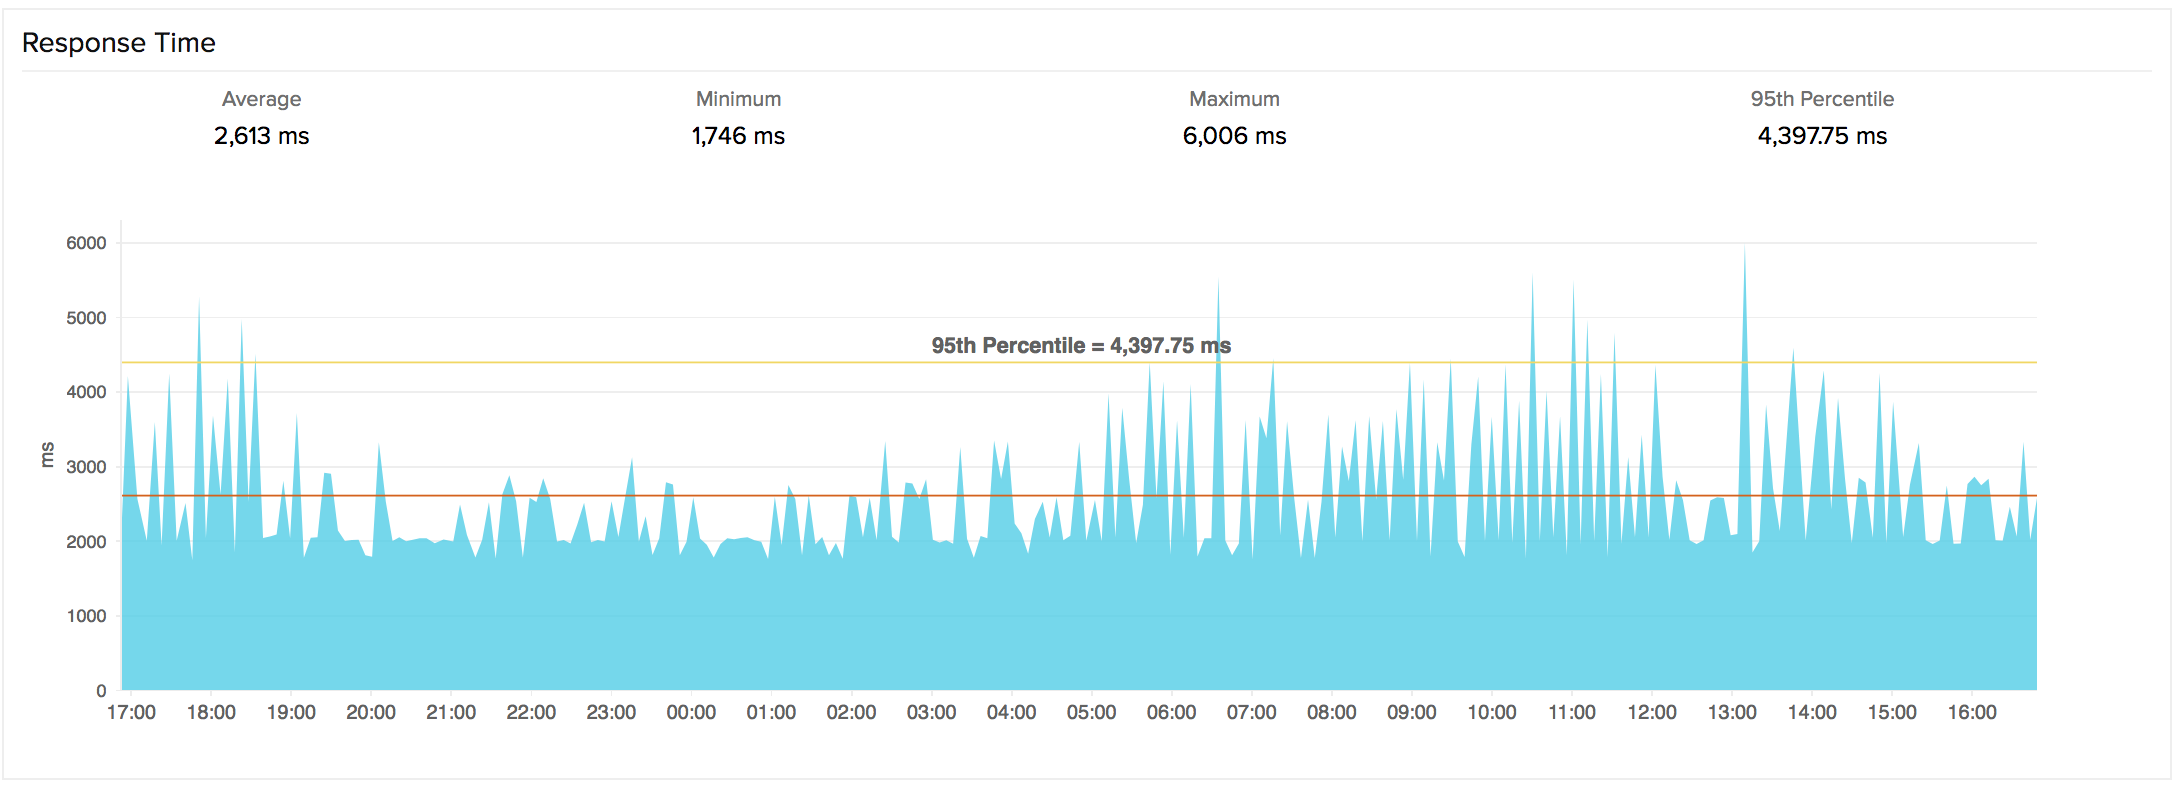
Response Time
Response Time indicates the total time required to retrieve the entire HTML content of the webpage. The graph is calculated by plotting time period against response time. You can further filter out the three point, five point moving averages and also the 95 percentile by selecting the appropriate legends. The graph also lets you zoom in and isolate the exact data from the graphical spikes. You can also add specific notes to inform users about the various outages and maintenance activities.
Graphical Representation
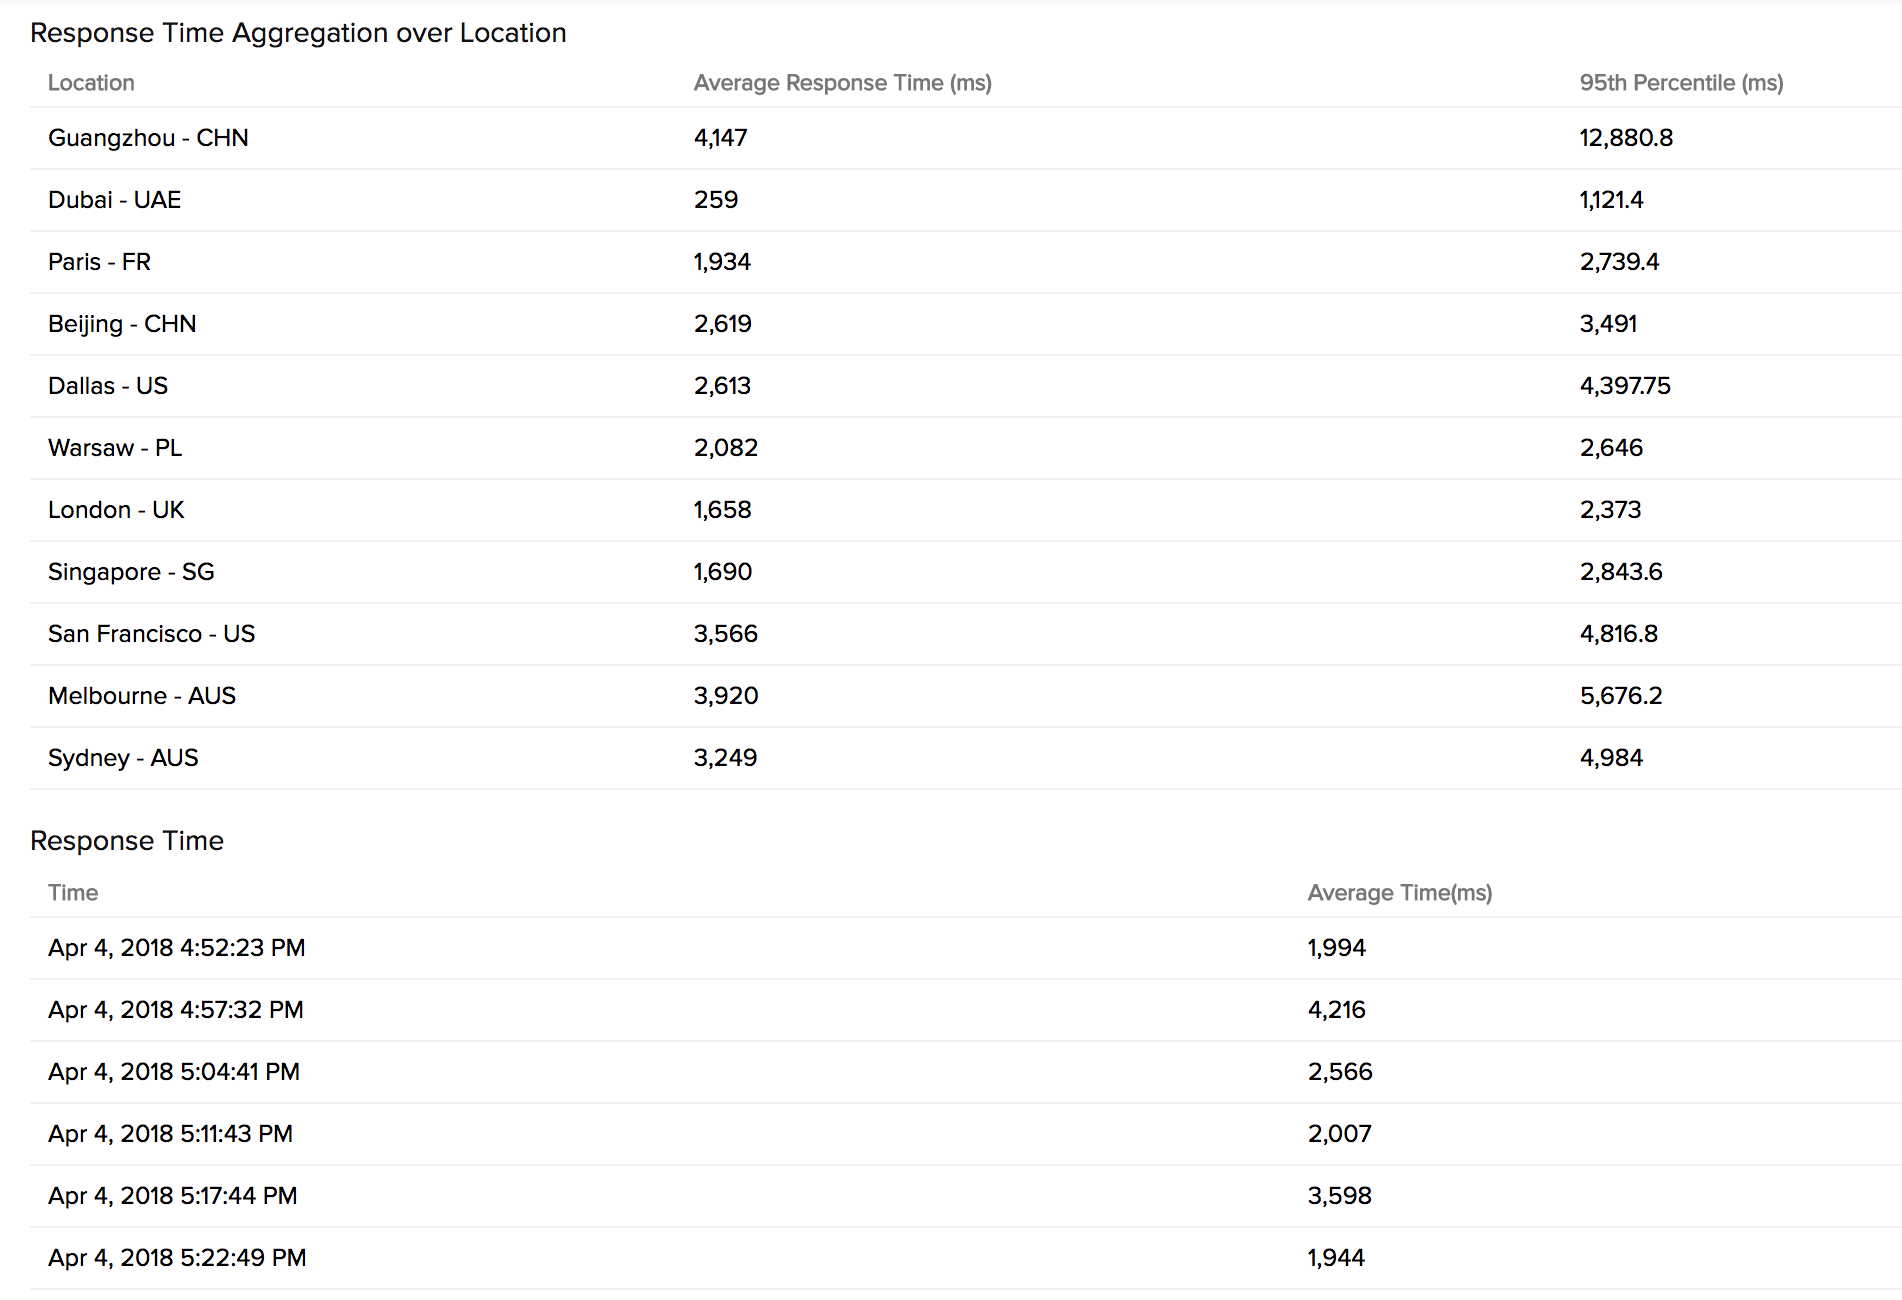
Average Response Time, Maximum Response Time, Minimum Response Time, and 95th percentile values are detailed in a tabular layout. Average Response Time By Location is also defined based on the various locations selected.
Response Time (ms) for Steps by Location
It presents you the location wise, time taken to download the entire HTML content of the web application.

Transaction Time
Transaction Time by Location graph shows the average/95th percentile transaction time for each day or hour from every monitoring location. This graph can be used to analyze the average transaction time of your monitor from different monitoring locations. The location is identified using legend given below the graph.
Graphical Representation
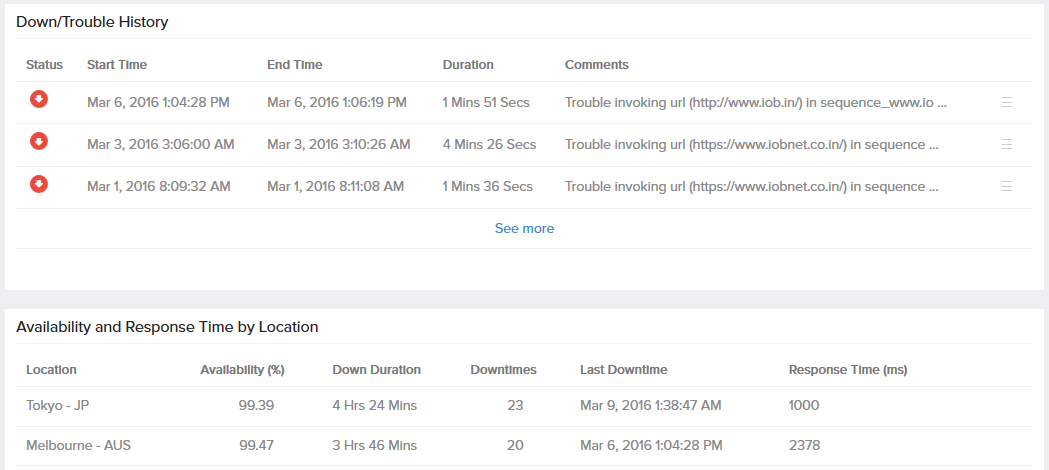
Down/Trouble History
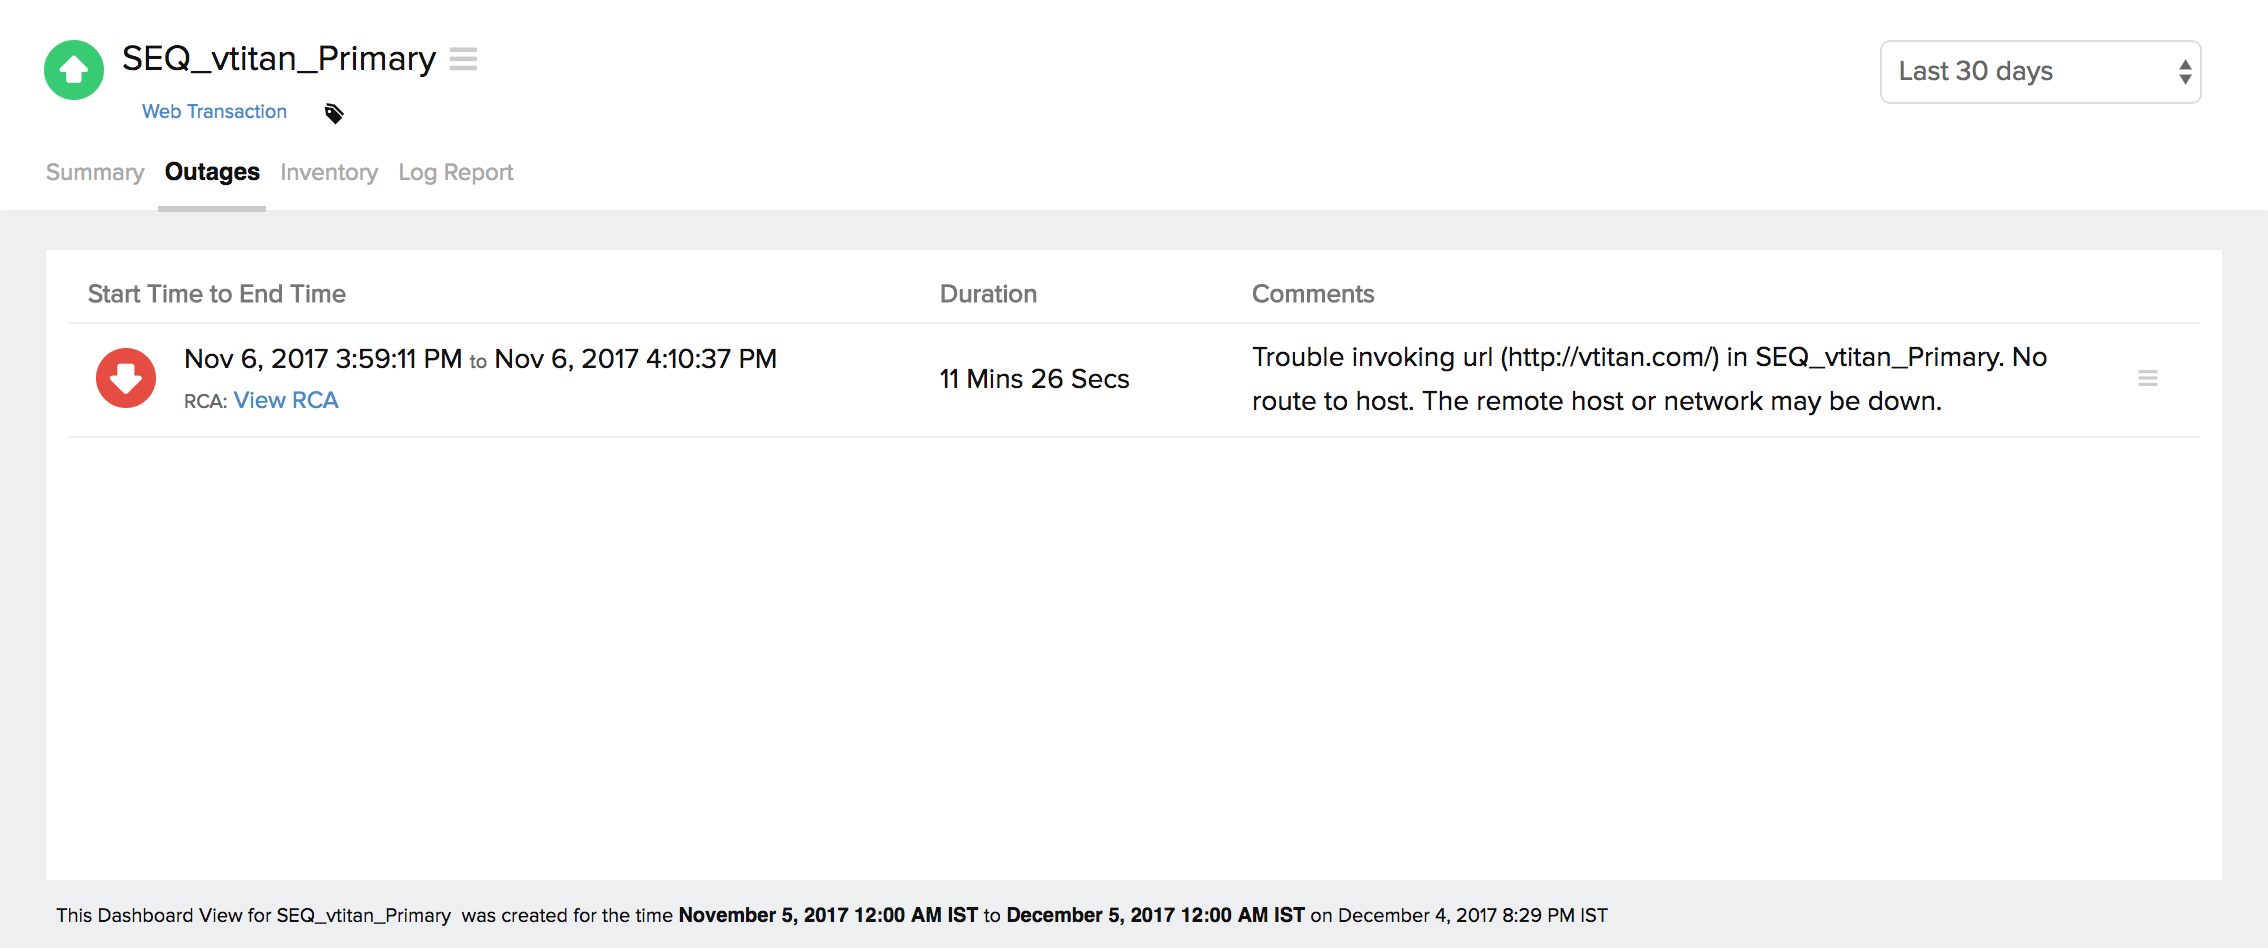
It offers detailed insight into the trouble history of your monitor. You can view the status, the exact downtime, duration, and specific reason for the down status.
Availability & Response Time by Location
The availability and response time of the Web Transaction Monitor for each and every monitoring location is expressed in a tabular format. The total availability percentage and Response Time (ms) with down duration from each monitoring location can be deducted from this data.
Global Status and Updates:
Get an instant peek into the actual real-time status of your monitor from the configured geographical locations. Additionally, you can also view the real-time data from the various poll cycles and it includes the outages and trouble alerts data.
Outages
You can access the Outages tab in your monitor's details page to gather detailed insights on the various outage and maintenance downtimes. It provides you with sufficient information to troubleshoot issues. You'll also be able to access the root cause analysis reports for your various outages. On accessing the ![]() icon of a listed monitor outage or maintenance, you'll be shown the options to:
icon of a listed monitor outage or maintenance, you'll be shown the options to:
- Mark as Maintenance: Mark an outage as Maintenance
- Mark as Downtime: Mark a Maintenance as Downtime
- Edit Comments: Add/Edit Comments
- View HTML: View the error response in HTML format obtained during a failed content check
- View Image: View the RCA screenshot for the outage
- Delete: Delete an Outage/Maintenance permanently
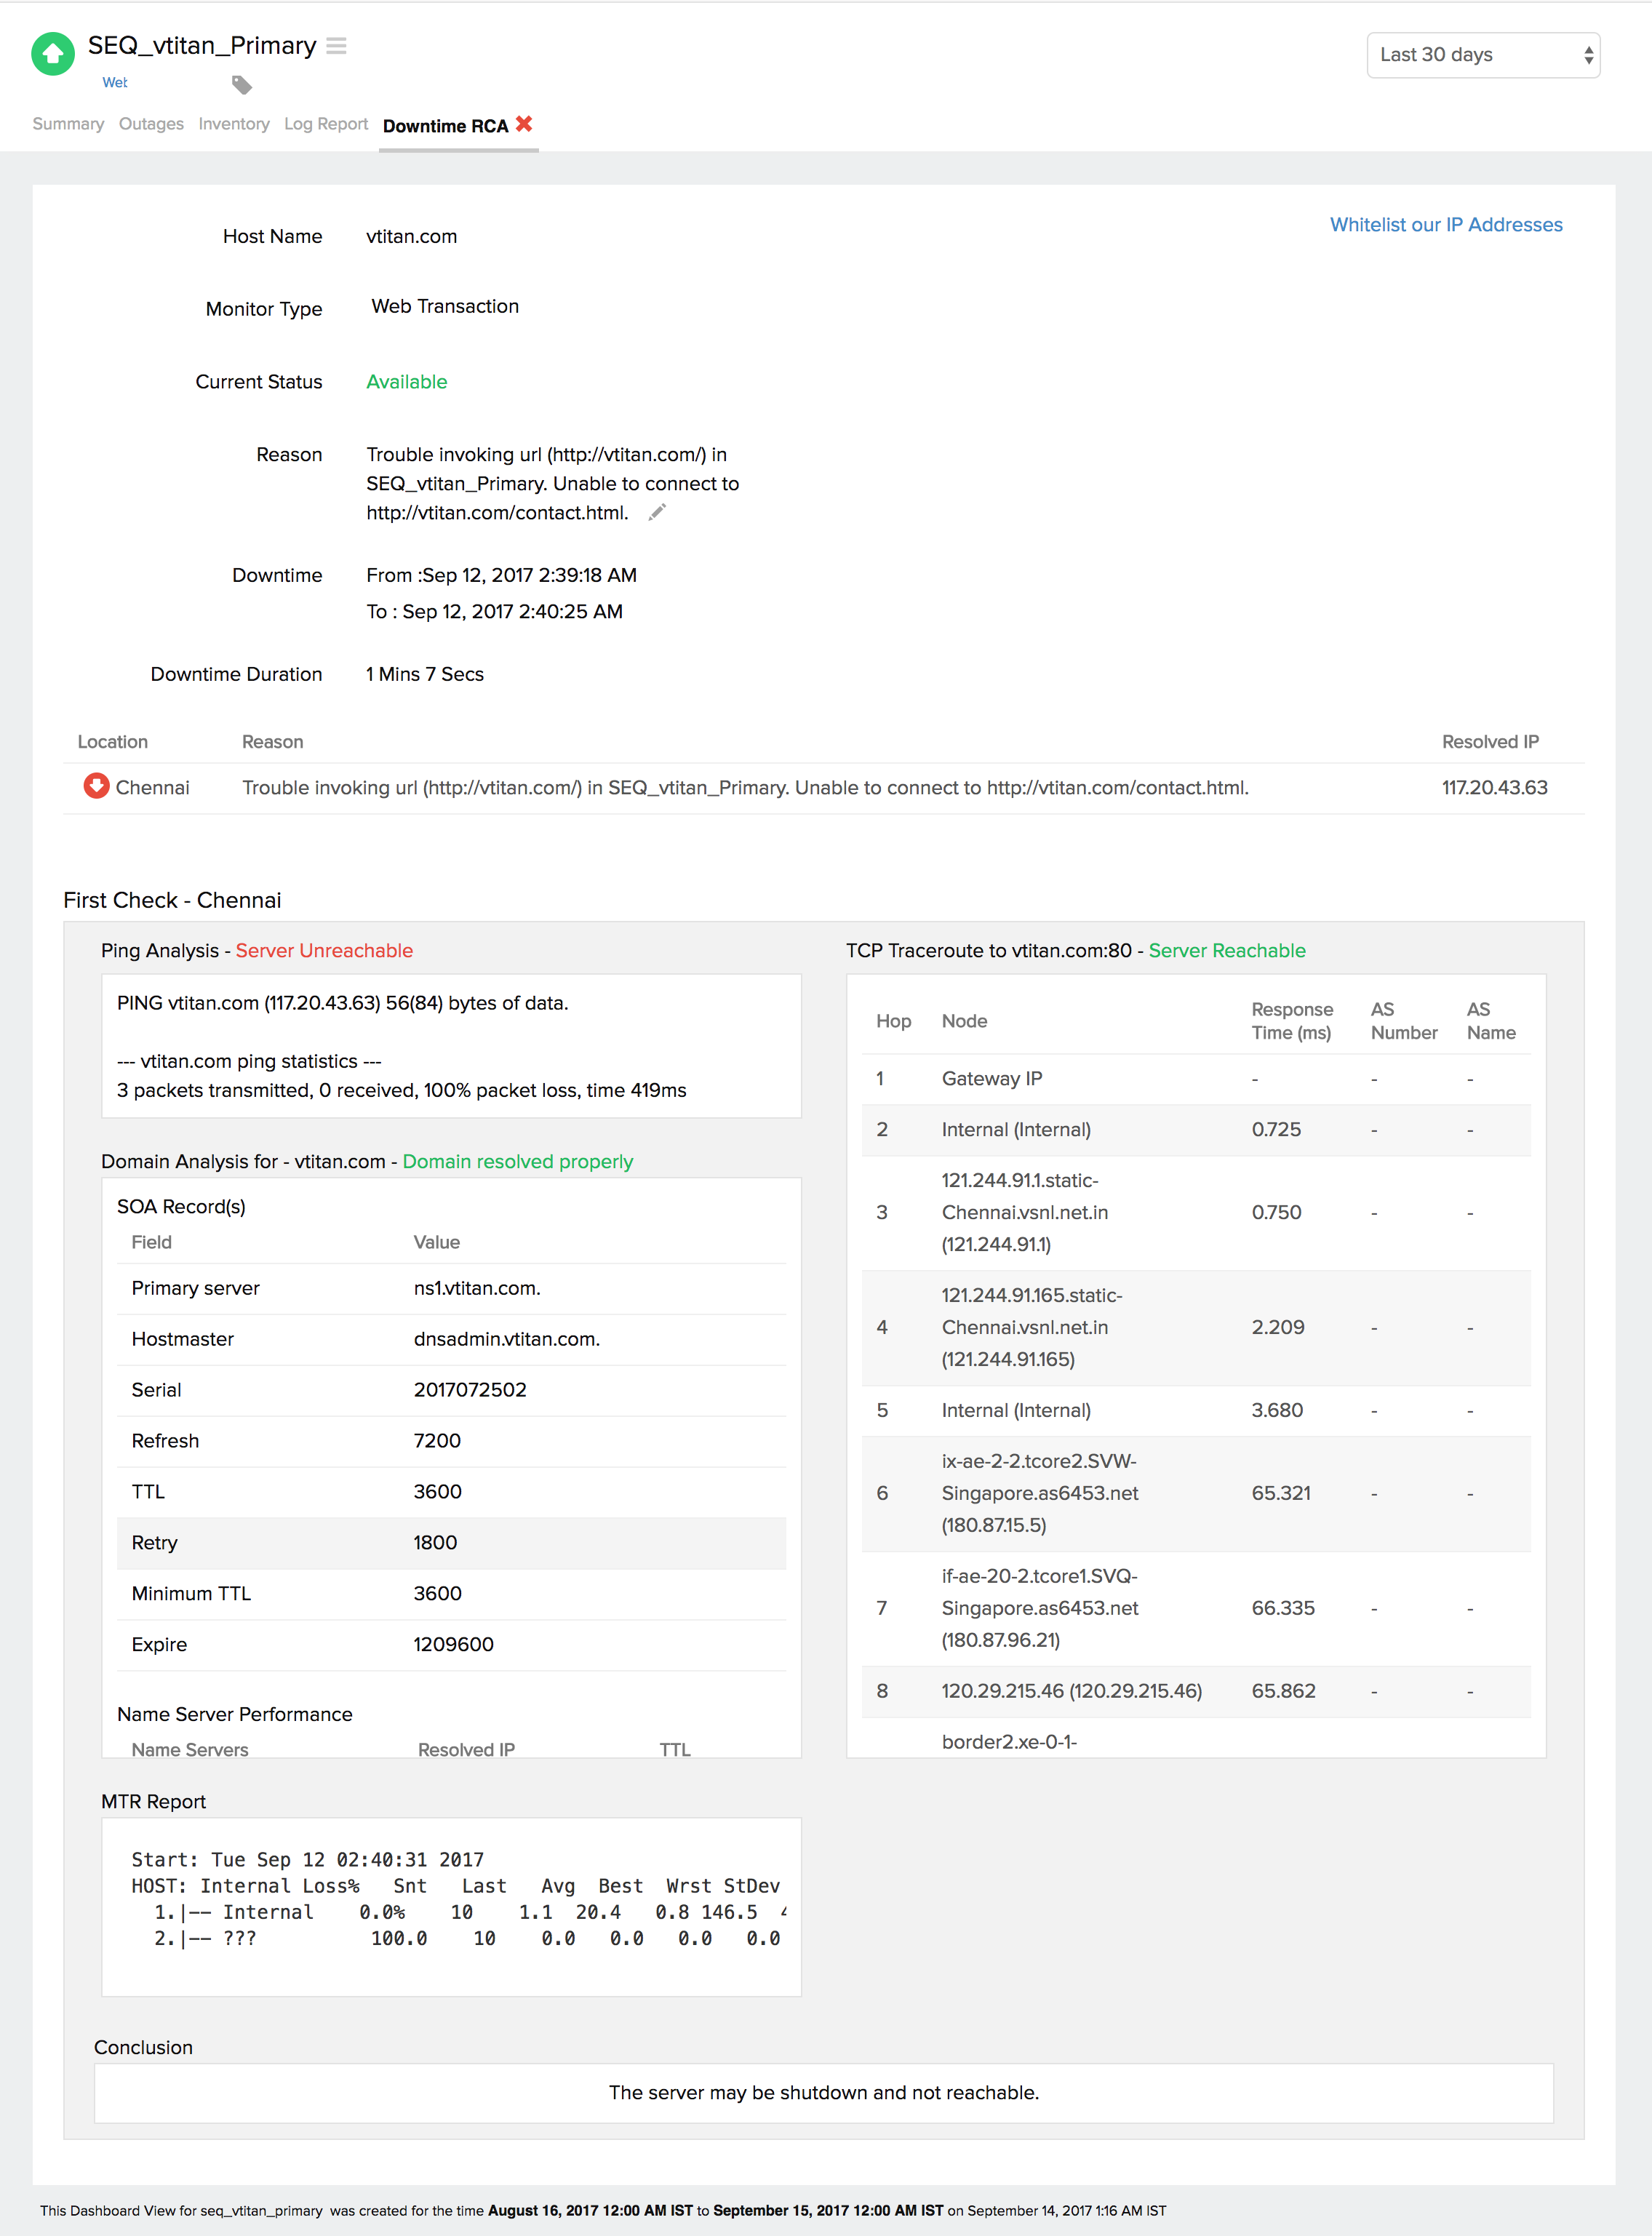
Root Cause Analysis (RCA) Report:
You can retrieve indepth root cause analysis report for your DOWN monitors after 150 seconds of the monitor reporting the outage. RCA Report gives basic details about your monitor, outage details, recheck details and reasons for the outage. Root Cause Analysis automatically generates a plethora of information to arrive at a definite conclusion as to what triggered a downtime. RCA intends to determine the root cause of specific downtime or performance issue. A normal RCA report will comprise of the following details:
- Checks from Primary location and re-checks from Secondary location.
- Ping Analysis
- DNS Analysis
- TCP Traceroute
- MTR Report
- MTR based Network Route
- Conclusion
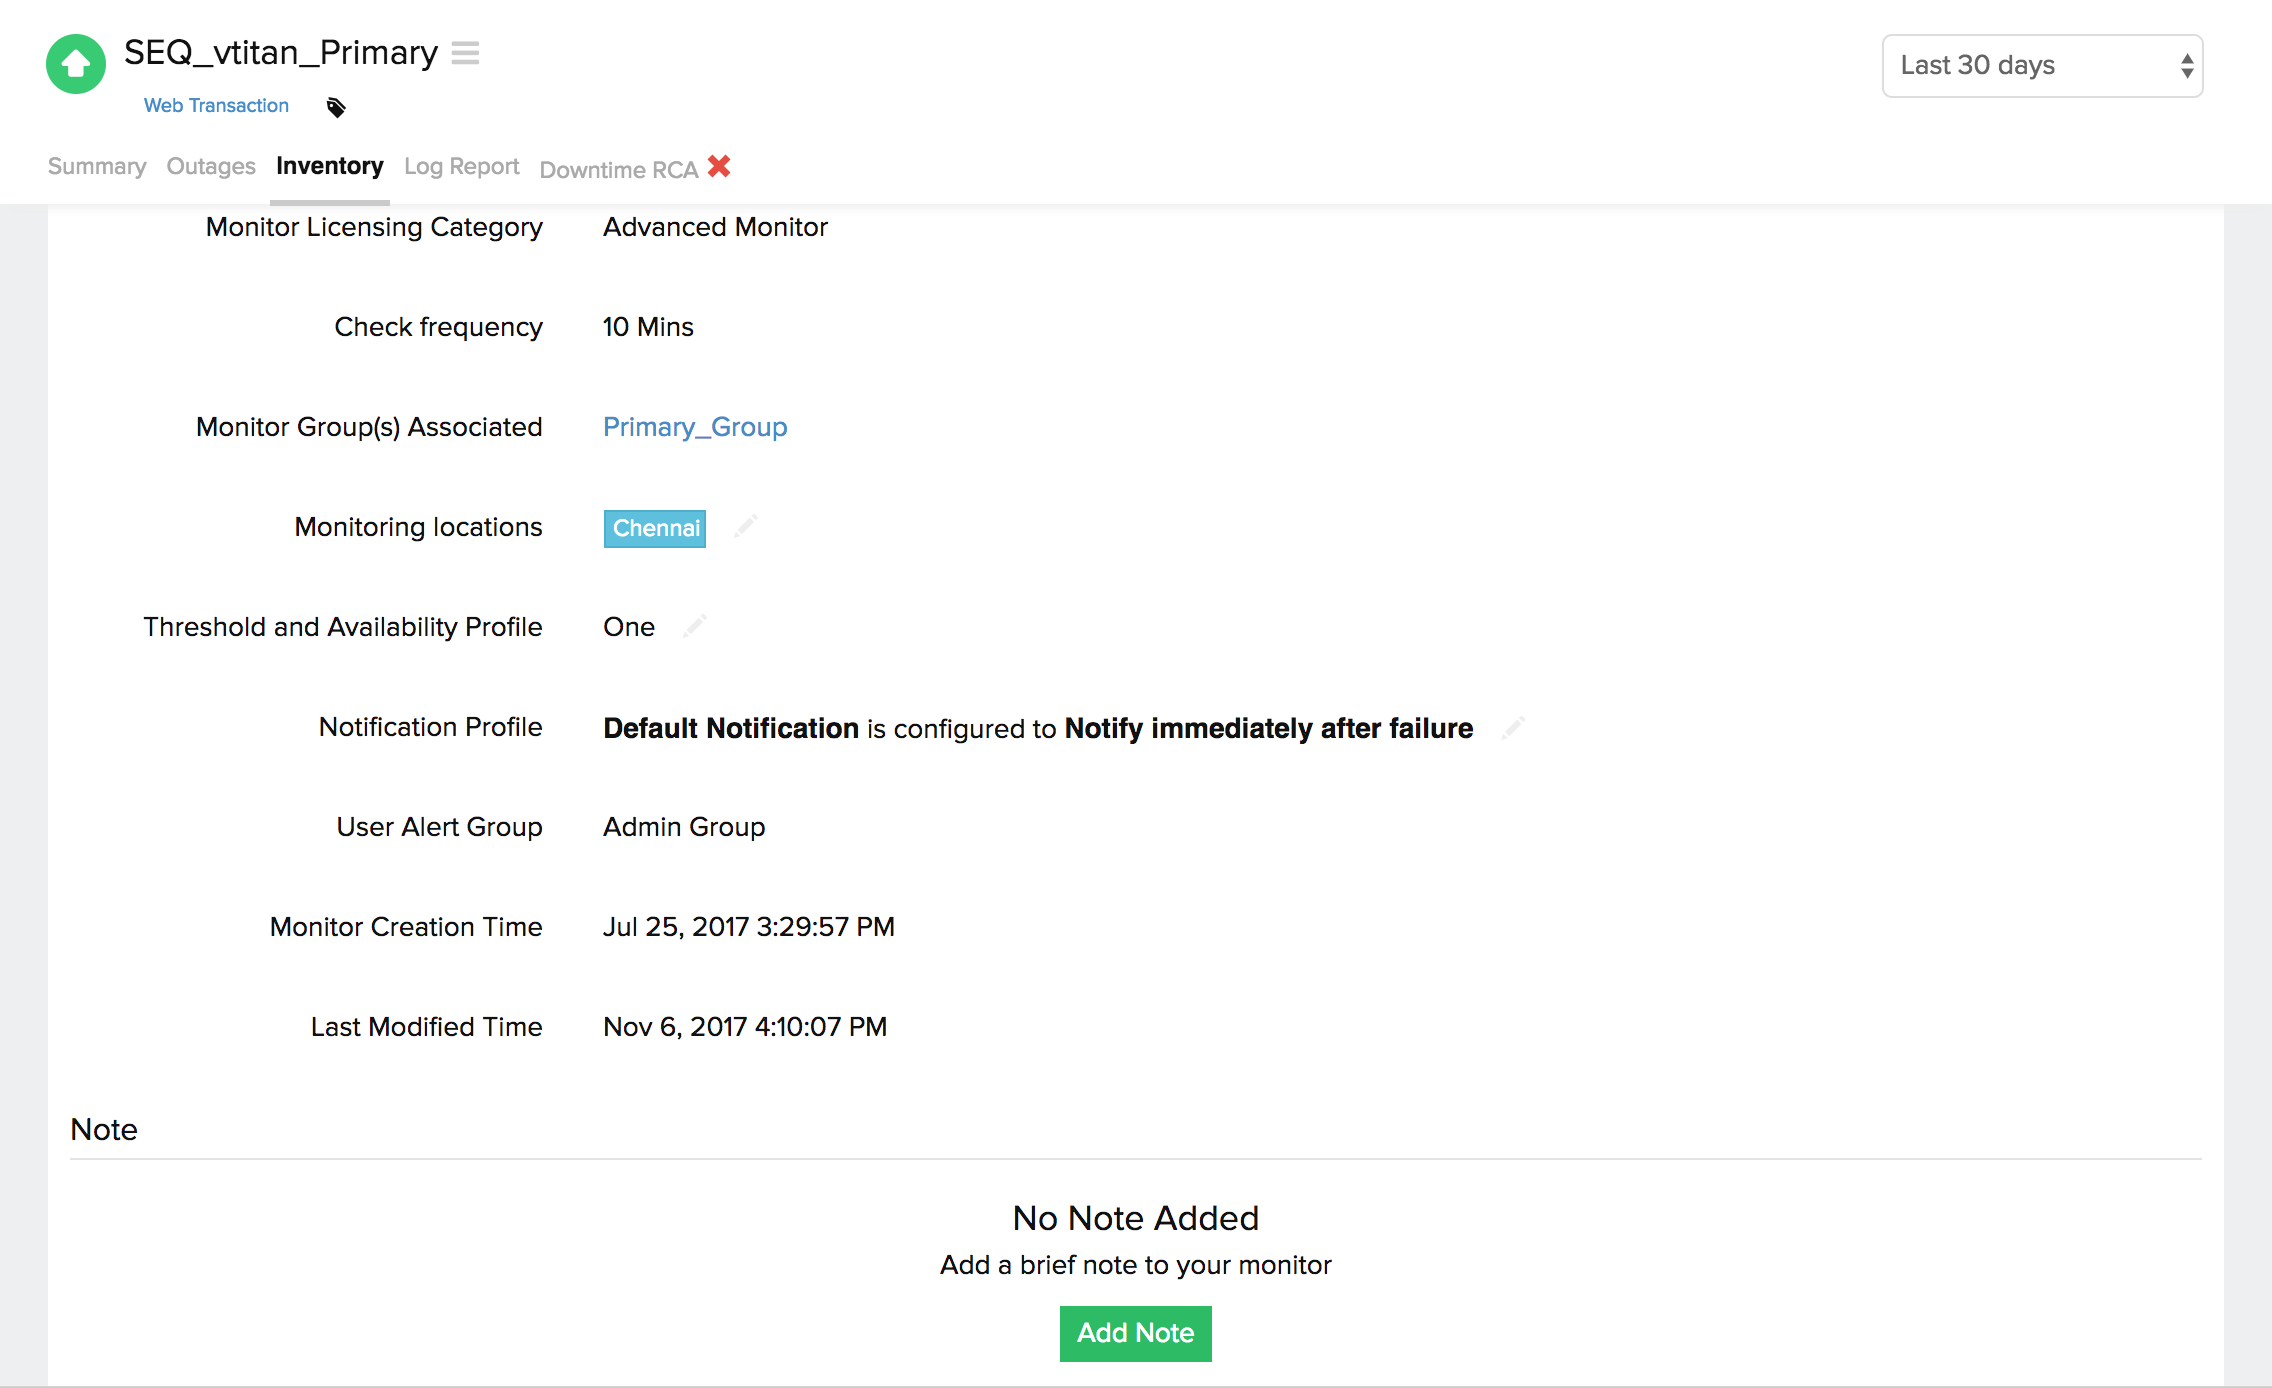
Inventory and Notes:
This section captures the basic monitor information and also its various configuration settings including polling locations, poll interval, licensing type, and more.
Log Report:
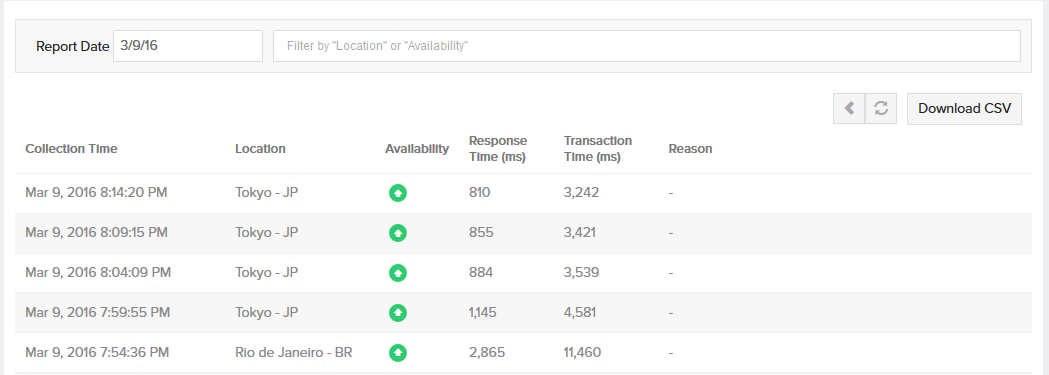
With our integrated log records for individual monitors, you can get an indepth knowledge about the various log details for the configured monitor, over a period of time. You can also filter the log based on location and availability. Various data including availability status, HTTP status codes, DNS response time etc. are captured here. You can also export the log report in CSV format.
Learn more: How to set up a Web Transaction

