Performance Metrics of REST API
Interpret REST API Results
Site24x7's REST API Monitor regularly tracks your API calls and simultaneously determines the response and performance of your REST APIs. Navigate to Web Tab and click the desired REST API monitor to get an insightful analytics on the operation of your REST APIs.
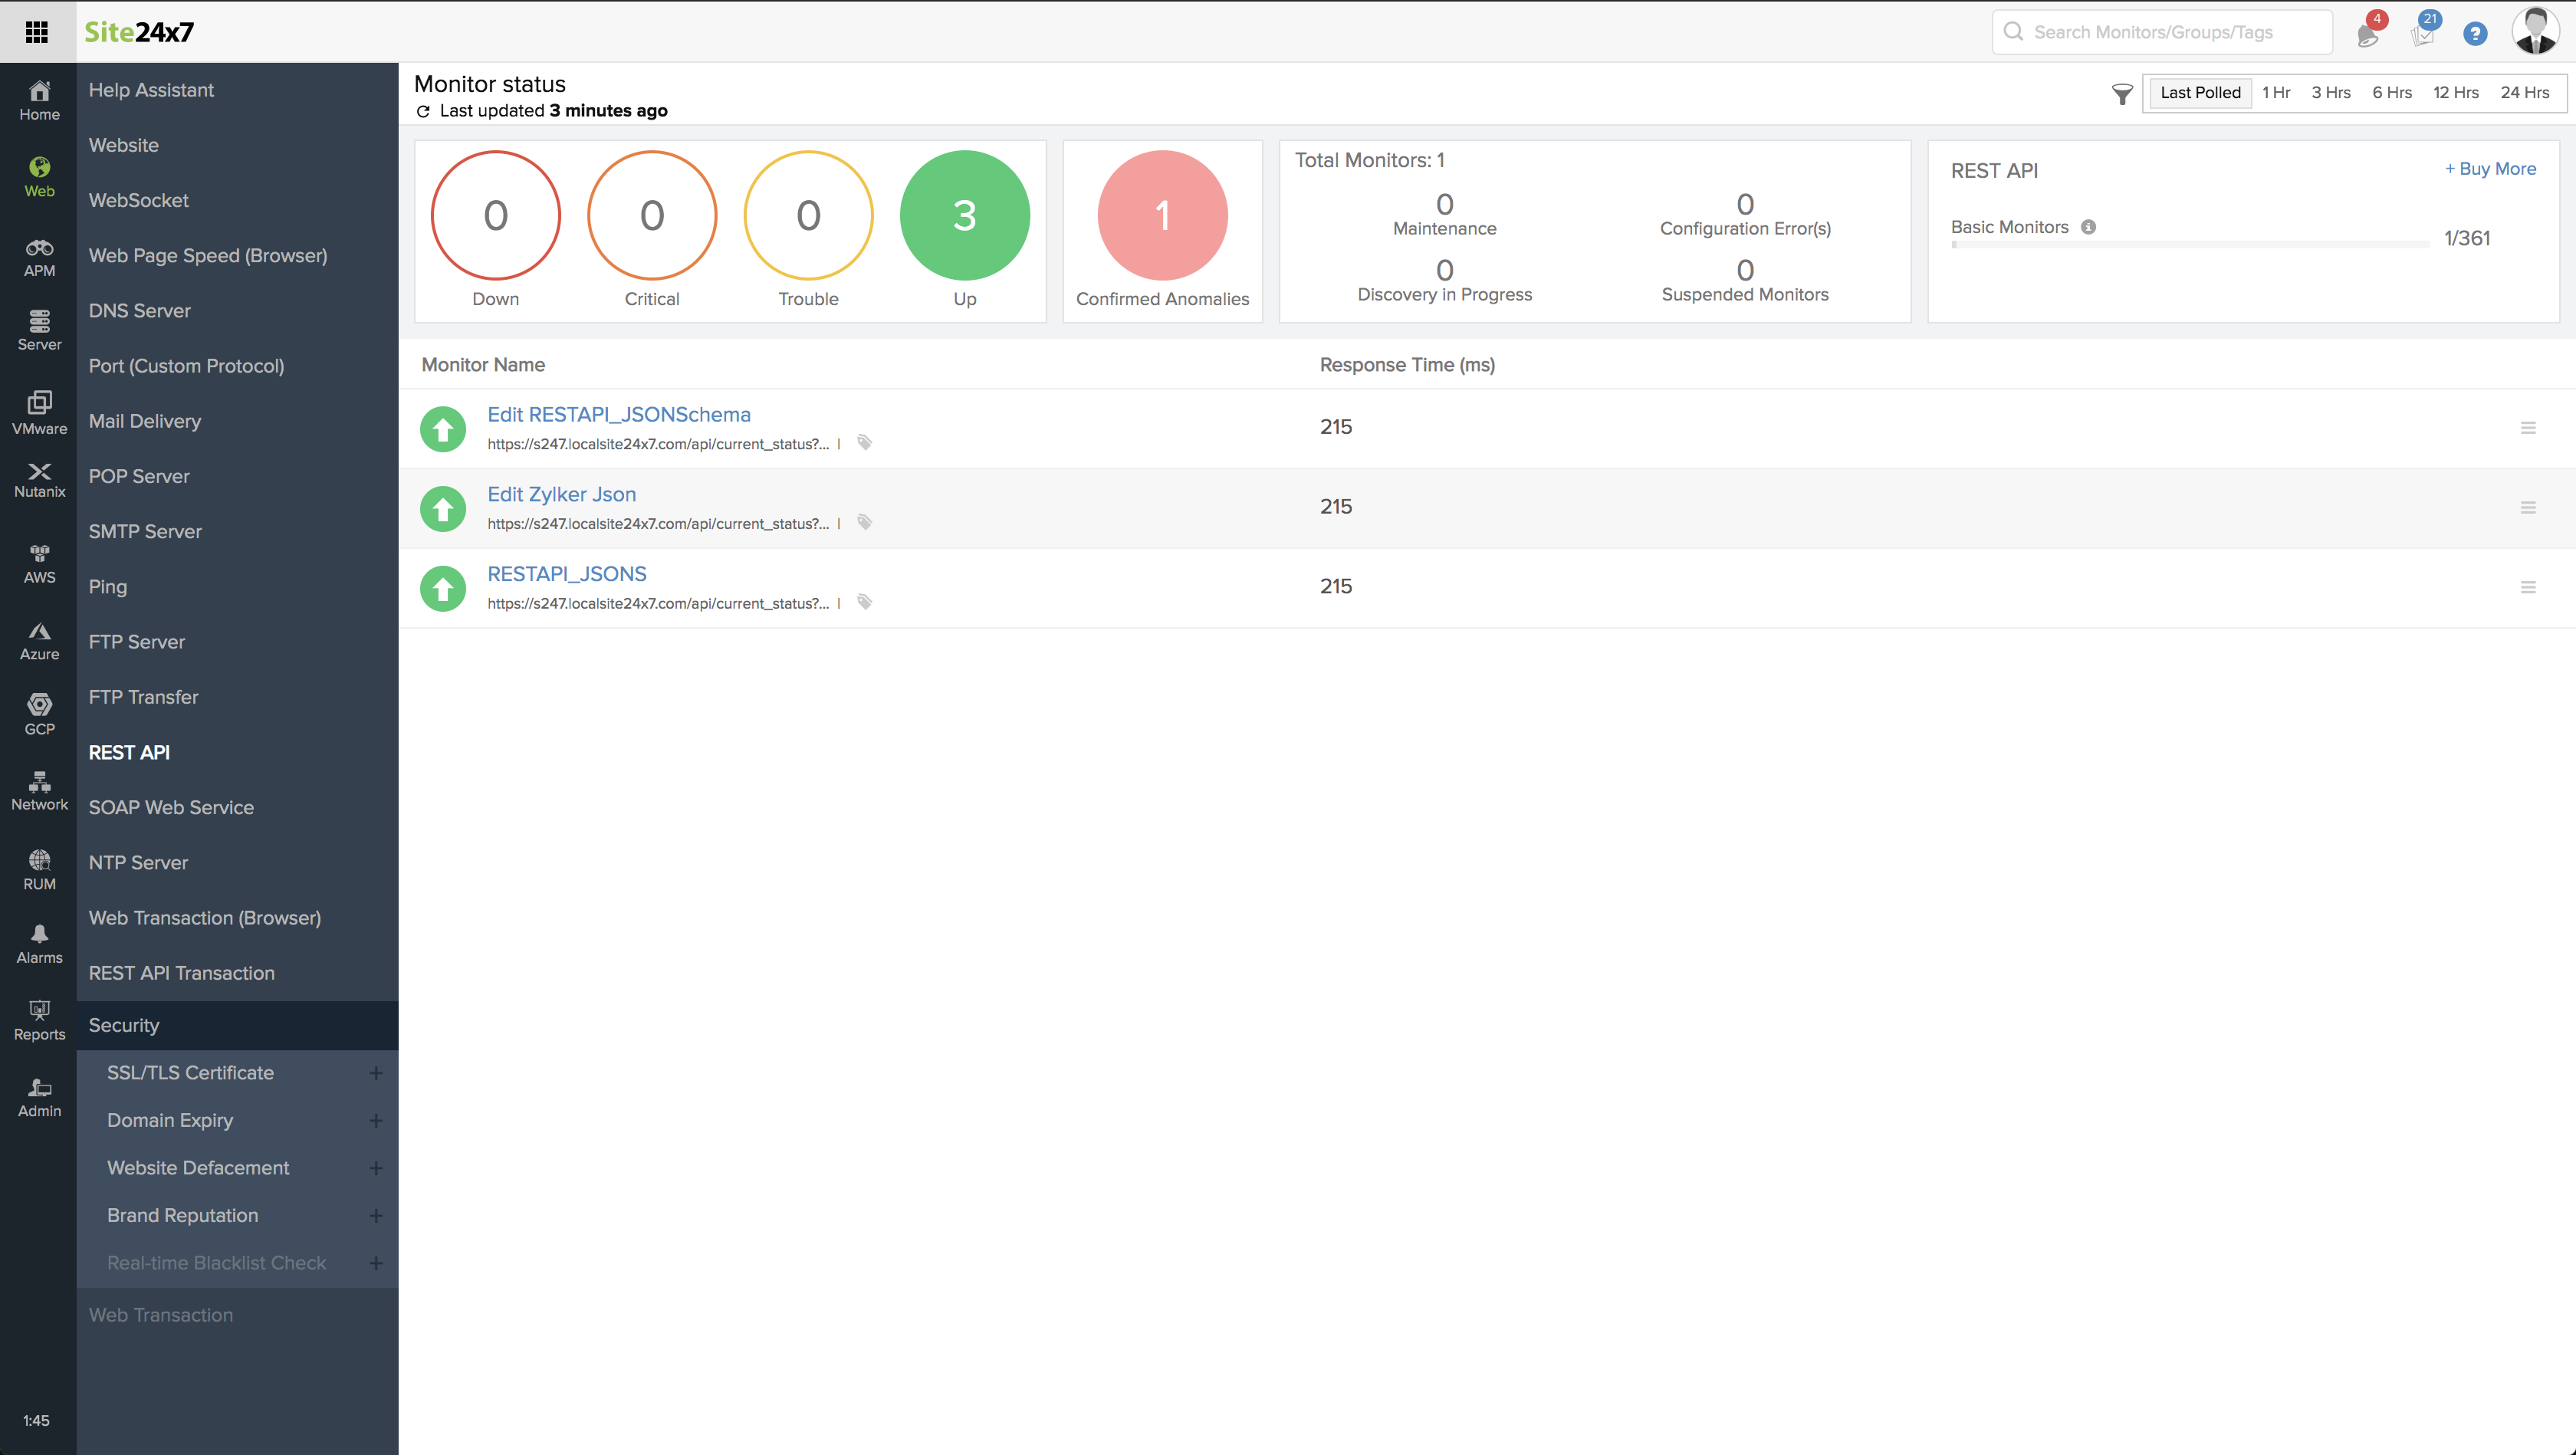
Site24x7's Web dashboard has a custom status banner, which identifies the various configured monitors by segregating them based on their operational status and state. You can also view the number of operational monitors and alert credits remaining in your account. By clicking the "+ Buy More" button, you can purchase additional monitors and alert credits. You can share the monitor details via an email. Email can be sent to only those verified users who have agreed to receive emails from Site24x7.
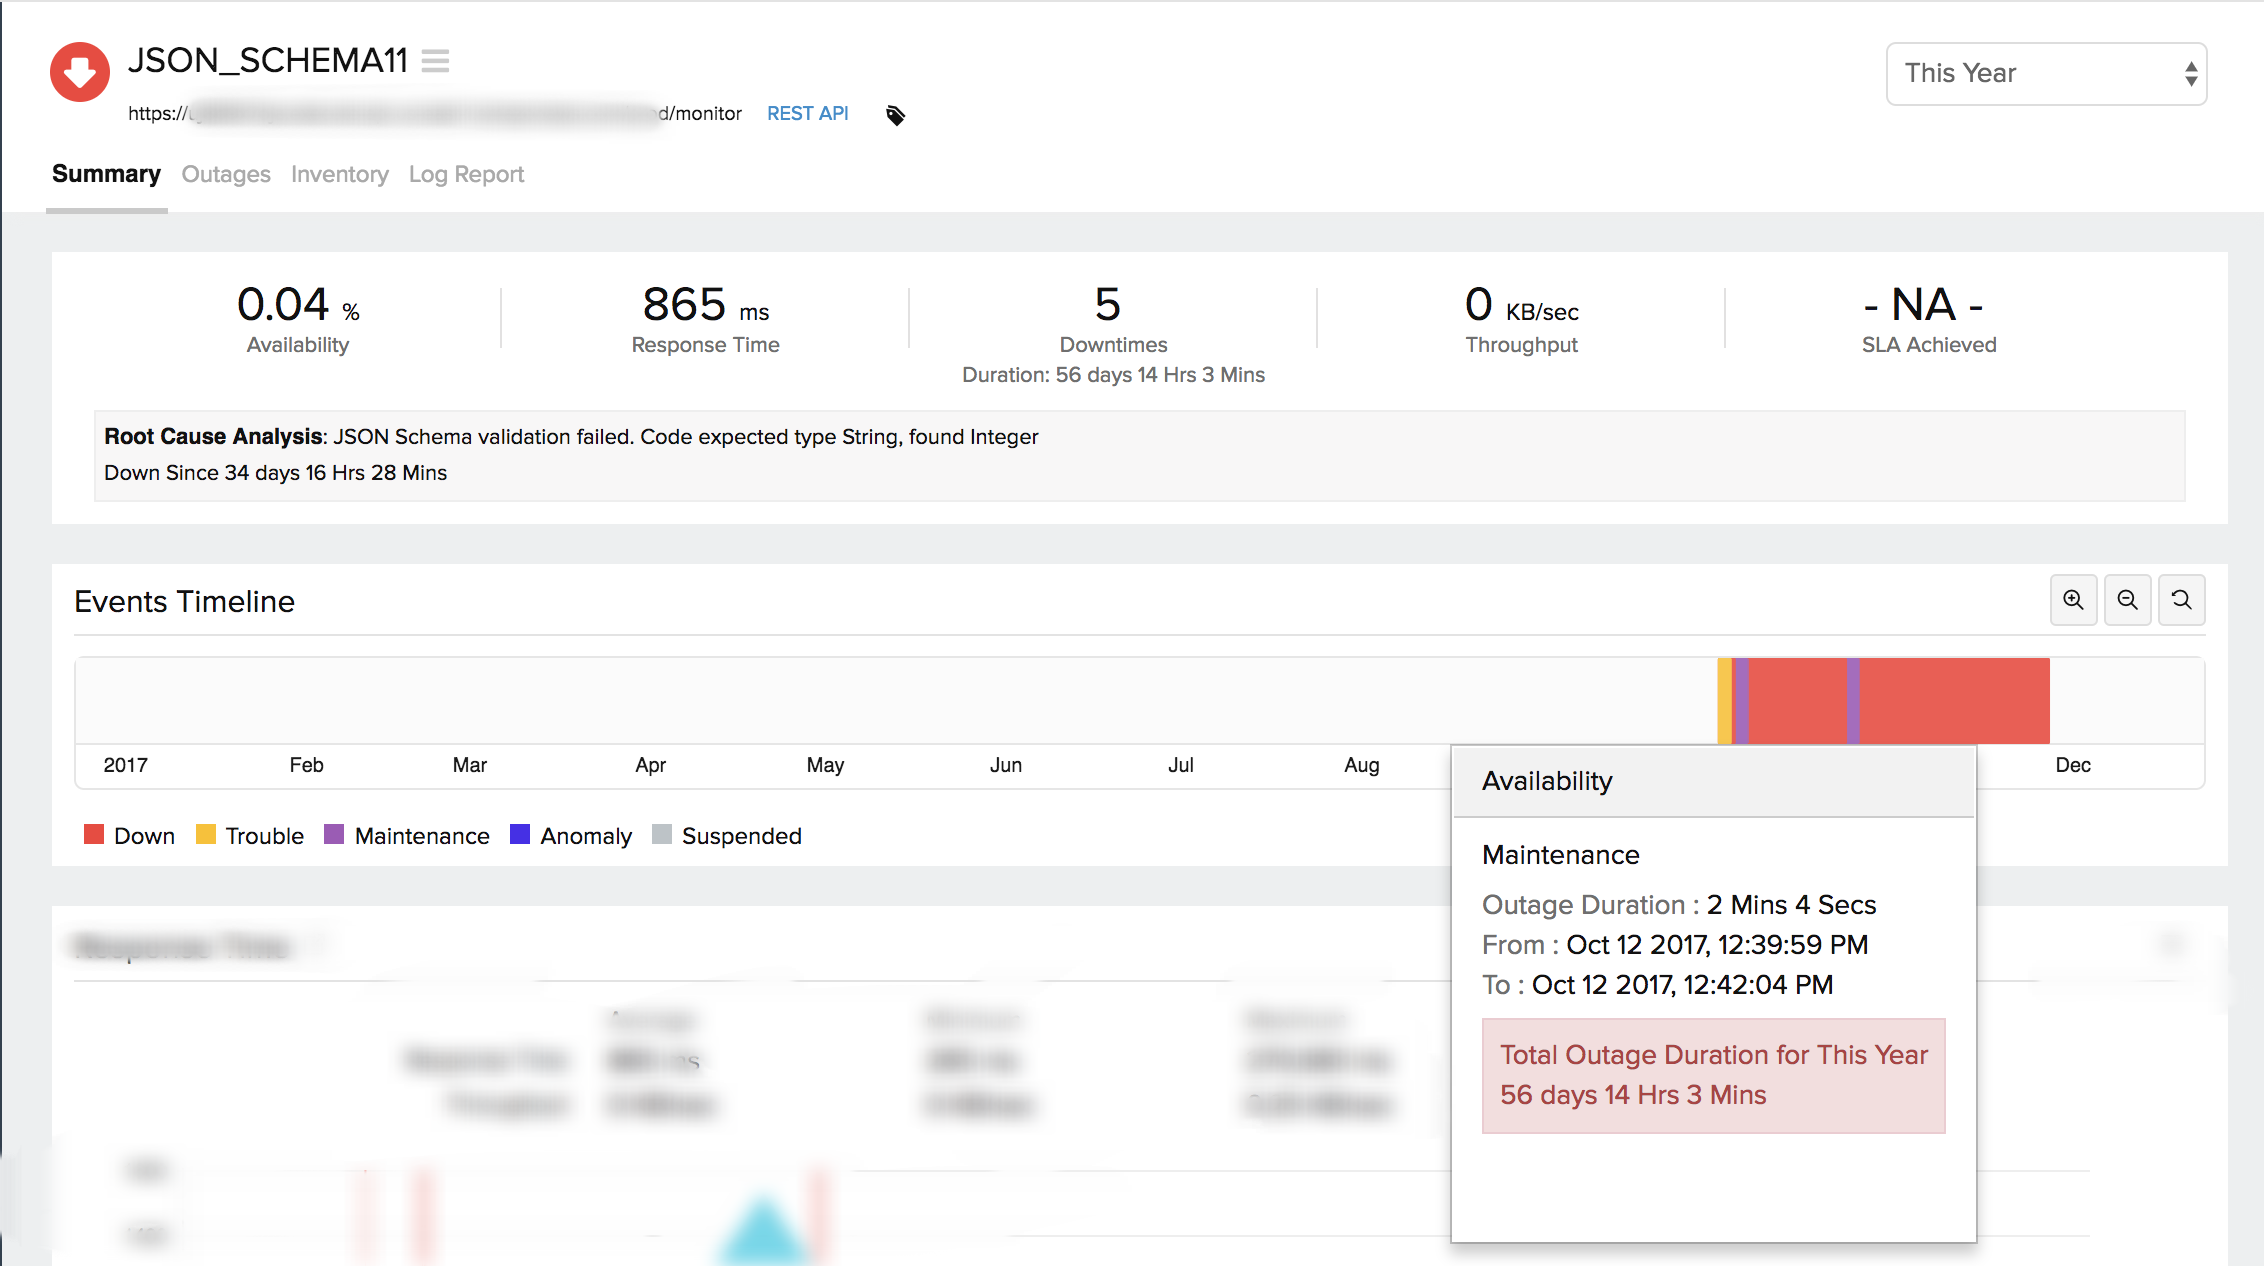
Events Timeline
Events timeline widget records all the past events of your selected monitor for a selected time range. You can identify/decode various events from the past, which includes Down, Critical, Trouble, Maintenance, Suspended, or Anomalies. Each event are color coded for easy identification. Events can be drilled down to extract maximum data and facilitate easy troubleshooting. You can also track the actual outage period and the total outage duration during a specific block of time.
The main result page is divided into three sections:
- Response Time: It is the total time taken to fetch a REST API response. The REST API response can be broken down into DNS lookup time, connection time, SSL Handshake Time, First Byte Time and Download time.
- Throughput: It is a measure of the rate (in KB/Sec) at which response is transmitted during a REST API request.
- Availability & Response Time by Location: It gives a tabular view of location wise availability and response time for a REST API request.
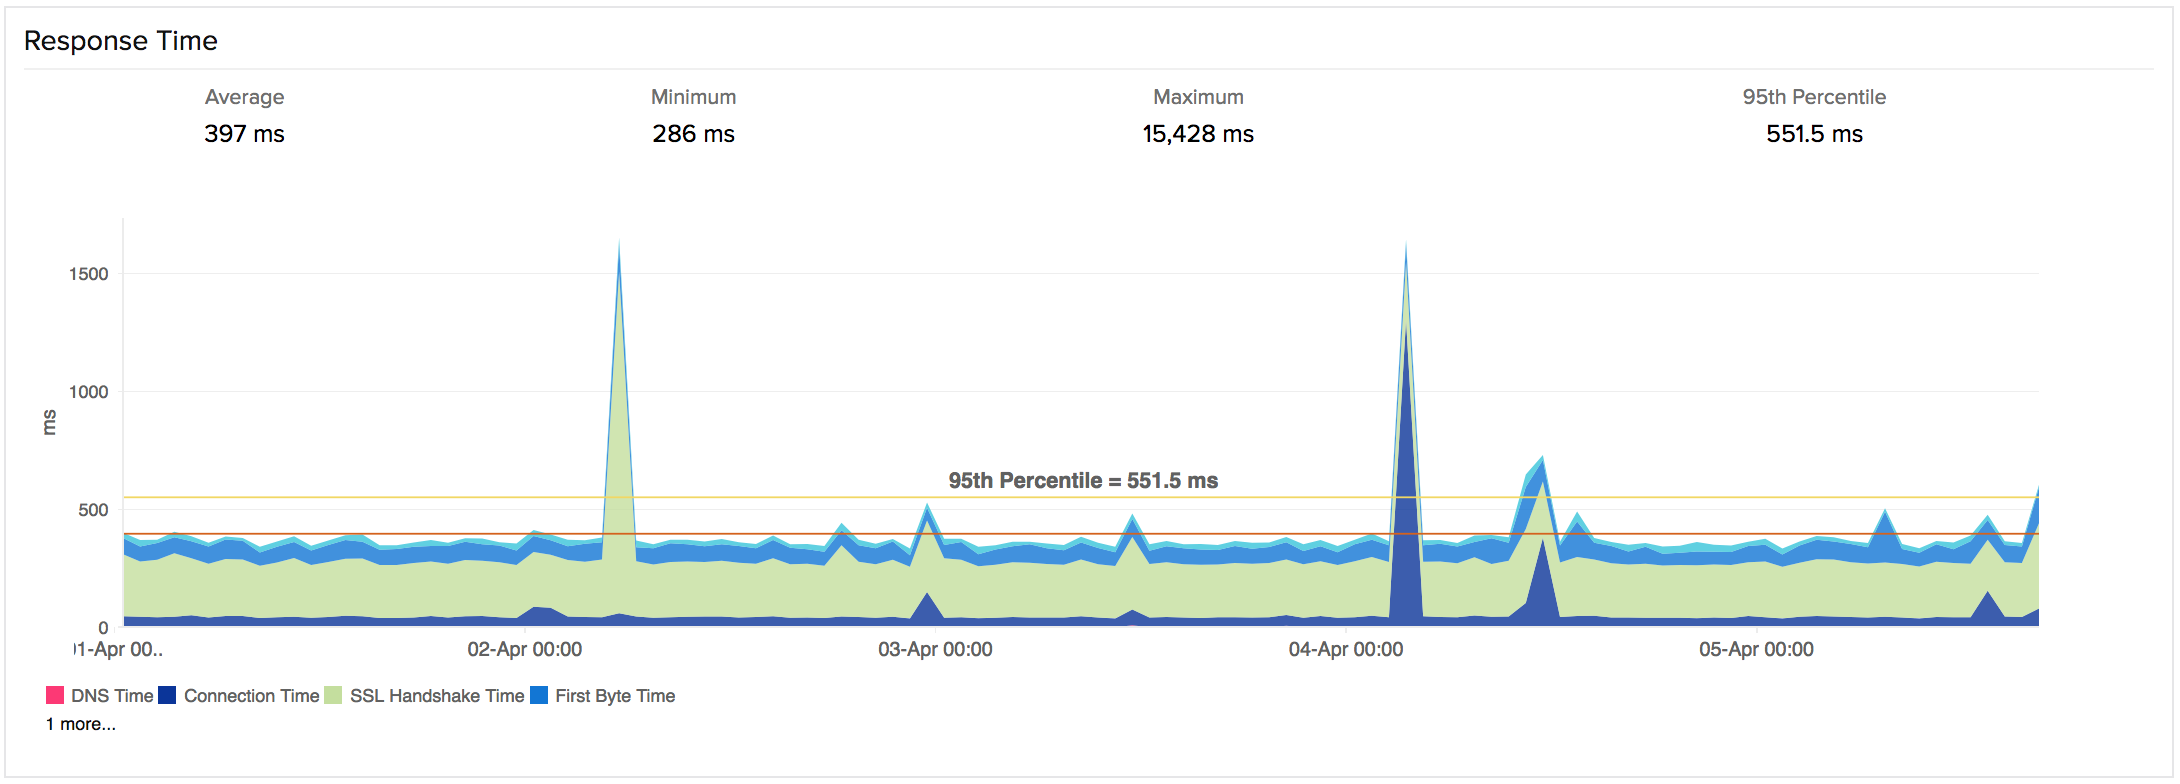
Response Time
The response time of a REST API monitor is calculated as the sum of DNS lookup time, connection time, SSL Handshake Time, First Byte Time and the time taken to download the response in JSON, text or XML. The response time of your REST API monitor across all the monitoring locations for the selected time period is calculated and shown using an area graph, with each component highlighted separately using a dedicated legend marker. You can further filter out the three point, five point moving averages and also the 95 percentile by selecting the appropriate legends. The graph also lets you zoom in and isolate the exact data from the graphical spikes. You can also add specific notes to inform users about the various outages and maintenance activities.
Graphical Representation
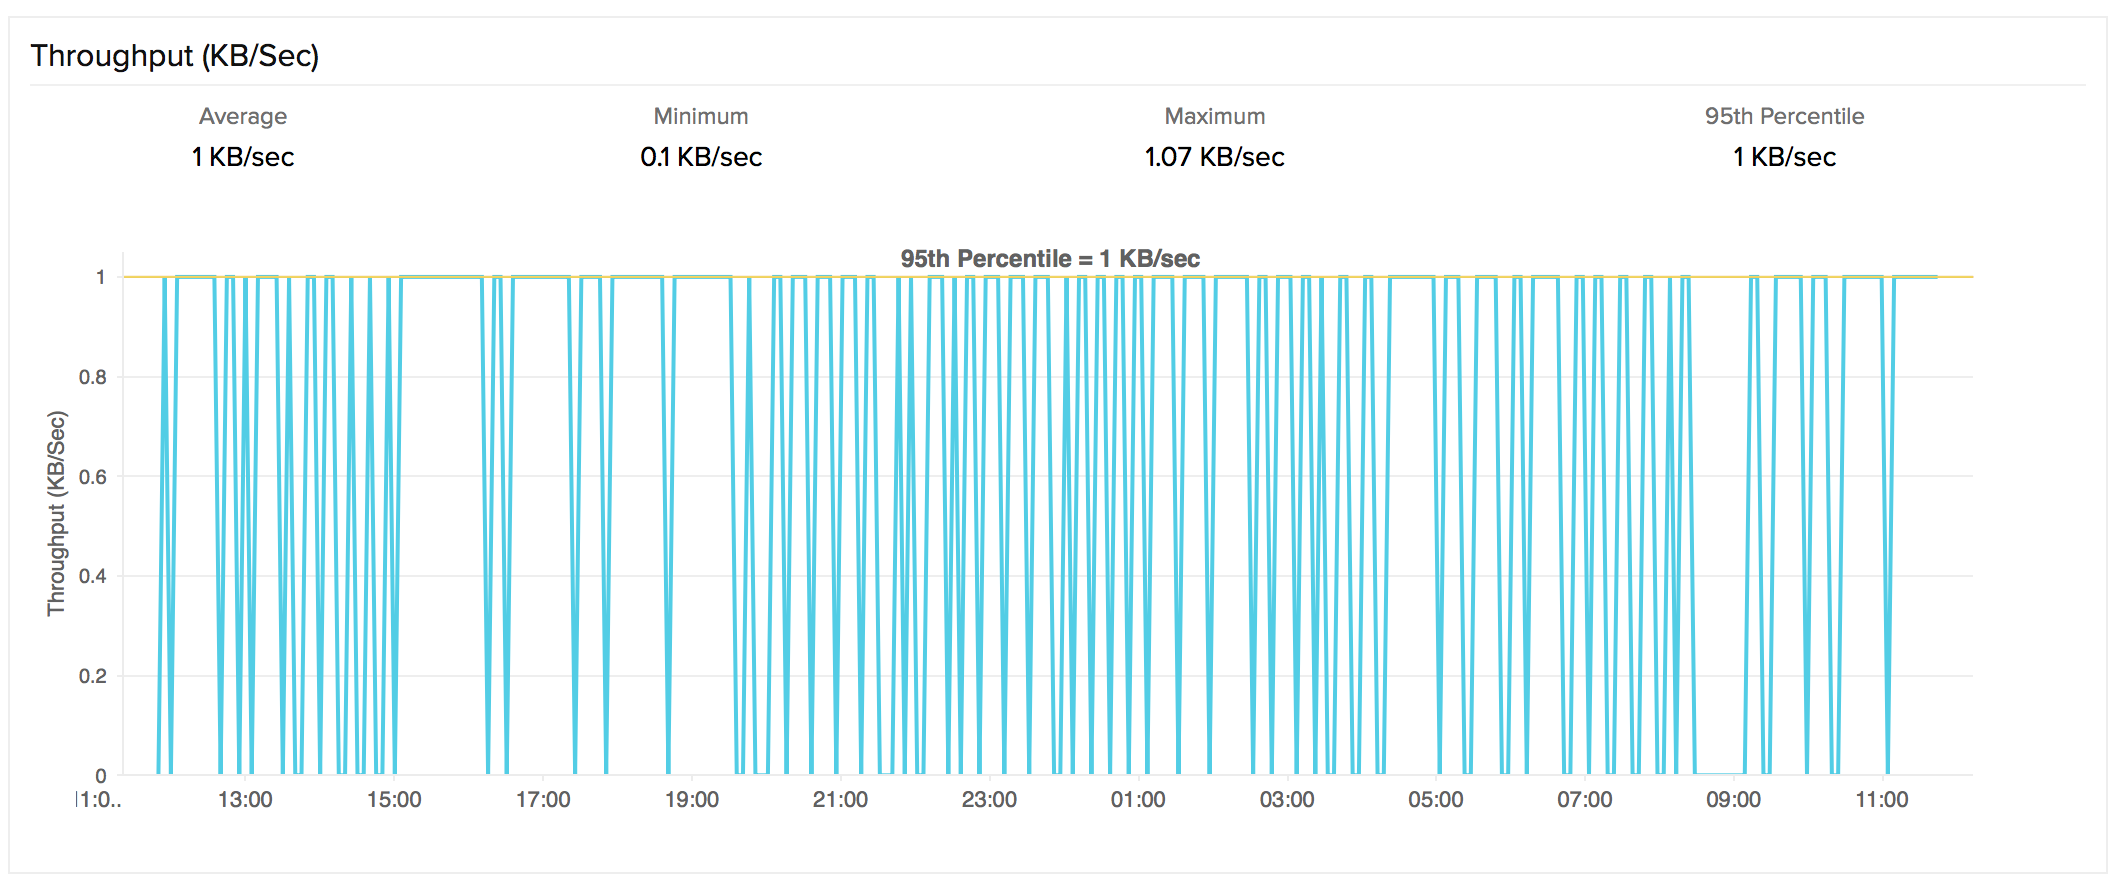
Throughput
Throughput is calculated by dividing the total content length (in KB) by response time (in sec). This data is useful to analyze your connection speed as well as the bandwidth usage of the server.
Response Time by Location
Response Time by Location graph shows the average/95th percentile response time for each day or hour for each monitoring location. This can be employed to check the average/95th percentile response time of your monitors from different monitoring locations. Location legend is provided in the graph for easy administration.

Tabular Representation
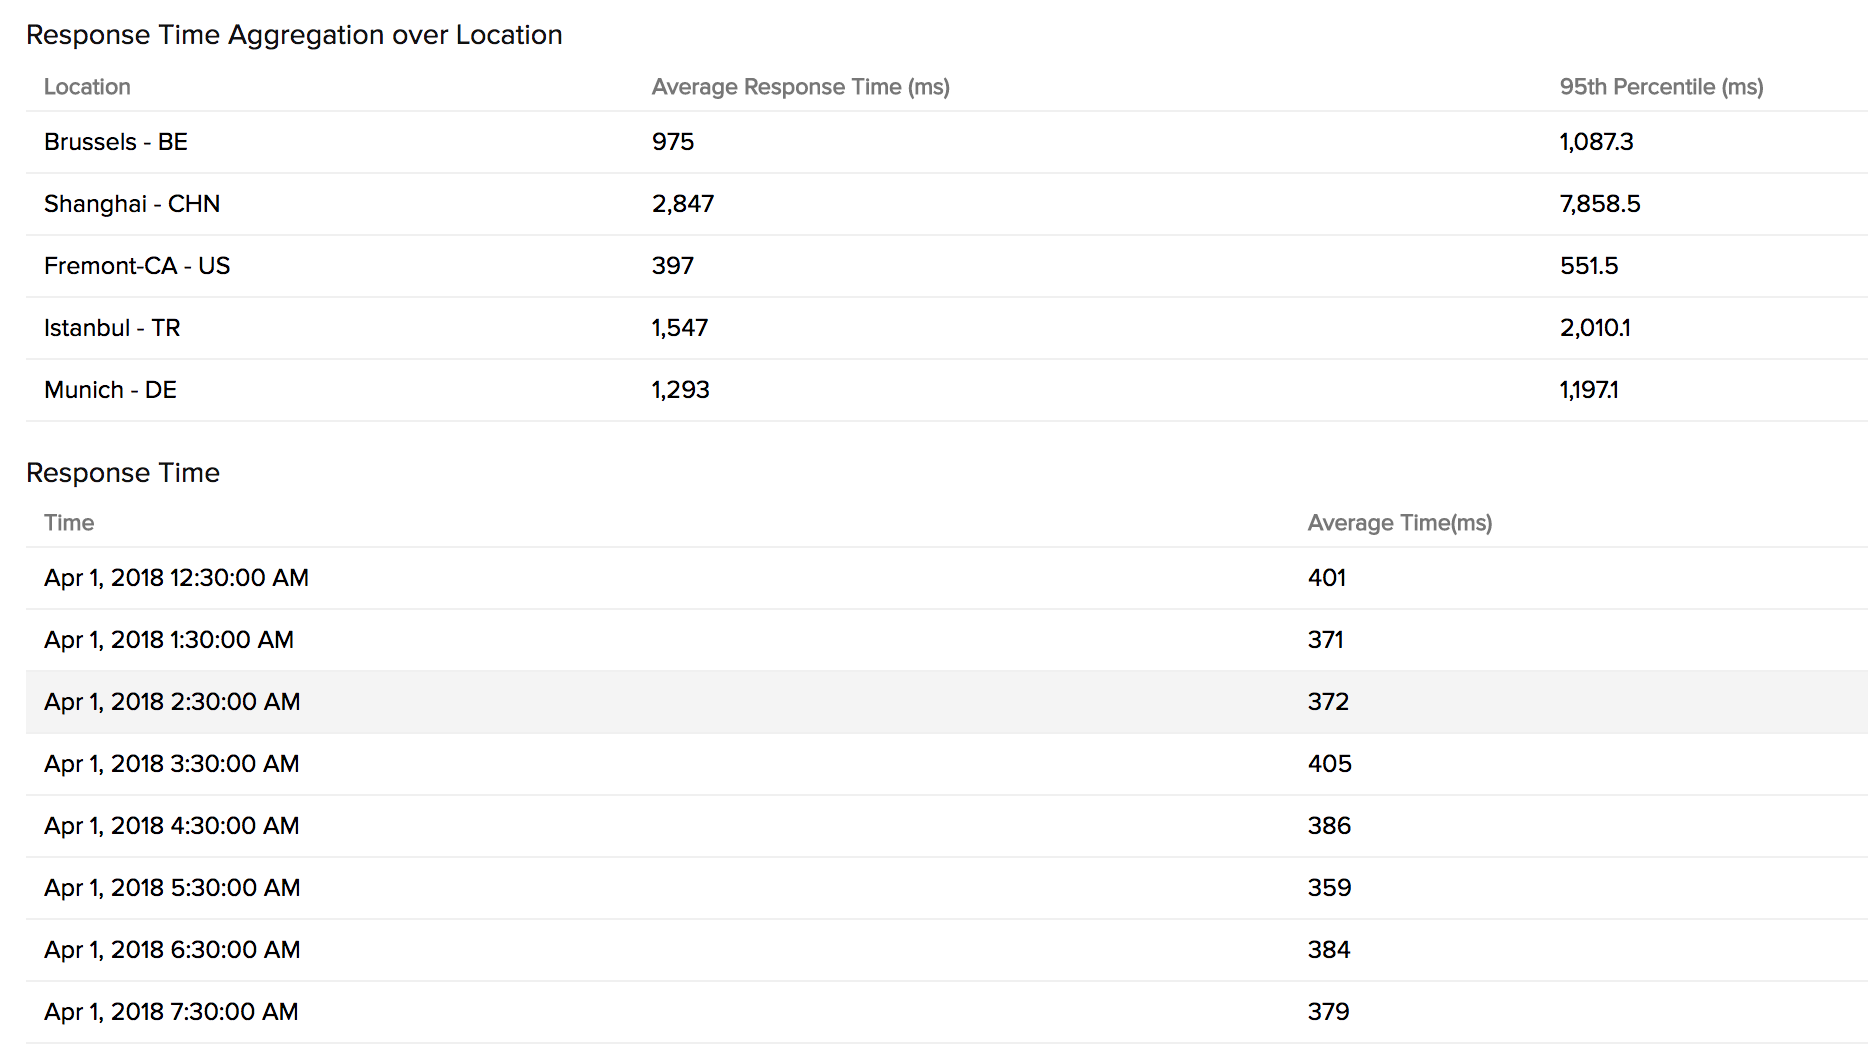
Average Response Time and Average/95th percentile Response Time by Location is shown in detail in the table format.
Geo Map
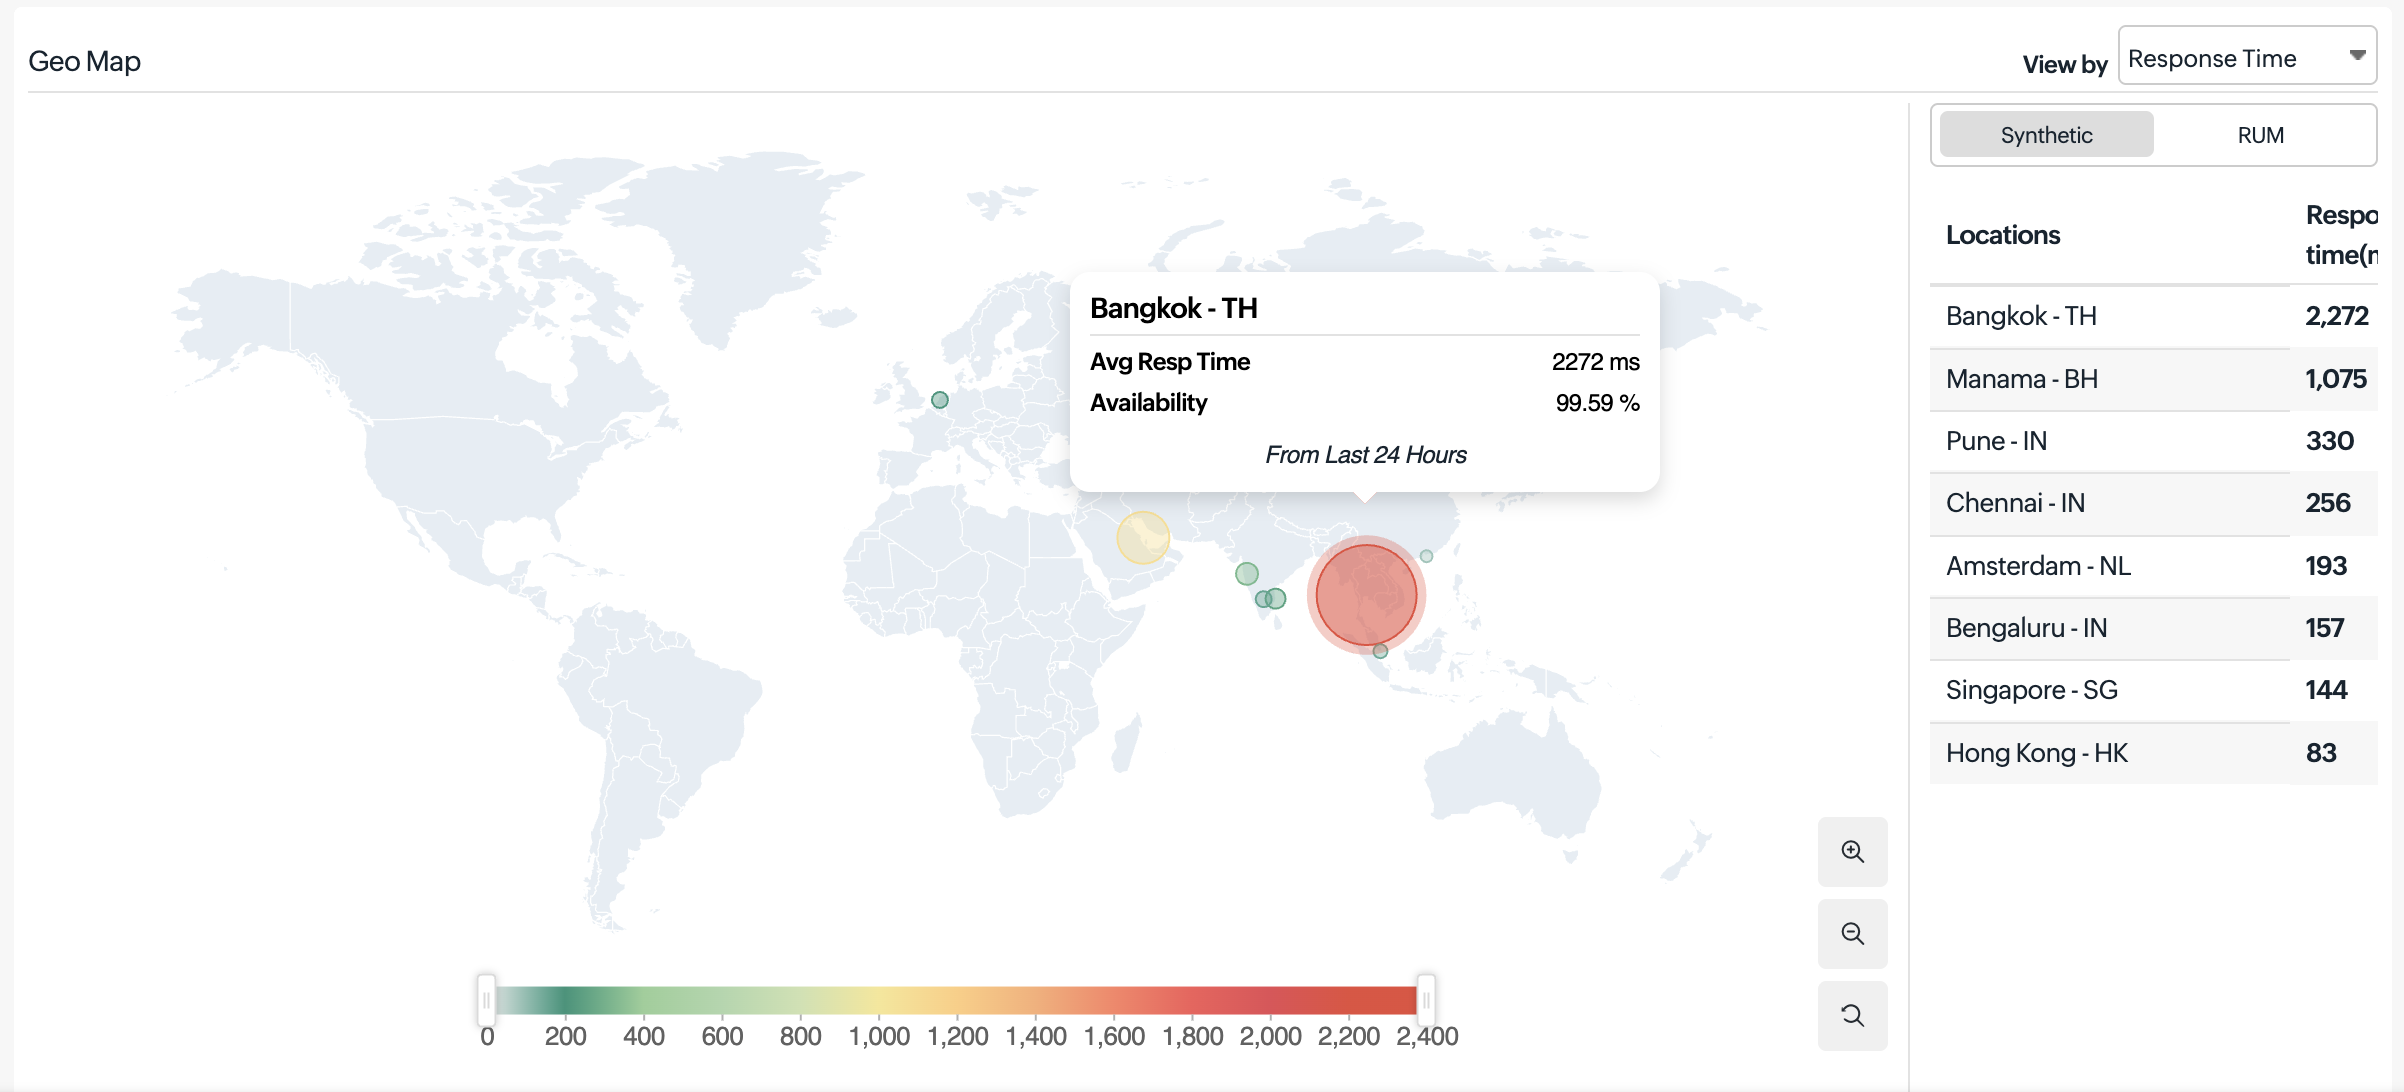
The Geo Map provides a visualization of your REST API’s global availability and performance by consolidating data from synthetic monitoring and RUM sources. It tracks API request execution from monitoring locations and combines it with real-user interaction data. You can hover over different regions to view average response time and other key metrics, helping you understand how your API performs across different geographies.
With the Geo Map, you can quickly identify regions experiencing high latency, detect API failures, and correlate synthetic monitoring data with real-user performance. This helps determine whether issues are localized or widespread, enabling faster detection and resolution of API performance bottlenecks.
View by metrics
Select a metric to visualize availability and performance across locations. The Geo Map dynamically updates based on the selected metric, allowing you to analyze trends and compare synthetic and real-user experiences.
- Response Time: Displayed using color gradients (green for faster responses and red for slower). Bubble size increases with higher response time and decreases with faster responses, helping you identify latency-prone regions.
- Synthetic: Shows API response time collected from monitoring locations.
- RUM: Displays response time as a heat map at the country level based on real user interactions.
Hovering over a location displays a tooltip with average response time, availability, request count (for RUM), and additional performance metrics.
- Availability (%): Represents the success rate of API requests from each monitoring location. A color gradient (green for high availability, red for low) highlights regions experiencing request failures or degraded performance. Hovering over a location displays a tooltip with availability details.
- Current Status: Indicates the real-time status of each monitoring location. The map shows whether the locations are up or down. This view helps you quickly assess the operational state of API checks across all regions.
Updates
You can view the real-time data from the various poll cycles and it includes the outages and trouble alerts data.

Down/Trouble History
It offers detailed insight into the trouble history of your monitor. You can view the status, the exact downtime, duration, and specific reason for the down status.
Availability and Response Time by Location
The Availability and Response time for your REST API monitor for each monitoring location is shown in a table format. The total availability percentage, response time (ms) and down duration from each monitoring location can be inferred from this report.
Outages
You can access the Outages tab in your monitor's details page to gather detailed insights on the various outage and maintenance downtimes. It provides you with sufficient information to troubleshoot issues. You'll also be able to access the root cause analysis reports for your various outages. On accessing the ![]() icon of a listed monitor outage or maintenance, you'll be shown the options to:
icon of a listed monitor outage or maintenance, you'll be shown the options to:
- Mark as Maintenance: Mark an outage as Maintenance
- Mark as Downtime: Mark a Maintenance as Downtime
- Edit Comments: Add/Edit Comments
- Delete: Delete an Outage/Maintenance permanently
Root Cause Analysis (RCA) Report
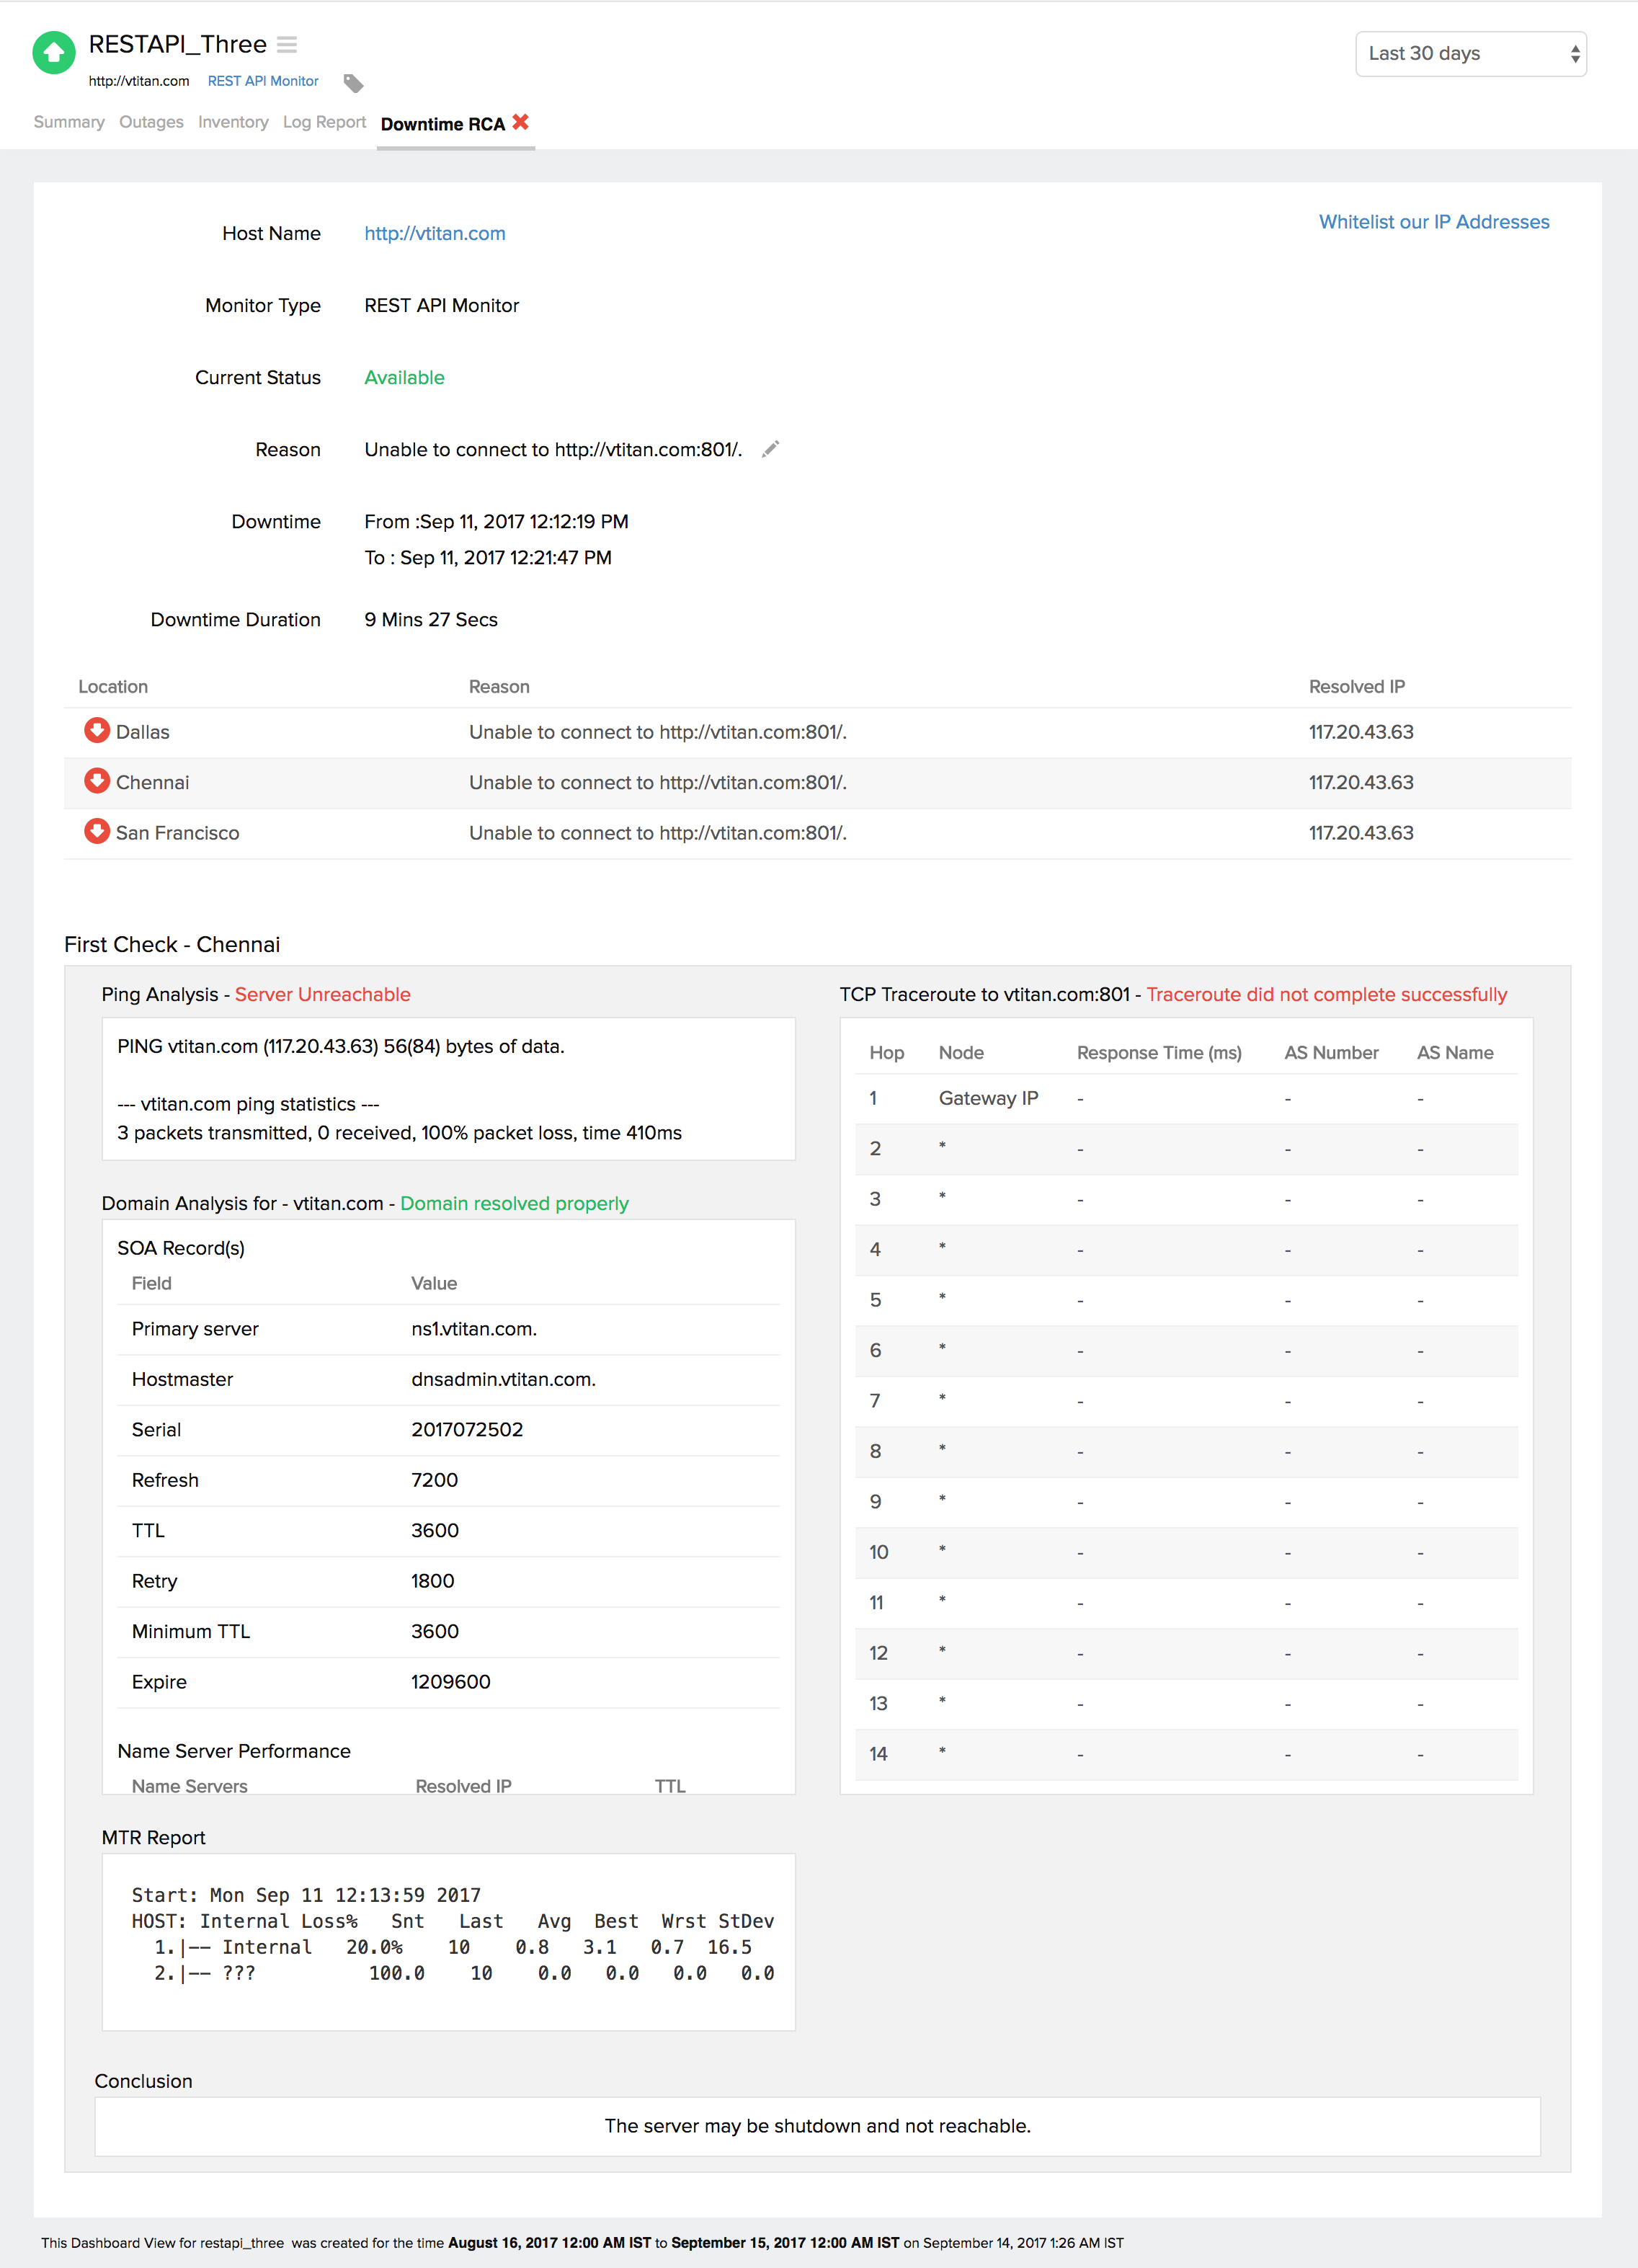
You can retrieve indepth root cause analysis report for your DOWN or TROUBLE monitors after 150 seconds of the monitor reporting the outage. RCA Report gives basic details about your monitor, outage details, recheck details and reasons for the outage. Root Cause Analysis automatically generates a plethora of information to arrive at a definite conclusion as to what triggered a downtime. RCA intends to determine the root cause of specific downtime or performance issue. A normal RCA report will comprise of the following details:
- Checks from Primary location and re-checks from Secondary location.
- Ping Analysis
- DNS Analysis
- TCP Traceroute
- MTR Report
- MTR based Network Route
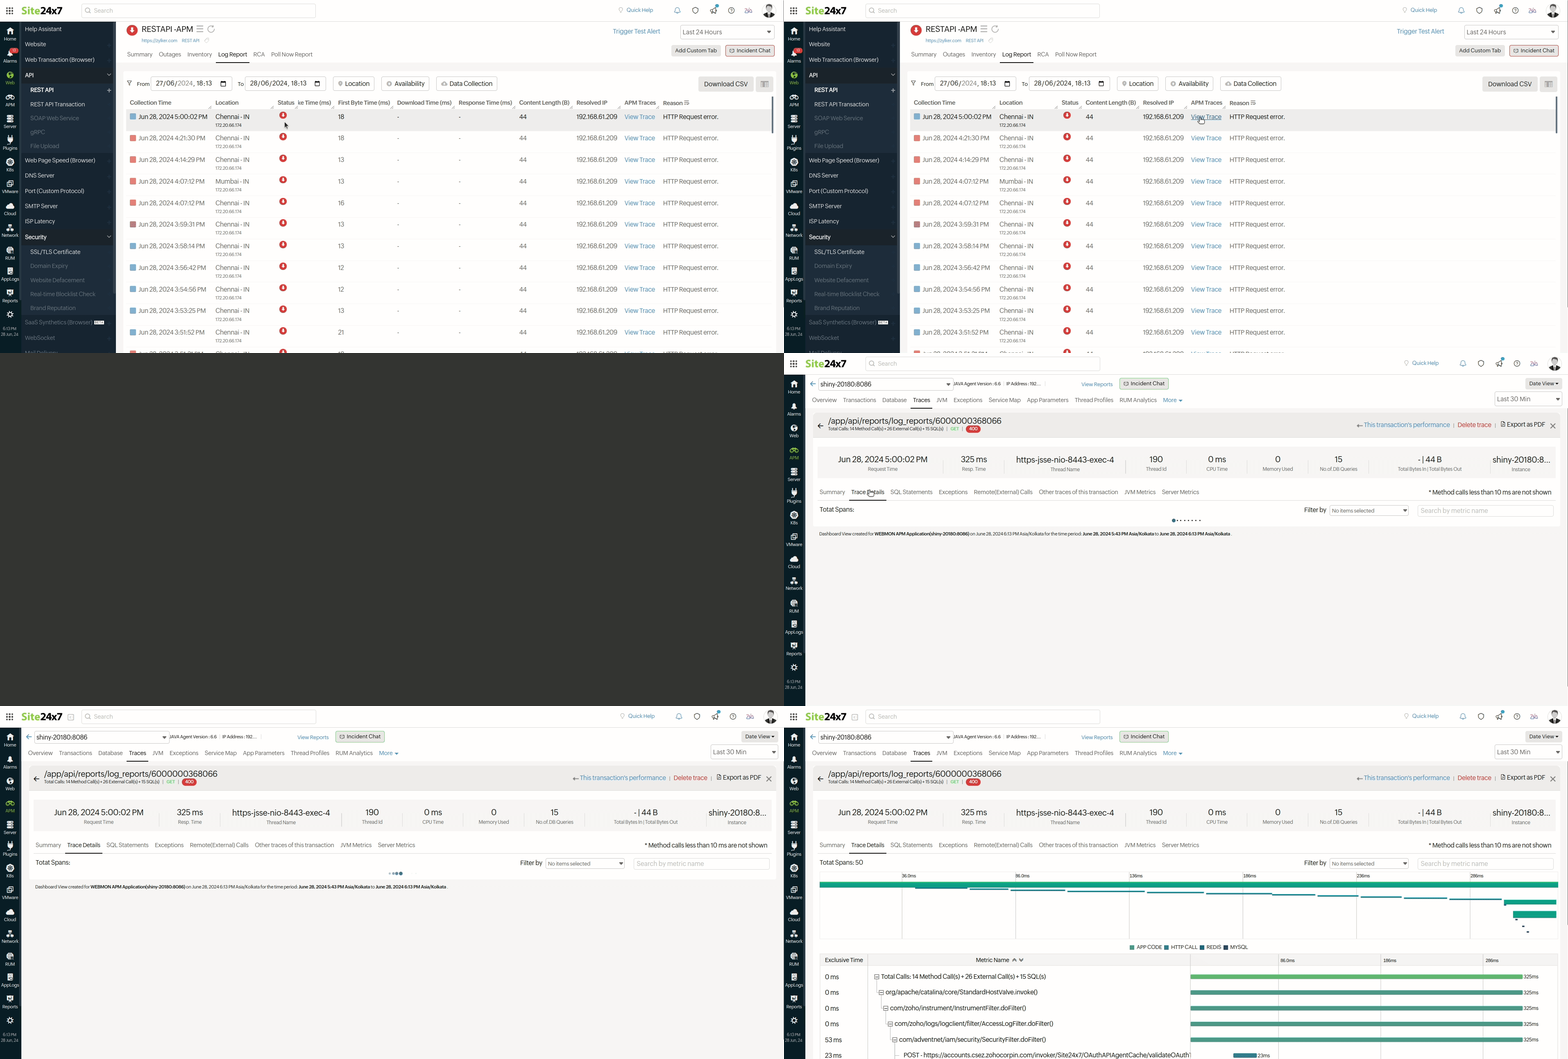
- APM Traces
- View Events
- Conclusion
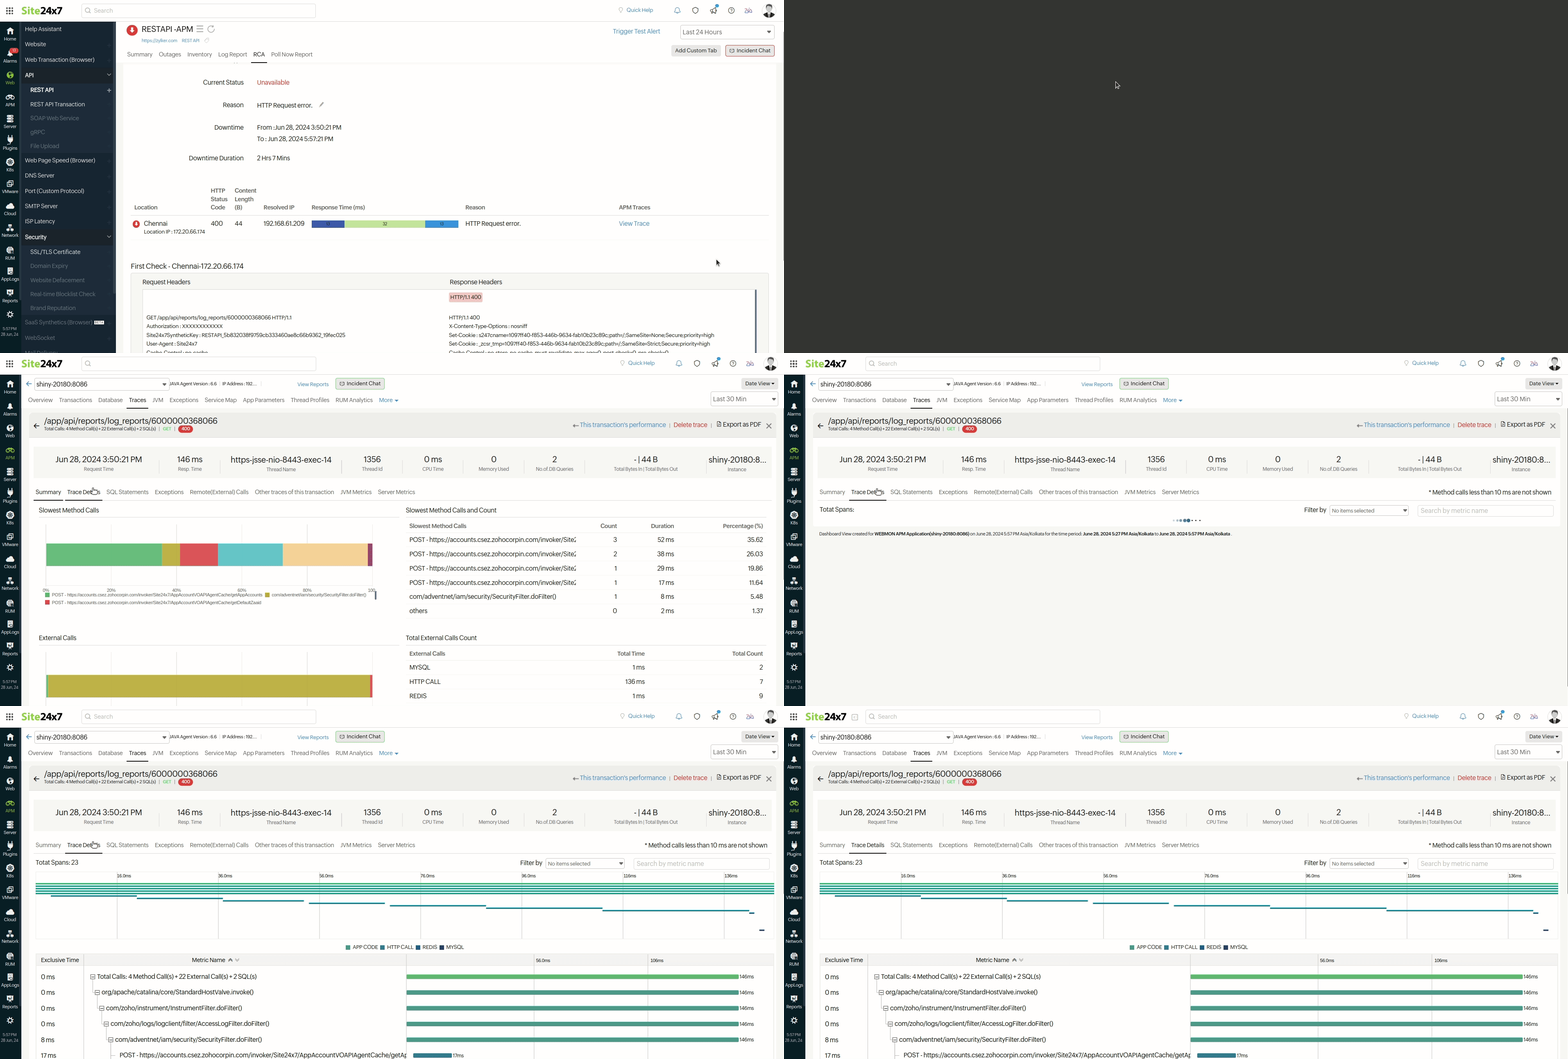
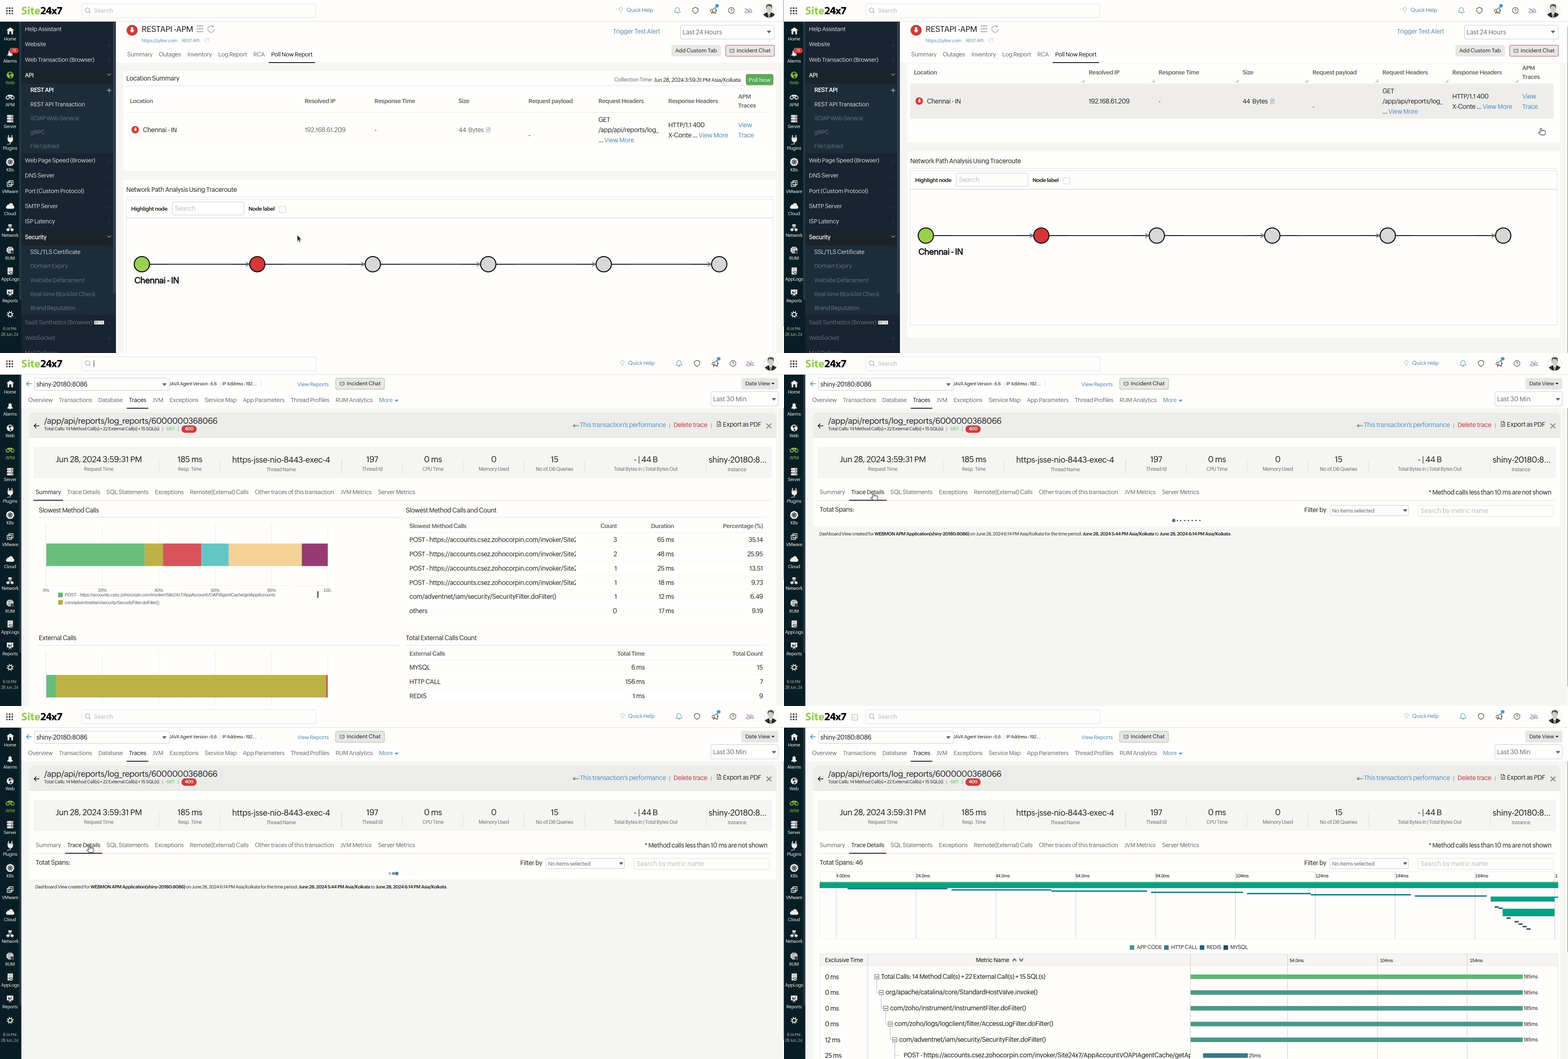
Traces information can help in drilling deep into the health of each component. Refer APM Traces to know more.
View Events
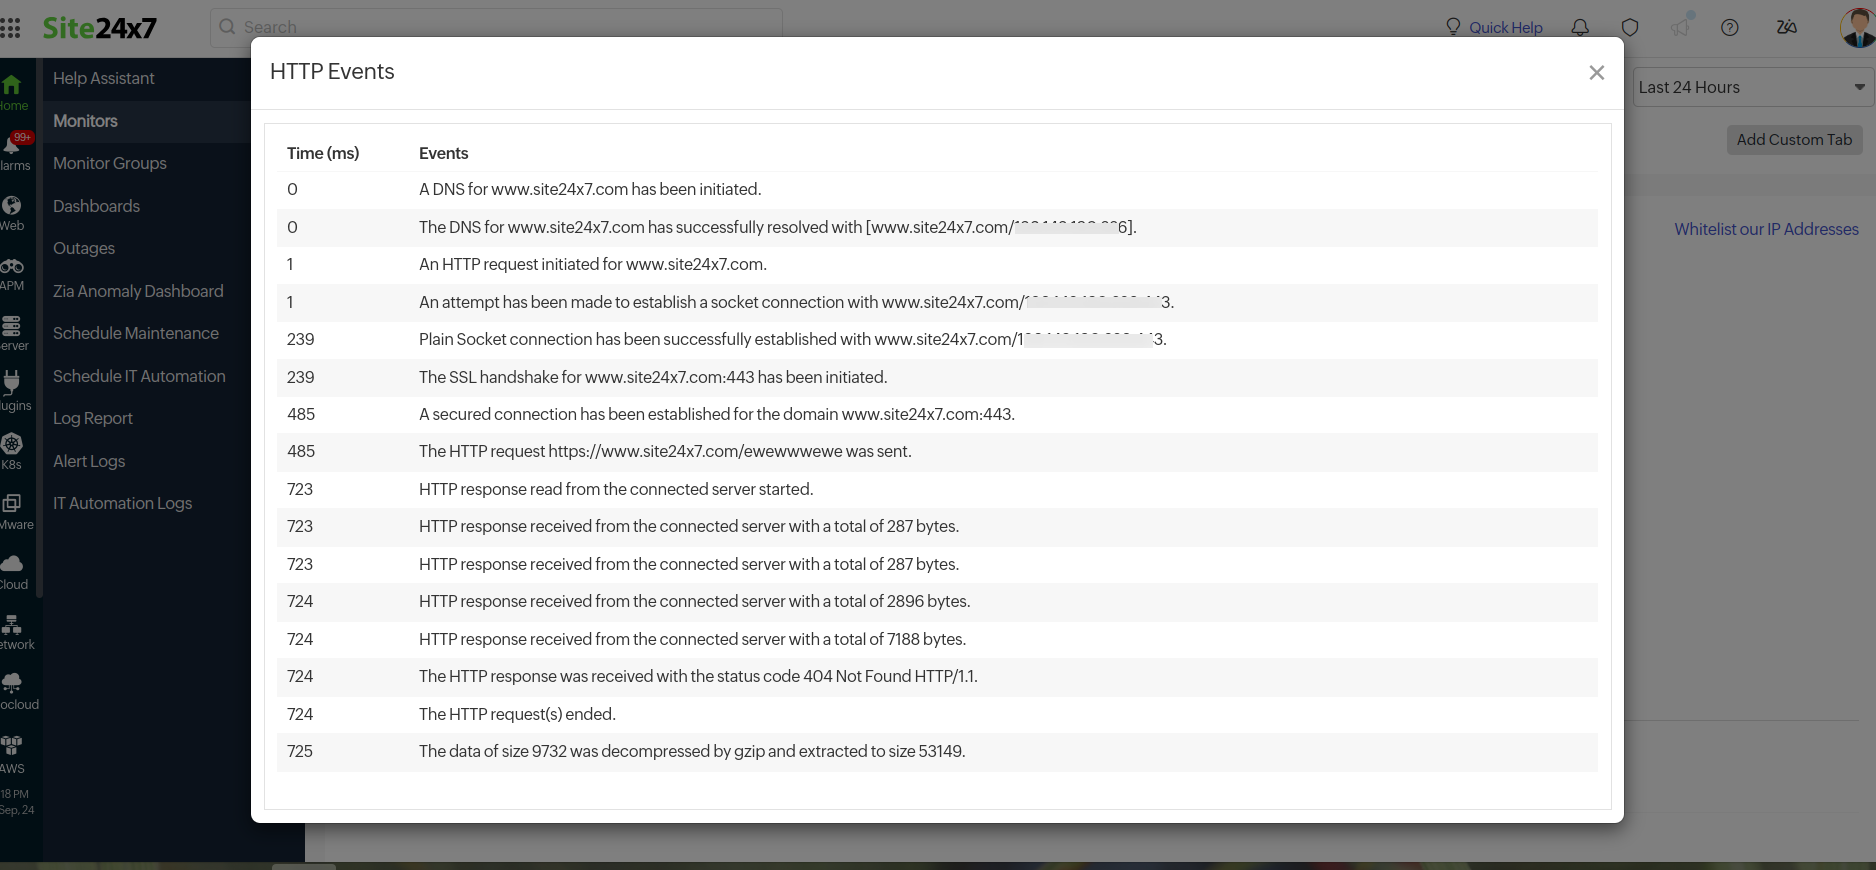
You can view a list of events that occurred during the downtime for a specific location. This will help you obtain a detailed analysis for your RCA report. Click the View Events link to access the list of events, including the corresponding time in milliseconds.
Inventory and Notes
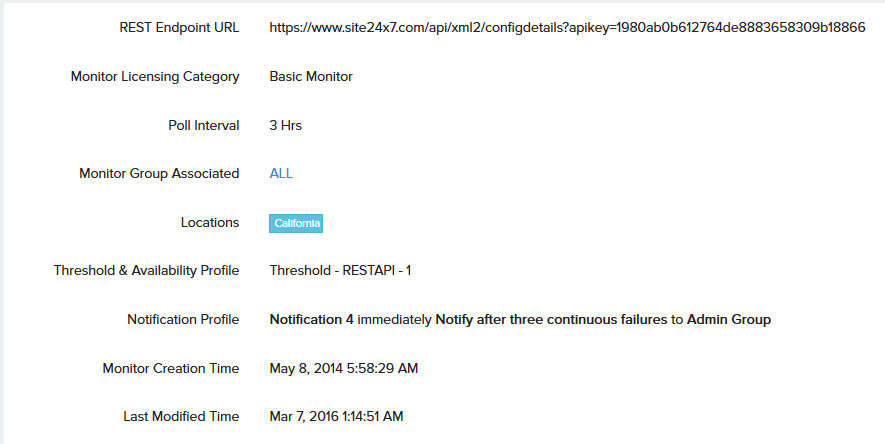
This section captures the basic monitor information and also its various configuration settings including polling locations, poll interval, licensing type, and more.
Poll Now Report
You can initiate a Poll Now from the Details page to generate the Poll Now report. The report includes specifics like SSL/TLS protocol version details, and other Cipher suite details like Key Exchange, Bulk Encryption, and Hash Function. You can also gain more information on request and response headers and Traceroute output information from all your monitoring locations. Poll Now report is valid for a day from the time you initiate a manual poll."
Log Report
With our integrated log records for individual monitors, you can get an indepth knowledge about the various log details for the configured monitor, over a custom period. You can also filter the log based on location and availability. You have an option to download the Log Report in CSV format.
Clicking the desired row in the Log Report will take you to the Collection Summary.
- Collection Summary
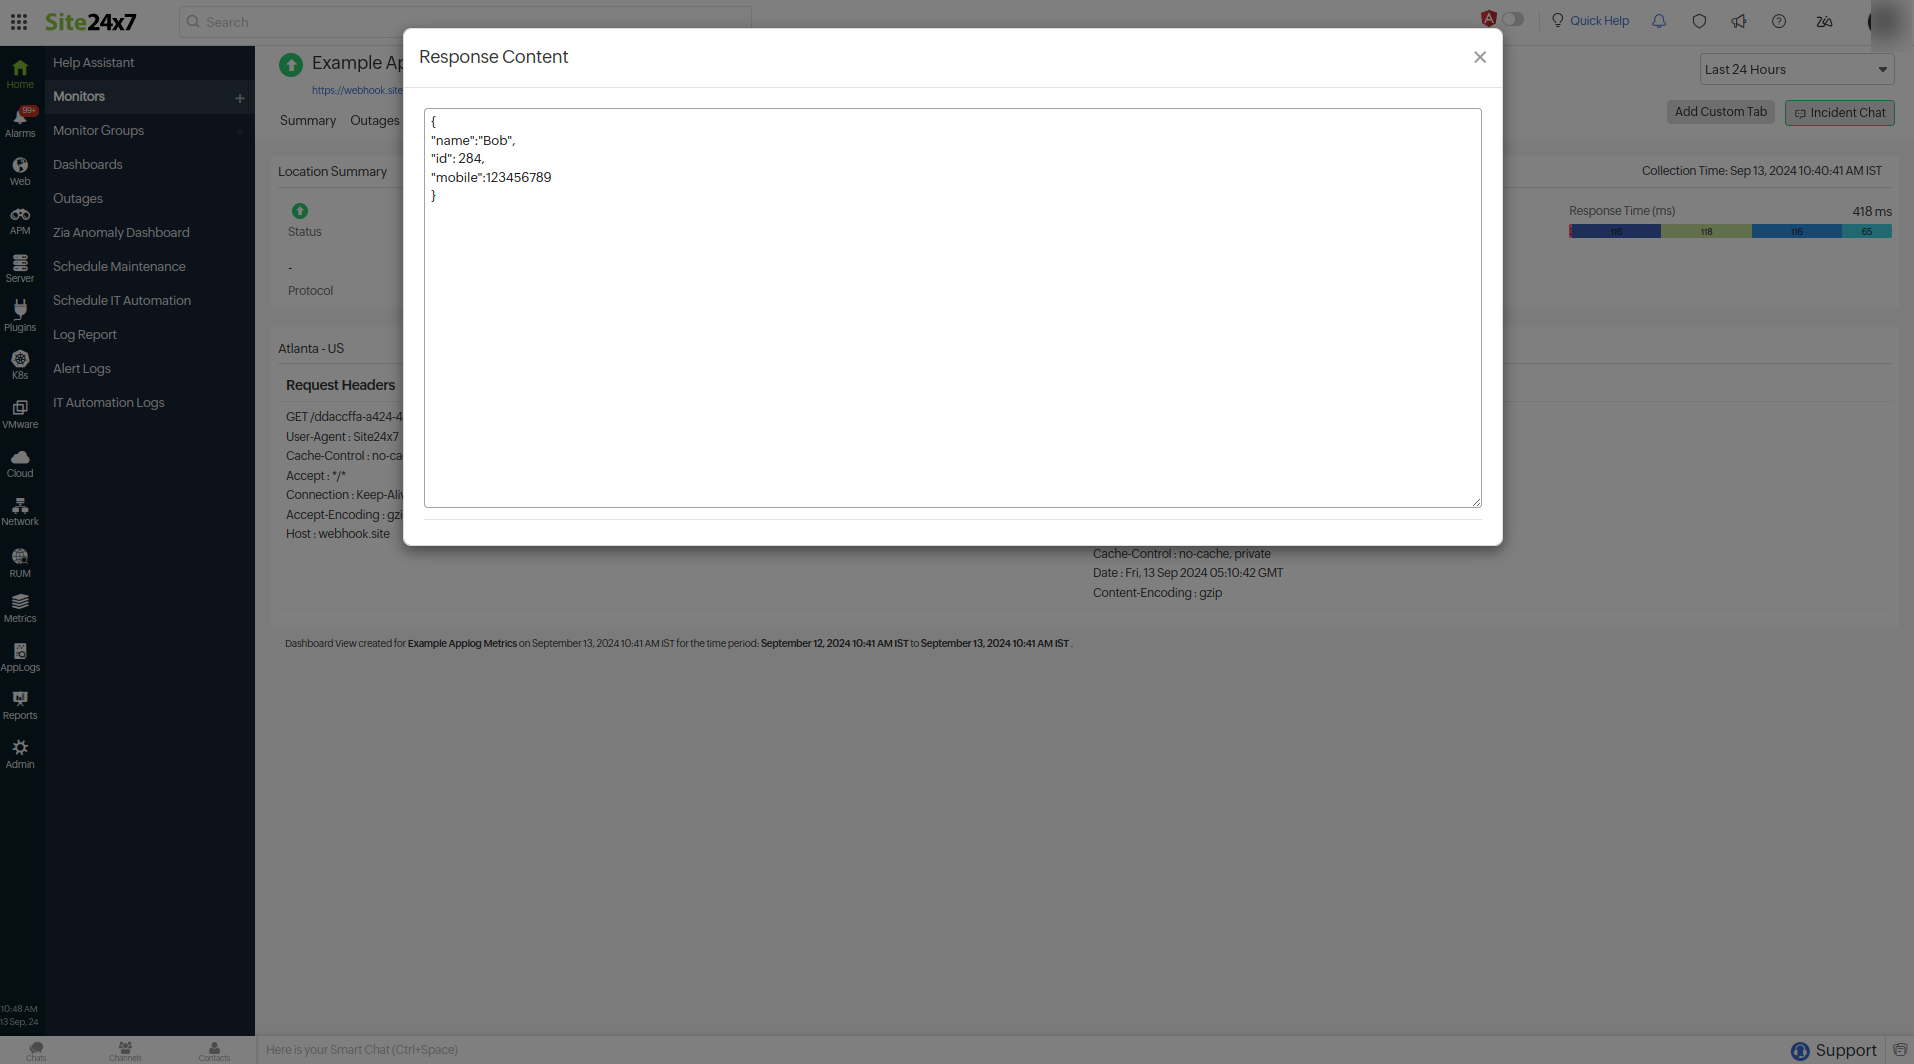
This report provides a detailed location data collection summary based on a particular location's status and time. It includes the Status, Location, Resolved IP, Size, Response Time (ms), Protocol, Bulk Encryption, Key Exchange, and Hash Function. Additionally, this report displays the Request Headers, Response Headers, and Response Content.
Clicking the page icon (
 ) next to the Size will display the Response Content of your website or REST API.
 Note
Note- The Collection Summary report is only available if the Store Data Fields option is enabled in the monitor configuration.
- The Collection Summary report will be available for the cases below:
- All Up poll entries for individual locations
- HTTP status code errors, including errors like 400 Bad Request, 404 Not Found, and 500 Internal Server Error
- Locations marked with a Trouble or Critical status, including content check failures, availability or unavailability, string mismatches, and JSON or XML validation failures
- Response times exceeding the configured threshold
- The Collection Summary report will not be available when:
- The endpoint cannot fetch the responses and has connectivity errors that include error messages such as Connection cannot be established, Domain name is not resolvable, and Connection timed out.
- AppLogs
You can view all the request headers, response headers, and responses in AppLogs. When you select the check boxes for the Store Data Fields option and save the monitor, the log type Synthetic Monitor – URL will be created in AppLogs.
AppLogs is Site24x7's log management service that allows you to upload and manage logs from your entire infrastructure on a single dashboard. You can use an easy-to-understand query language to filter out invalid values and quickly obtain actionable insights.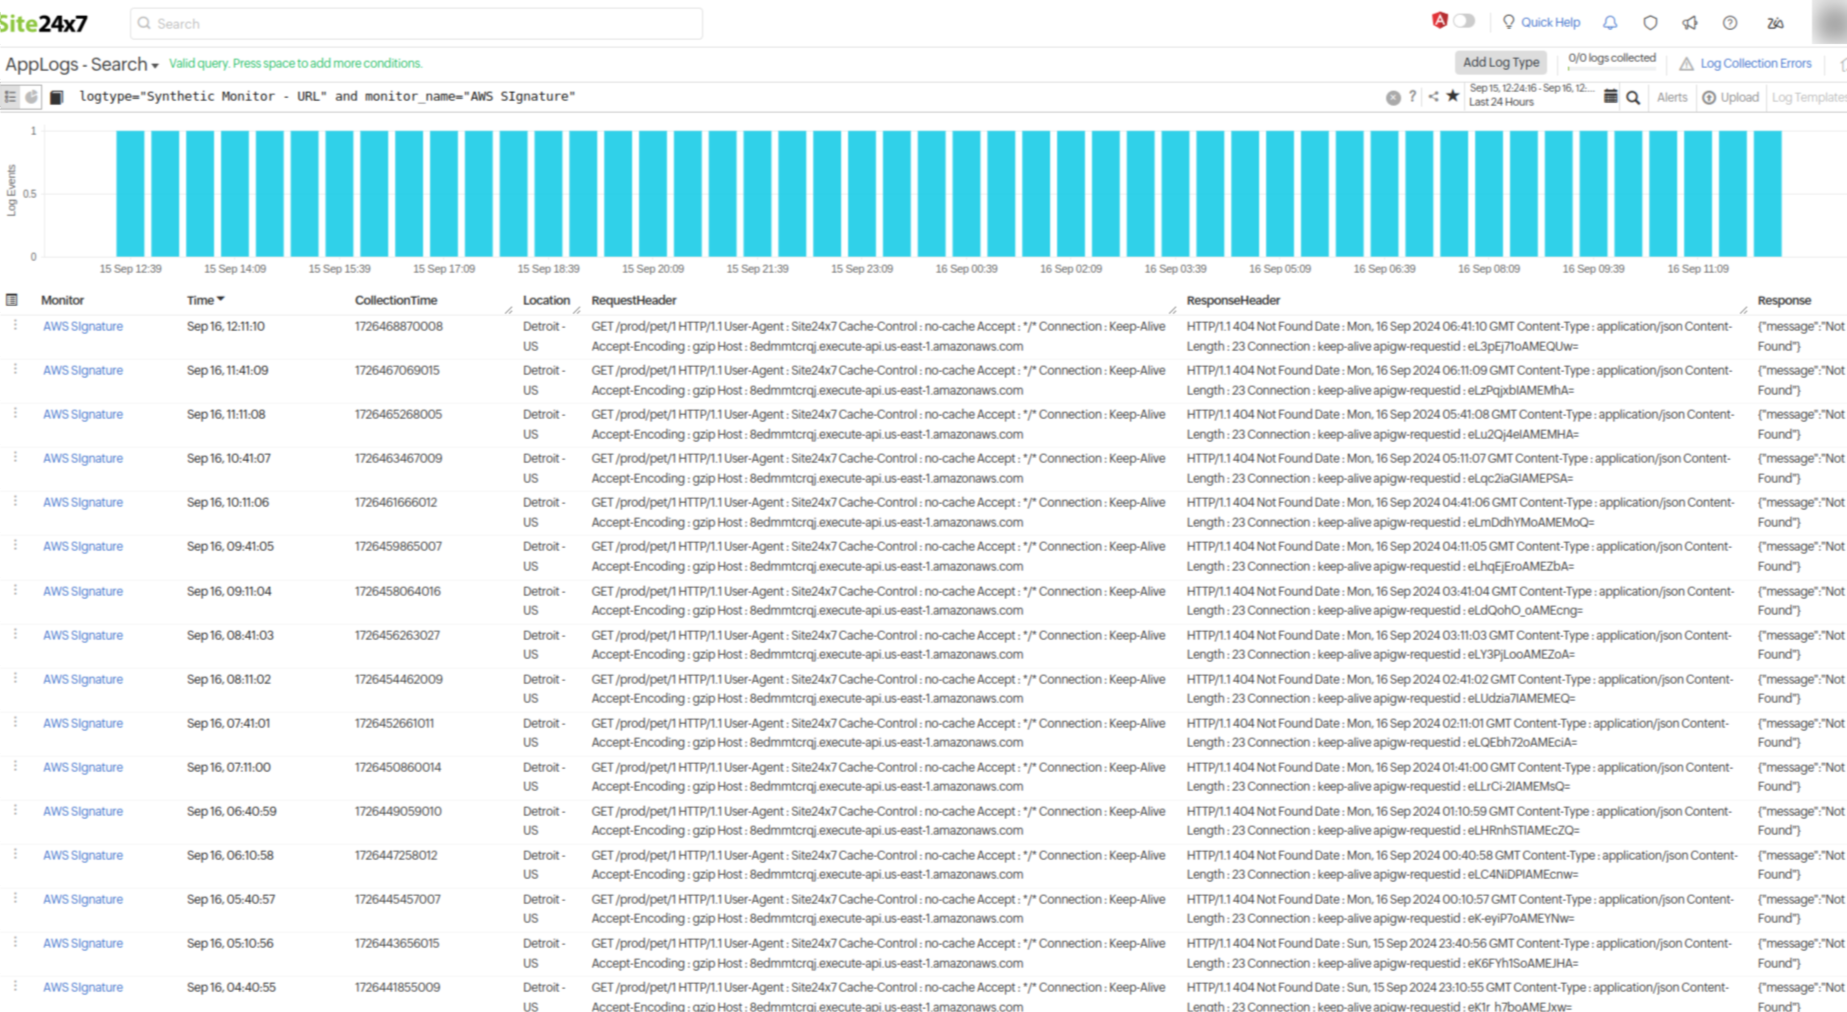
Log space is allocated according to your plan and license. Additional add-ons can be purchased if needed. For further assistance, contact us at sales@site24x7.com.
Learn more: How to set up a REST API monitor?
Read all about REST API monitoring tool
