Server Reports
Site24x7 Server Monitoring provides exclusive reports to easily understand the collected performance data, analyze trends, and identify performance degradation issues. In addition to the common reports available for all monitor types in Site24x7, server monitoring has some exclusive reports. They are:
Log in to Site24x7 and go to Reports > Server Monitor to access these reports. Choose the All Server Monitors option from the Monitors/Tags drop-down for a preset time to view data across server monitors in your account. Click on the Share This button to export these reports as CSV, PDF, or send them via email.
If you don't find the kind of report you are looking for, create your own report.
Server Disk Partition Report
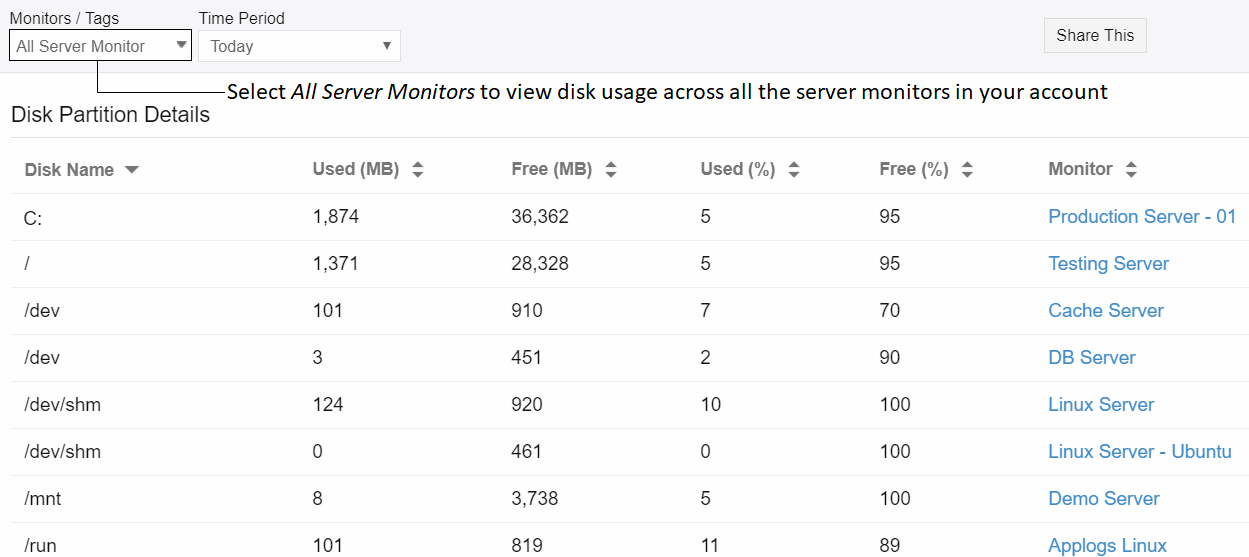
Know the used and free disk space across servers/for two or more servers in your account. This can help identify the partition that is using up lot of space/has a lot of free space and perform the required action (eg. clean up) by going to the respective server (click on the monitor name under Monitor).
Server Network Adapter Report
Get a consolidated list of network adapter details like the total amount of data and packets sent and received across servers/for two or more servers in your account. This helps in forecasting the current and future consumption of bandwidth to maintain network performance of your servers.

Agent Inventory Report
View all servers monitored in your account, based on their agent version, IP address, OS type, associated threshold profiles and configuration templates. Use the Search Filter bar at the top right corner to quickly view servers based on their version, OS type, or associated profiles.

Services and Processes Reports
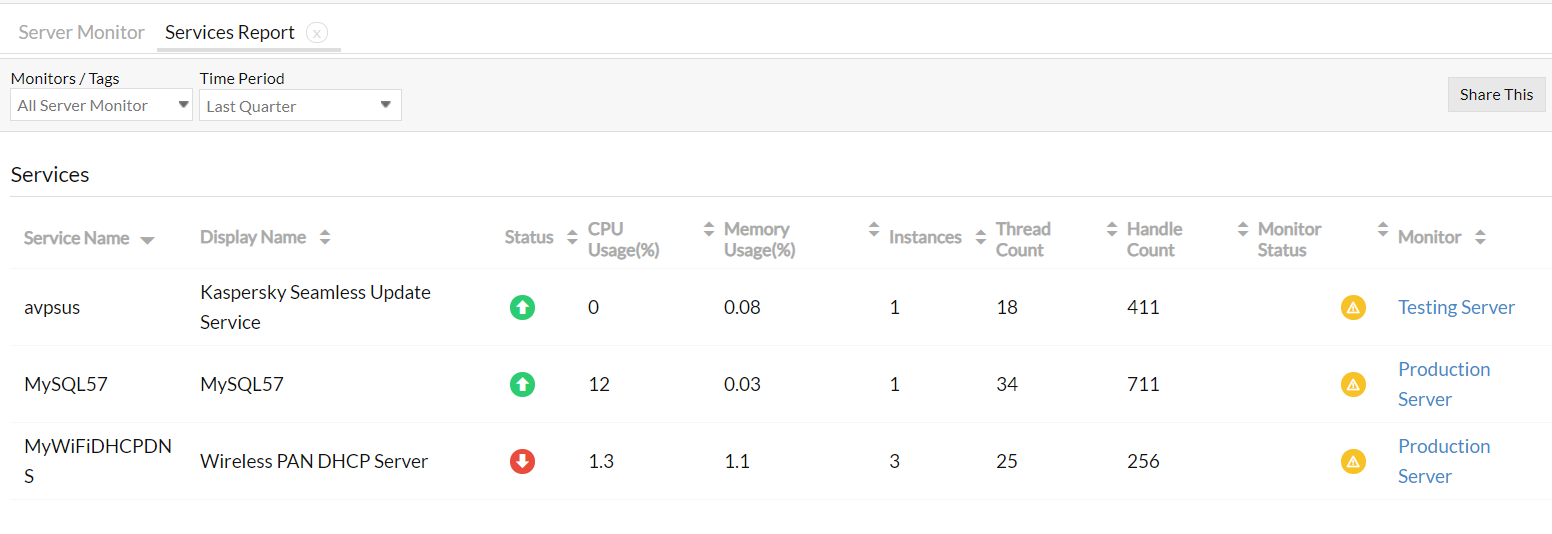
The Server - Services Report and Server - Processes Report lists down the Windows services and Linux processes respectively across servers/for two or more servers in your account.
User-wise Resource Consumption Report
This report provides detailed insight into CPU and memory usage on your servers, broken down by individual users over a specified time. It enables you to monitor how different users impact server performance, which is crucial for capacity planning.
This helps you to identify users responsible for high CPU or memory consumption and track resource usage patterns during peak business hours.
Server Top Process Report
This report provides a visual representation into the most resource-intensive processes on a server. It helps you optimize performance, improve resource allocation, and enhance troubleshooting. By identifying processes that consume the most CPU and memory, you can address performance bottlenecks, make informed decisions, and ensure a stable server environment. This report is essential for maintaining optimal server performance and providing a seamless user experience.
Top N & Bottom N Reports
The Top N & Bottom N Reports lists the top N and bottom N resources with the highest and the lowest values respectively. The resultant data is displayed in a tabular format in descending and ascending order of the monitored parameter. Site24x7 provides Top N & Bottom N Reports for:
- CPU
- Memory
- Disk usage
- Process CPU/memory usage
- Packets sent/received
- Error packets
- Bandwidth utilized
- System idle percentage
- Used/free physical memory
- Disk idle/busy percentage
- 15 min load average
- Partition used space (%)
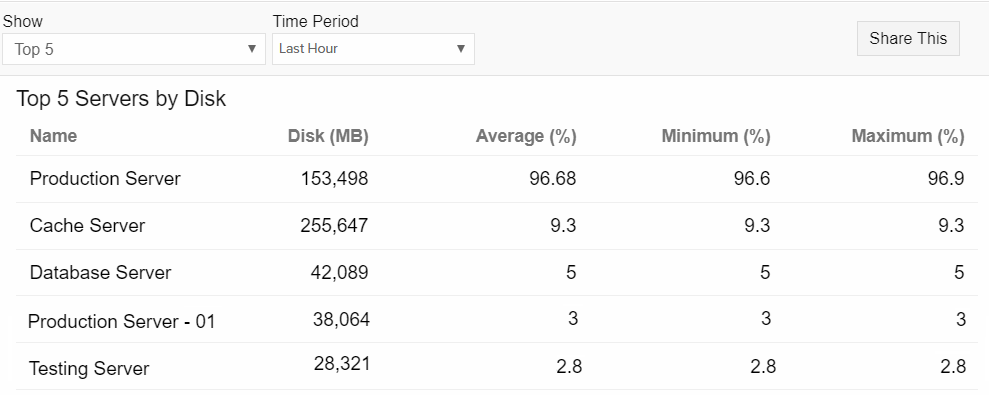
The reports list the top and bottom 5, 10, 20, 25, 50, 100 servers having the highest and the lowest CPU, memory, or disk usage for a preset time period. For example, the below screenshot lists the top 5 servers based on disk usage in the last hour:
Monitor Status Report
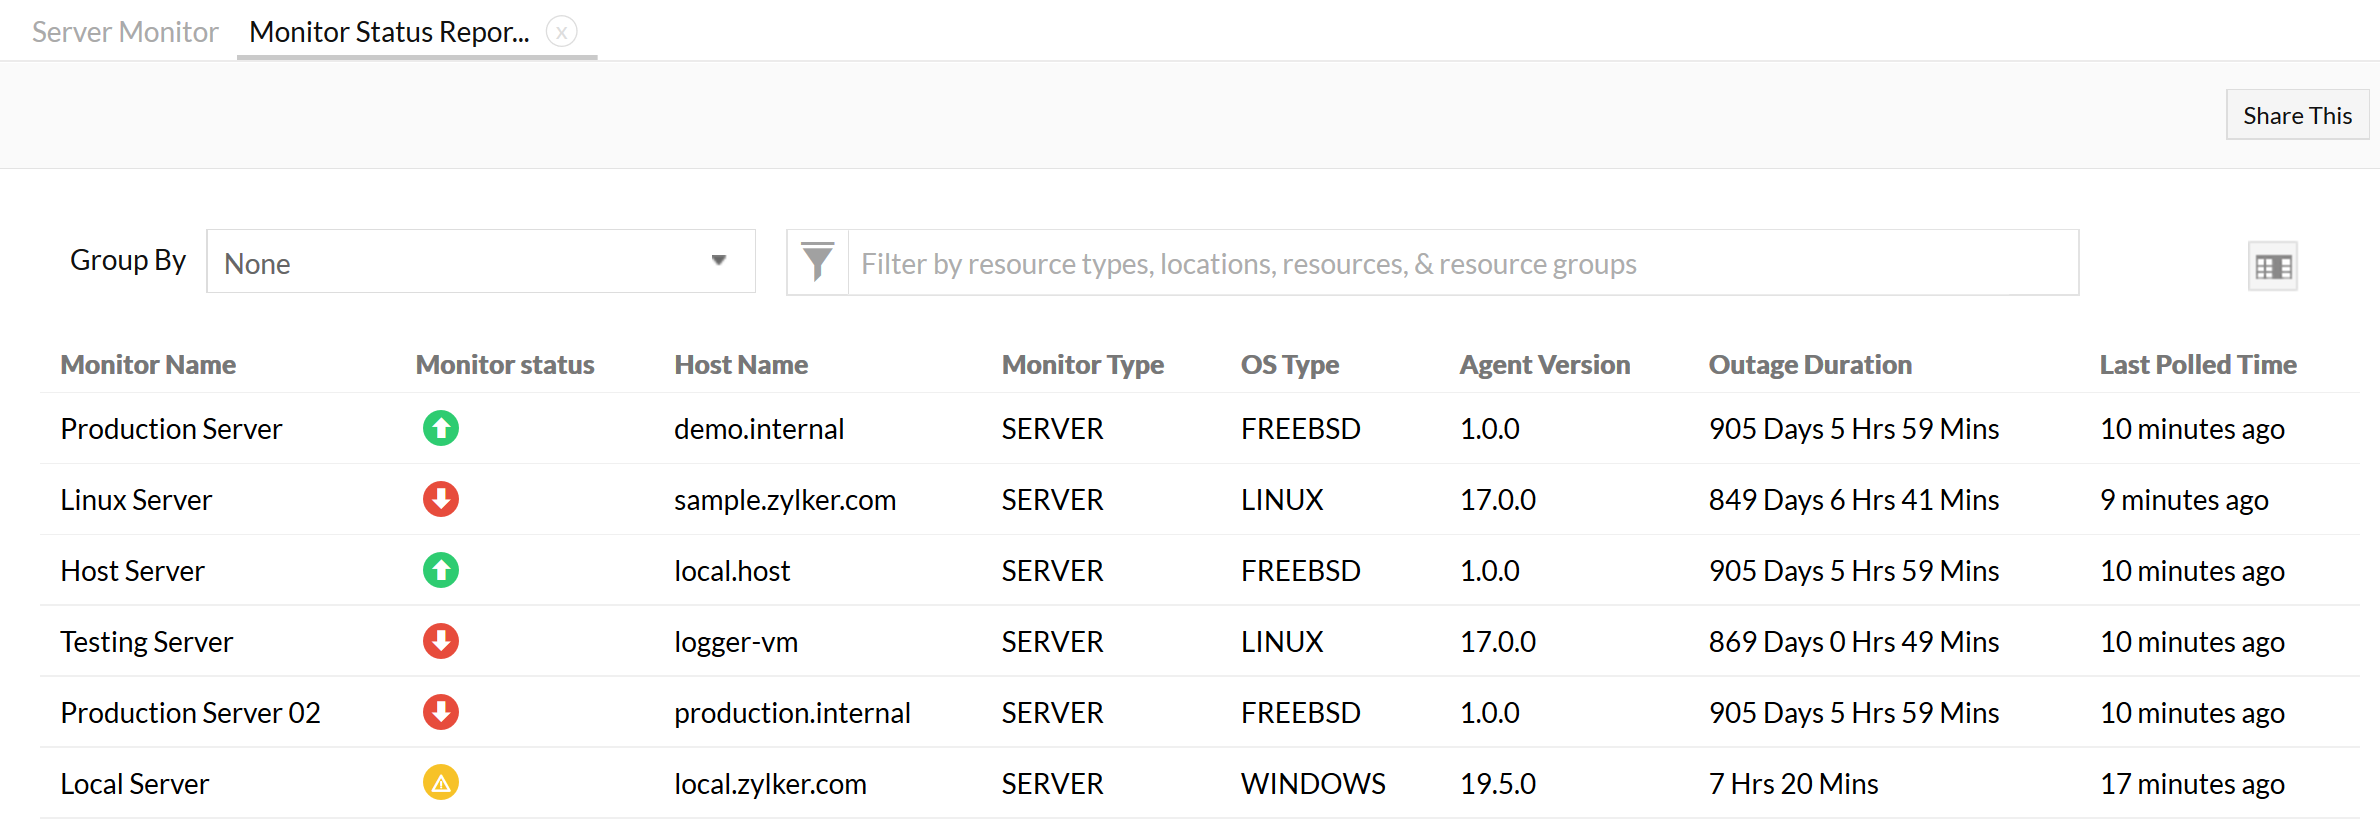
View servers based on their monitor status, hostname, outage duration, agent version and more. Use the Filter bar at the top right corner to filter and view servers based on your requirement. You can also schedule this report and send it as a PDF file to the desired user contact.
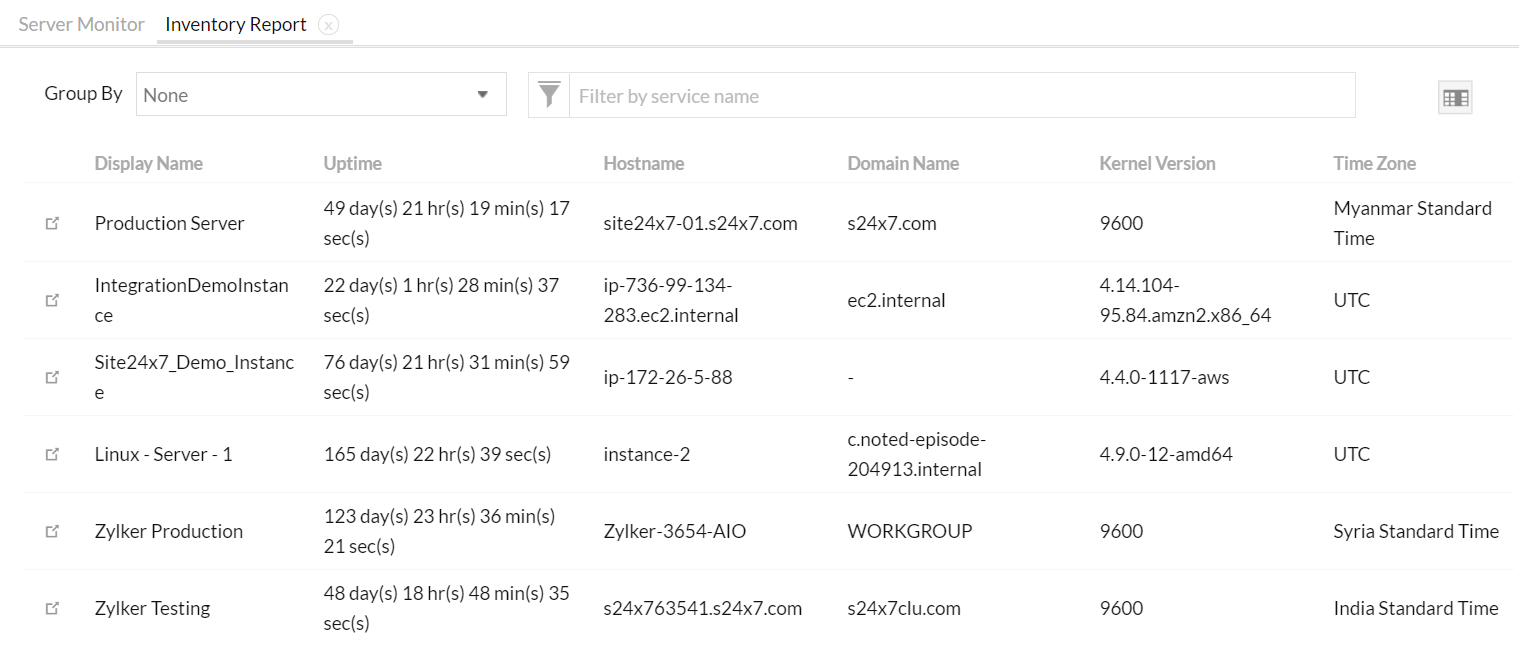
Inventory Report
View servers based on display name, hostname, agent version, OS type, uptime, poll interval, and other server inventory details. Use the Filter bar at the top right corner to filter and view servers based on your requirement.
Performance and availability summary reports for child resources
View the performance report and availability summary of your server's child resources i.e., disks, network interfaces, and processes of any monitored server. In the Availability Summary Report, you can view the outage count, outage duration, scheduled maintenance duration, suspended duration, and much more. In the Performance Report for child resources, you can view the performance metrics of the selected child resources in a specific server.
Server Restart Report
The Server Restart Report lets you track the frequency of your server restarts, which can be indicative of critical events such as outages. This, in turn, enables you to identify potential issues and take necessary actions promptly, minimizing downtime and improving overall server performance.
Servers by Pending Reboot for Windows Update
Efficiently manage pending reboots associated with your Windows server by using the Servers by Pending Reboot Report. This report lets you view the pending reboots for your Windows server. By scheduling these reboots for these critical updates deliberately, you can ensure your server's health, performance and stability. This also helps in maintaining the optimal functioning of your Windows environment.
Servers by Pending Windows Updates
With this report, you can see the list of Windows servers, VMs, and hosts that have any Windows updates waiting to be applied. This helps you in your patch management strategy and identify the list of vulnerable servers.
Performance Report
With this report, you can view the key performance indicators of all the monitored servers in one place. For a selected timeframe, you can view the availability, disk usage, memory utilization, and CPU utilization of all or selected servers, VMs, and hosts.
Forecast Report
The Forecaste Report shows the machine-learning-based predicted utilization values of your selected or all server, VM, and host monitors. The predicted metrics that can be viewed in this report are:
- Used disk partition space (in %)
- Overall disk usage (in % and bytes)
- Memory utilization
- CPU usage
- Overall disk free space
Server Monitors by CPU Utility %
The CPU Utilization % Report provides a detailed overview of processor usage across your monitored servers. This report helps you identify servers with consistently high or low CPU consumption, analyze performance trends over time, and detect potential bottlenecks affecting application performance.
Key insights:
- View CPU usage (%) per server, across a selected time period.
- Identify servers under persistent load or showing unusual spikes.
- Optimize resource allocation and plan capacity upgrades.
- Detect workloads that may require load balancing or process tuning.
Related Articles
-
On this page
- Server Disk Partition Report
- Server Network Adapter Report
- Agent Inventory Report
- Services and Processes Reports
- User-wise Resource Consumption
- Server Top Process report
- Top N Bottom N Reports
- Monitor Status Report
- Inventory Report
- Performance and availability summary reports for child resources
- Server Restart Report
- Servers by Pending Reboot for Windows Update
- Servers by Pending Windows Updates
- Performance Report
- Forecast Report
- Utility percentage
- Related Articles
