Global Benchmark Report
Global Benchmark Report lets you quickly analyze and benchmark individual Websites, REST APIs or REST API Transaction monitors in your account. You can compare the Availability or Response time trends of your Website, REST API or REST API Transaction monitors individually or benchmark monitor groups (containing Websites, REST APIs, and REST API Transaction monitor types) from multiple global locations during a specified time interval. You can compare the trend among 25 monitors or 25 monitor groups from a maximum of 8 monitoring locations. You can use this report to measure your various endpoints' availability or response time trends with metric aggregation of average or 95th percentile data and share it with your colleagues for your various business needs. It lets you quickly compile an ad-hoc report that can be used for analysis and troubleshooting. You can also export the global benchmark report to PDF or share it via an email. Once created, you can view and delete all your Global Benchmark Reports as per your need. Data presented in a graphical and tabular split view gives you clear insight to undertake instant availability and performance troubleshooting.
- Generate Global Benchmark Report
- Use case
- View Global Benchmark Report
- Interpret Global Benchmark Report
- Related Reading
Generate Global Benchmark Report
- Log in to Site24x7 control panel.
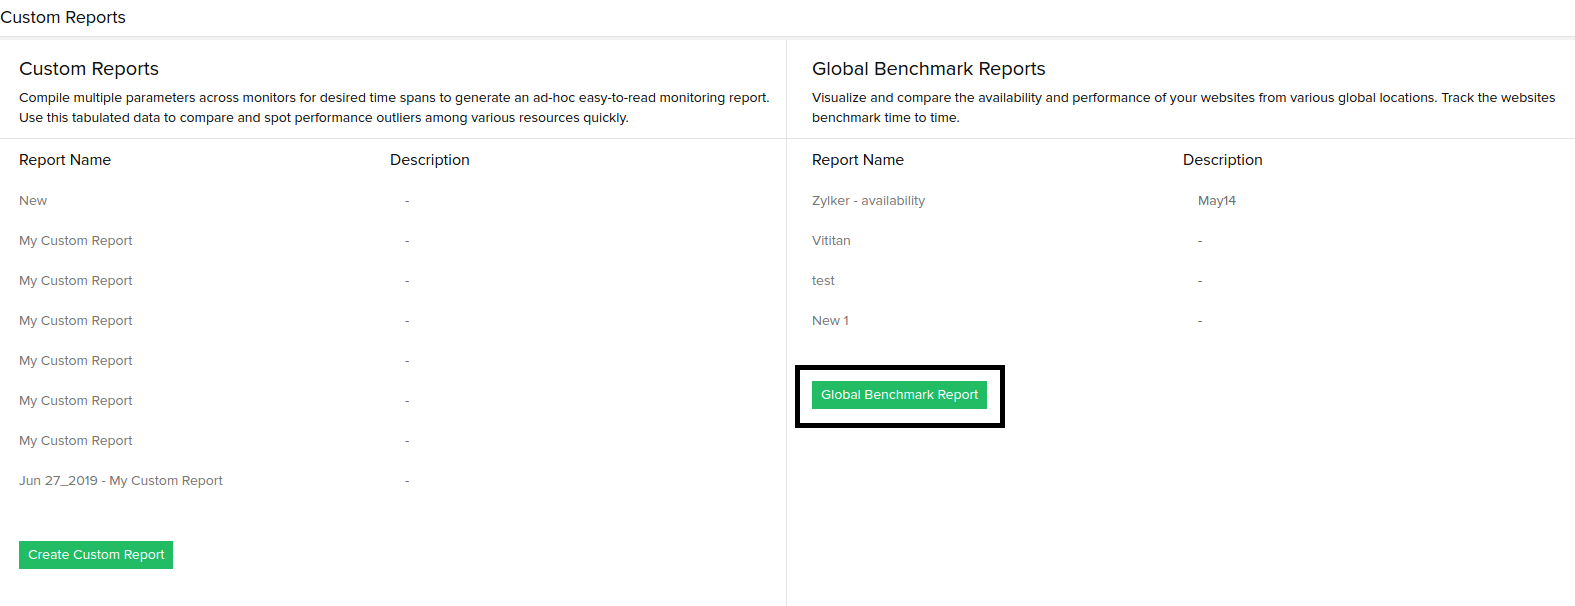
- Navigate to Reports > Custom Reports.
- Click the Global Benchmark Report button.

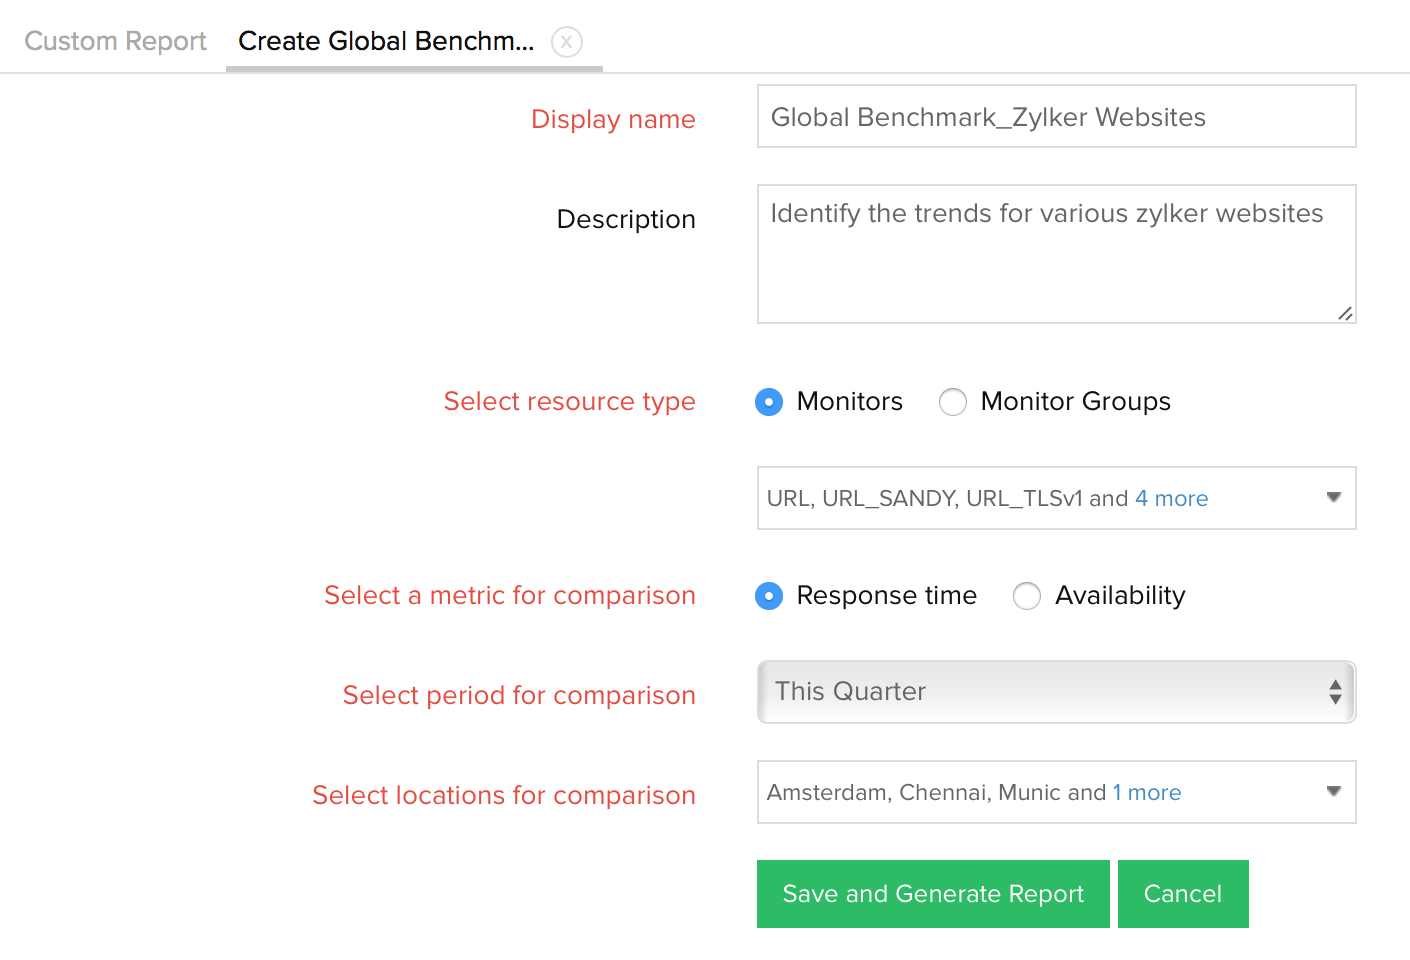
- Provide the relevant details to generate your benchmark report:
- Display name: Provide a name for the report.
- Description: Add a brief description to your Global Benchmark report. This will be useful to quickly identify the context of the report while sharing it with other users.
- Select resource type: Click the radio button to choose monitors or monitor groups during trend analysis. You can pick upto 25 monitors or monitor groups that are configured in your account.
- Monitors: You can select a set of website monitors/ REST APIs/ REST API Transaction monitors configured in your account to execute a quick benchmarking.
- Monitor Groups: Pick a specific set of monitor groups consisting only of Website monitors, REST APIs, or REST API Transaction monitors.
- Include Subgroups: Enable this option to include subgroups of the selected Monitor Groups. Otherwise, only the selected Group will be considered.
- Select a metric for comparison: Pick the metric that you wish to compare. You can either compare the Availability or Response Time Trends for the selected monitors or monitor groups.
- Select period for comparison: You can pick specific time periods to execute the Global Benchmarking.
- Select locations for comparison: Pick upto eight monitoring locations from your configured locations to execute the benchmarking.
- Once all the parameters are specified, click the Save and Generate Report button to create the Global Benchmark Report. Press Cancel to reset the configuration.
Use case
For example, an e-commerce business with a global customer base can use this report to compare the website's availability and response time across different regions, ensuring that customers in all locations experience consistent and reliable performance, which is critical for maintaining customer satisfaction and maximizing sales.
View Global Benchmark Report
All saved custom reports and Global Benchmark Reports can be viewed under the "Saved Views" screen. You can additionally edit or delete an existing report by accessing the reports shown here. Super Admin, Admin, and Operator roles can create, view, and delete Global Benchmark Reports. Operators can create, update, and delete Global Benchmark Reports created by themselves. Operators do not have sufficient privilege to edit/delete report created by other user roles.

Interpret Global Benchmark Report
The Global Benchmark Report illustrates and renders the compared data in a tabular format. Based on the metric selected, i.e., Availability or Response Time, you'll be able to view the trend in a graphical and tabular layout. Availability data will be captured in terms of Availability percentage, whereas the Response Time data will be captured in milliseconds. Both these metrics can be based on the aggregated Average or 95th percentile values. If you wish to share the report with a peer or customer, you can always generate a PDF of the report and share it with them. You can click the Share This button to successfully export the report in PDF format or share it via email. To Edit or Delete the report altogether, just click the Gear icon listed on the top right corner and select the Edit/Delete option. Benchmarking of Monitors can be done for the selected time period. However, for monitor groups, the data can be fetched and used only from July, 2017.
The following time periods can be selected as part of your Global Benchmark Report generation. They are:
- Yesterday
- This week (Sunday - Today)
- This Month
- This Quarter
- This Year
- Last Week (Sunday - Saturday)
- Last Month
- Last Quarter
- Last Year
- Last 7 days
- Last 30 days
- Last 12 Hours
- Last 6 Months
- Custom Period (specify date range)
Global Benchmark by Availability (%)
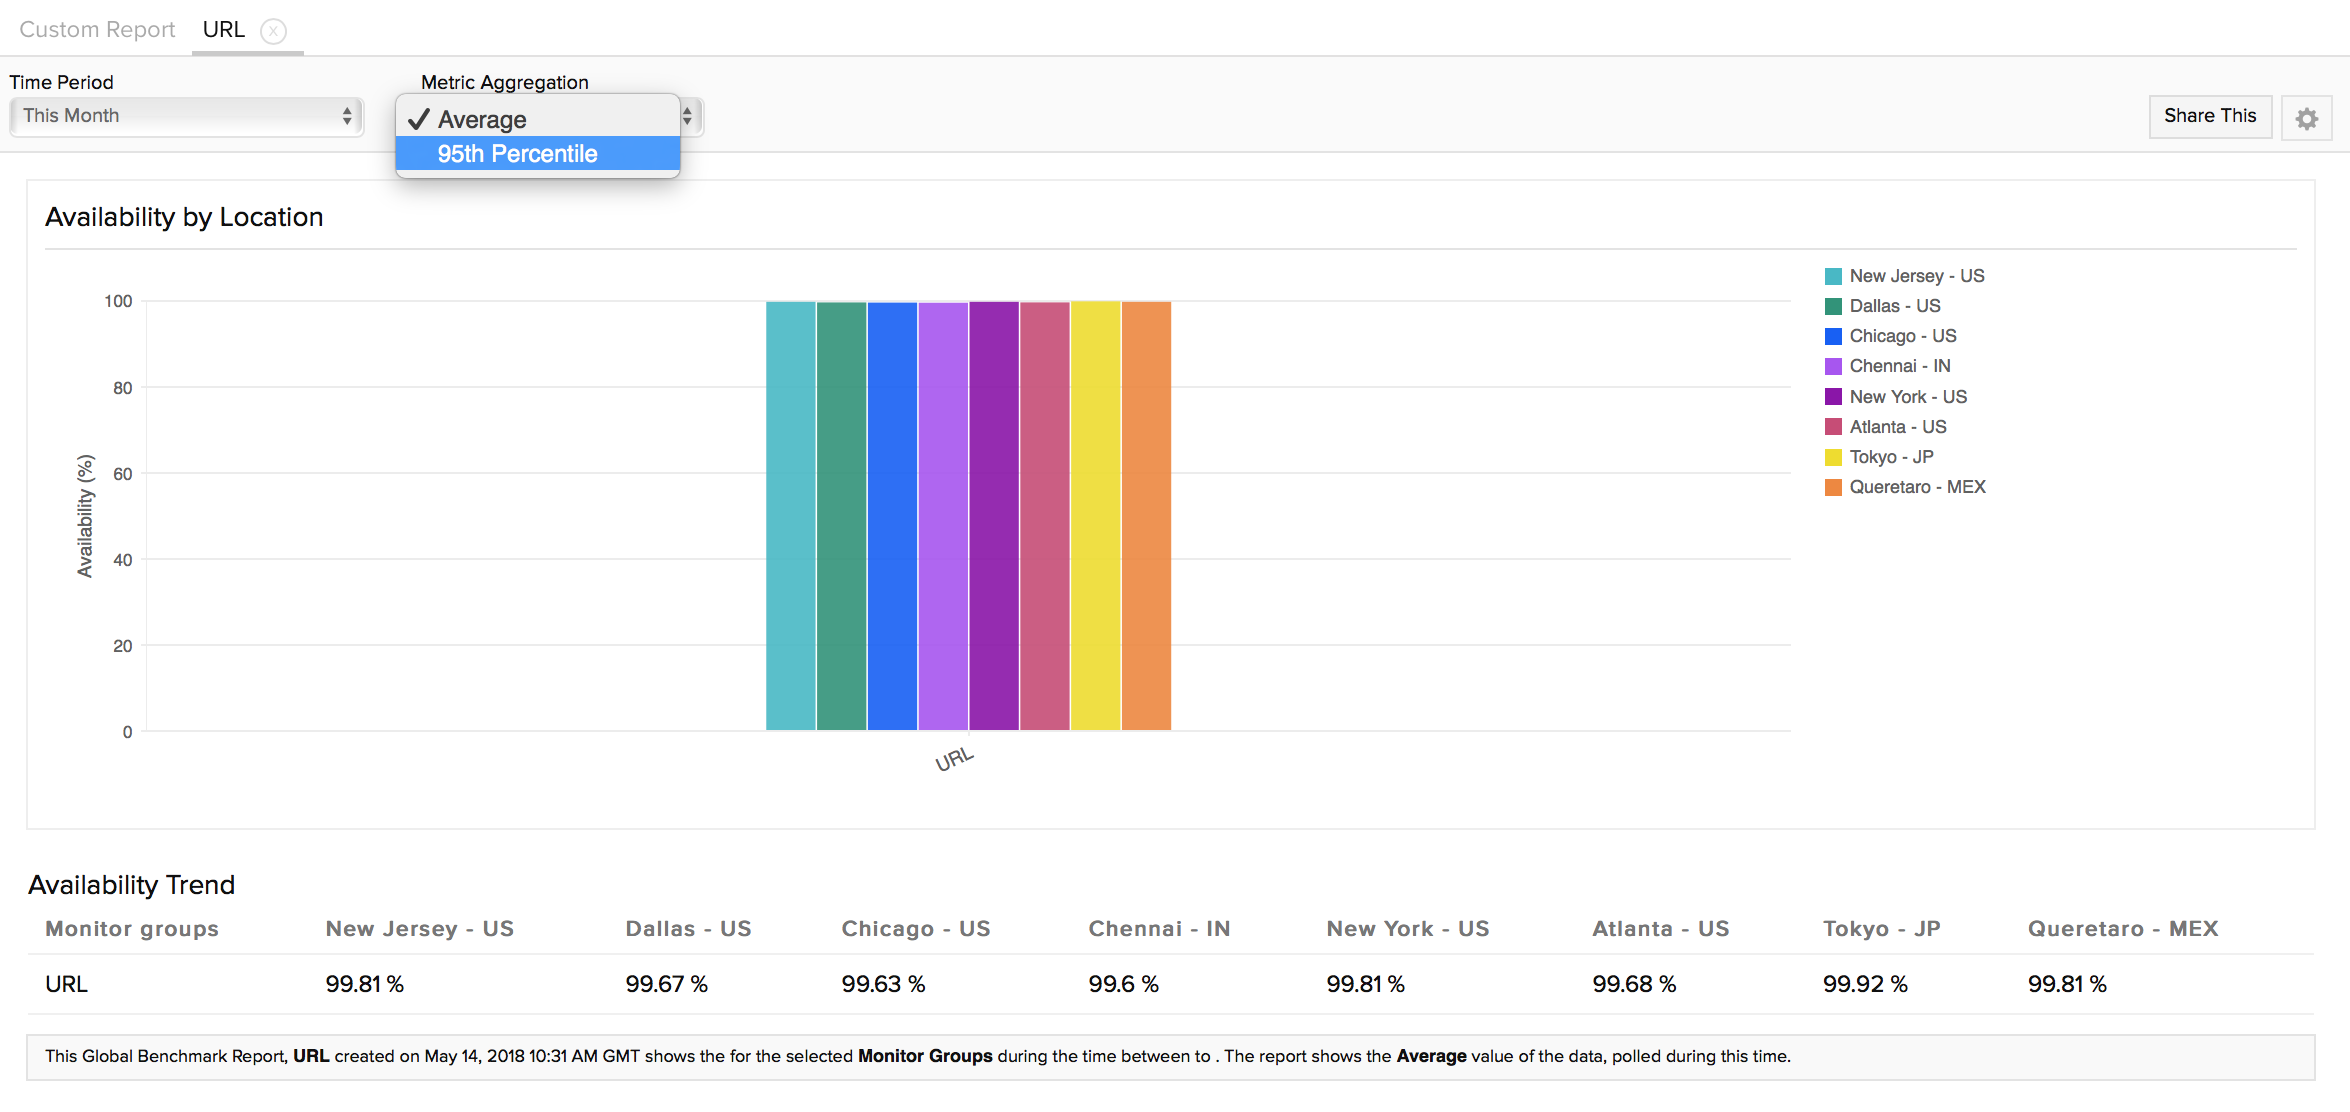
This view lets you clearly compare and comprehend the availability trend (in percentage) of your various monitors or monitor groups from the locations that you've selected. You can pick relevant time periods from the Time Period drop down and choose a metric aggregation of Average or 95th percentile value of the availability data to perform the trend analysis. Metric aggregators can be chosen for Monitor Groups alone. If you've selected Monitors, the data will portray average value by default. There are two separate views available to you:
- Availability by location
- Availability trend
In the graph view, locations act as legends, which can be used to filter out certain locations from the graph view. Hovering over the graph gives you the actual availability percentage of individual Websites/ REST APIs/ REST API Transaction monitors or your configured groups from a specific location during the selected period. The trend table offers the same data in a tabular form.
While Benchmarking the availability trends of monitor groups, data from Website/ REST APIs, and REST API Transaction monitors are grouped together for determining the metric aggregate value. Learn about any unique cases here.

Global Benchmark by Response Time (ms)
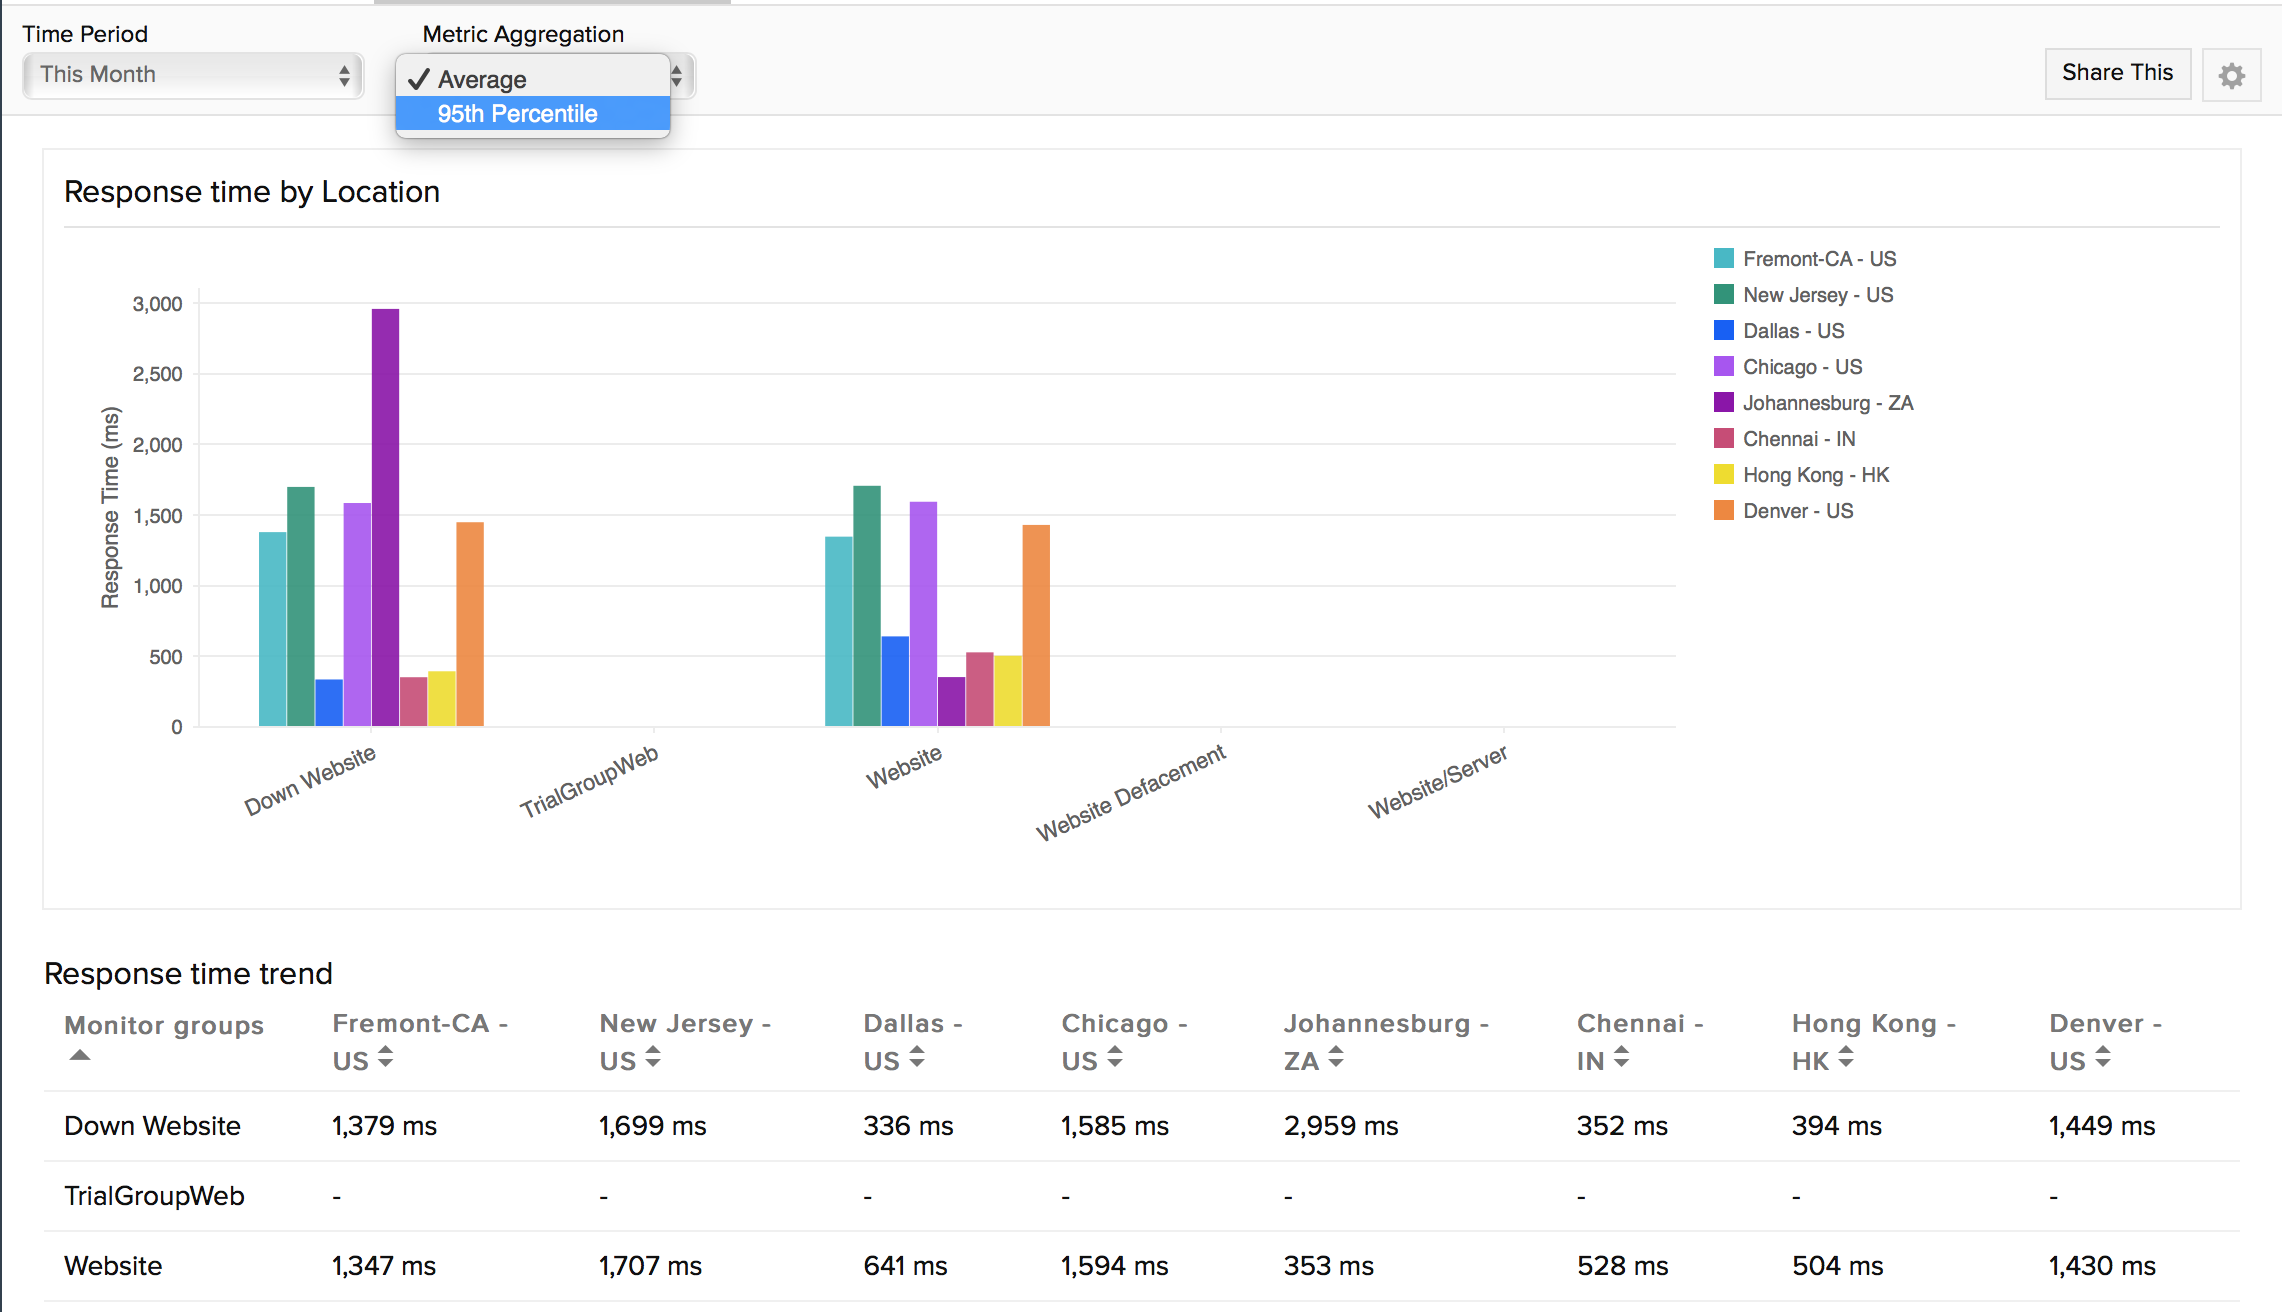
You will be able to clearly compare and comprehend the response time metric (in milliseconds) of your various Websites, REST APIs, or REST API Transaction monitors individually. You can also benchmark monitor groups, consisting of Websites/ REST APIs/ REST API Transaction monitors from the locations that you've selected. You can pick relevant time periods from the Time Period drop down to execute the response time trend analysis. There are two separate views available to you:
- Response time by location
- Response time trend
In the graph view, locations act as legends, which can be used to filter out certain locations from the graph view. Hovering over the graph gives you the actual response time (ms) of the website monitors/ REST APIs/ REST API Transaction monitors or groups from selected locations during the selected period. The trend table offers the same data in a tabular form.
While Benchmarking the reponse time trends of monitor groups, data from Website/ REST APIs, and REST API Transaction monitors are grouped together for determining the metric aggregate value. Learn about any unique cases here.
You can filter the report based on the Average response time metric or 95th percentile value for that specified time period.

