Topology Maps
Create a schema of your network topology and track live statuses using Site24x7's Topology Maps. These are custom network maps you can use to logically and hierarchically arrange your network devices and interfaces over a predefined or custom background to picture how your network looks and how it works. You're enabled to catch a quick glimpse of your entire network from a single console so you can promptly take corrective measures when needed.
Here is a video to demonstrate topology maps in Site24x7:
Use case
Consider a global organization named Zylker with offices located in multiple regions. Due to the scattered nature of the organization, more than 1,000 network devices must be monitored continuously to provide uninterrupted service to its customers and employees. To avoid the inconvenience of scrolling through a list of devices, network administrators can add the devices to a network map. This makes it easier to identify which devices are in trouble at a glance and understand which device might be impacted next.
Monitor groups in topology maps
A cluster of monitors can be organized into groups and displayed on a map, which enables you to track the devices based on specific categories according to your organizational policies. For example, if you have a group of monitors at a particular location and the status of the group indicates trouble, you can easily click on the monitor group to view a list of devices in that group and identify which device in which location requires attention.
Adding custom nodes in topology maps
Custom nodes are specific components for network administrators to manage their organization's devices and connections. These nodes can be used according to the organization's needs, enabling them to visualize the connections in a way that makes the most sense for their operations.
For example, to group monitors based on their location on a particular floor, you can create a custom node and give it a name. If you want to group the devices on the first floor, you can create a custom node named Floor 1. Next, connect all the devices located on that floor to the custom node named Floor 1. By doing so, you can efficiently organize and monitor the devices on each floor. You can use a custom node as you wish for better visualization.
The Topology Maps view
Here you can create and view network topology maps.
- Log in to your Site24x7 account.
- Navigate to Network > Topology Maps.
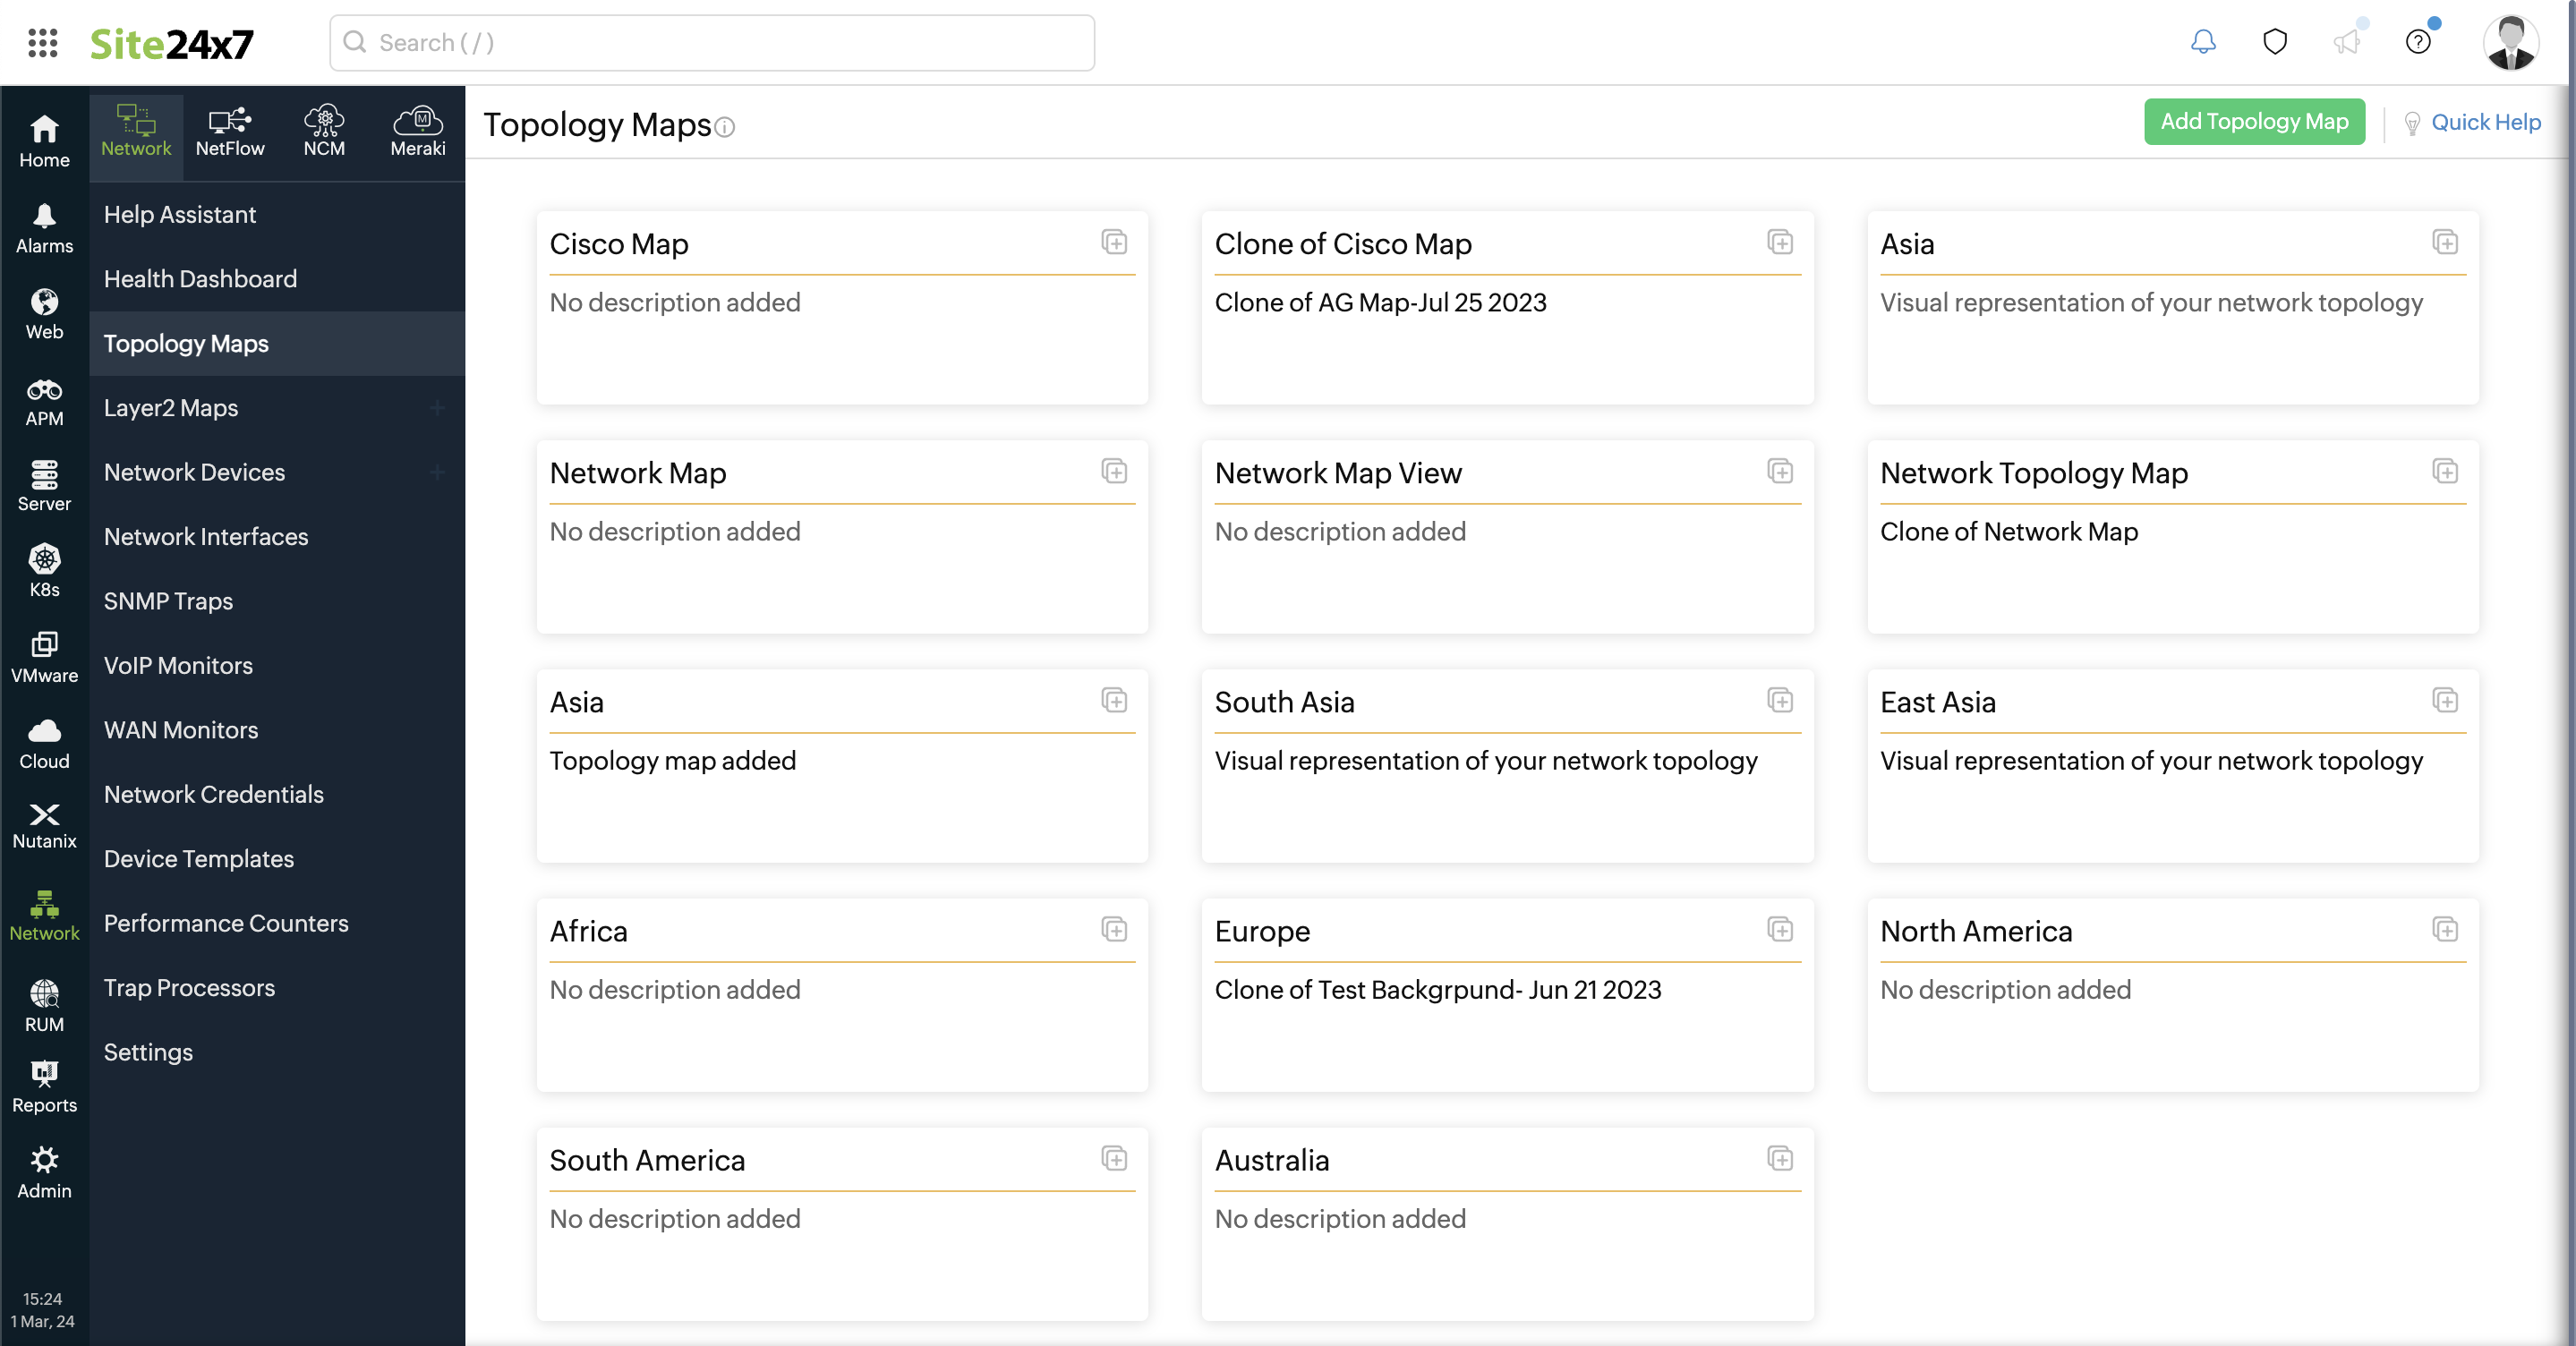
Figure 1. The Topology Maps view.
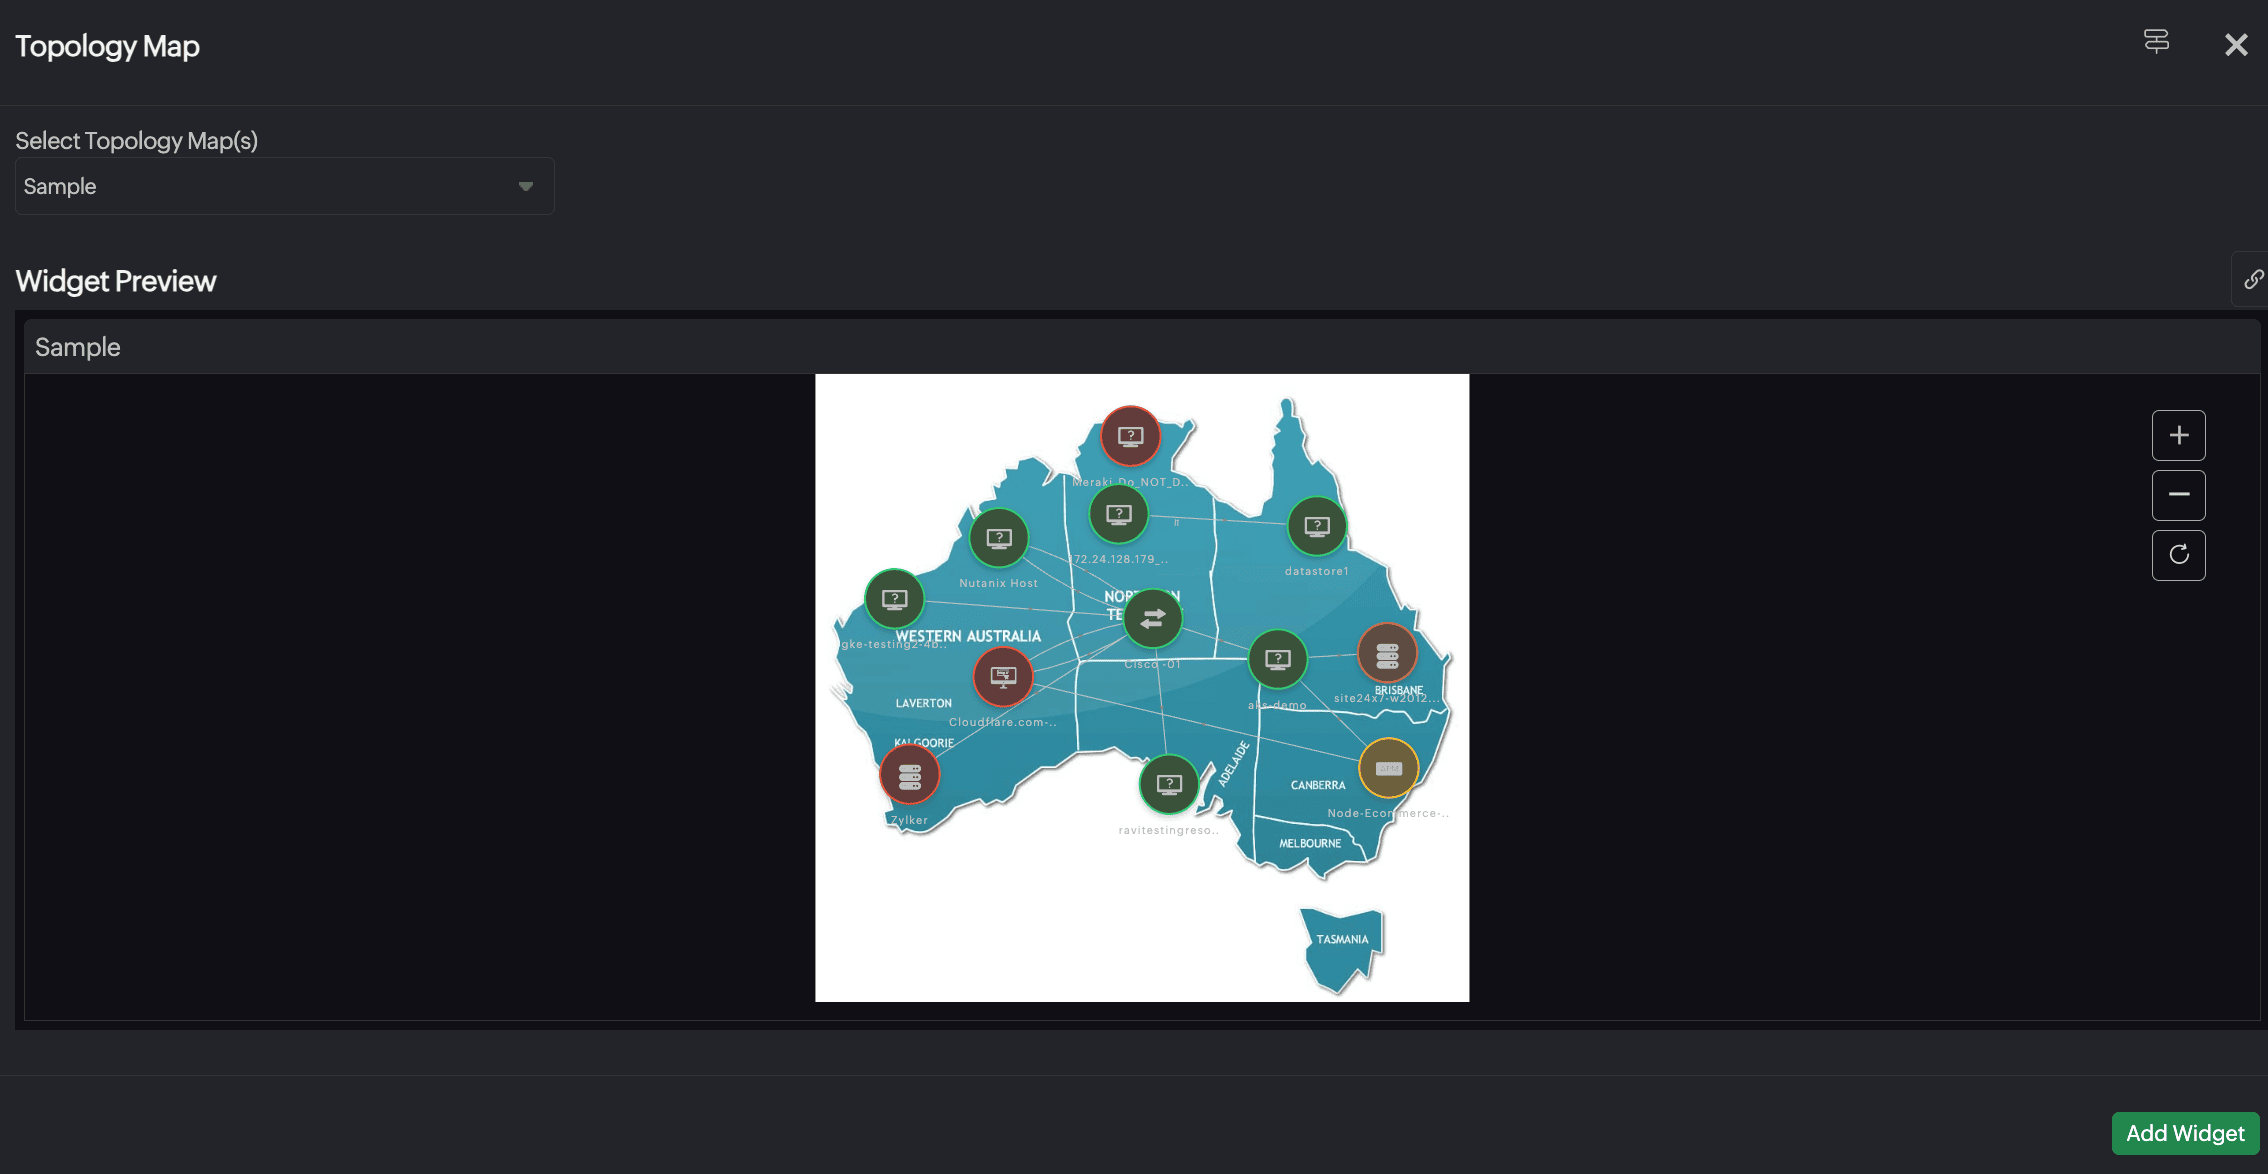
Figure 2. Marking an infrastructure map as a Network map.
Creating topology maps
- Navigate to Network > Topology Maps.
- Click Add Topology Map on the top-right of the screen to add a new map (Figure 1).
- This opens the Map Editor view. Site24x7 aggregates and shows all the configured network devices in your Site24x7 account on the left pane of the editor screen. You can also search for Monitors or Monitor Groups using the search bar and add them to the map as required (Figure 3, marked as 1).
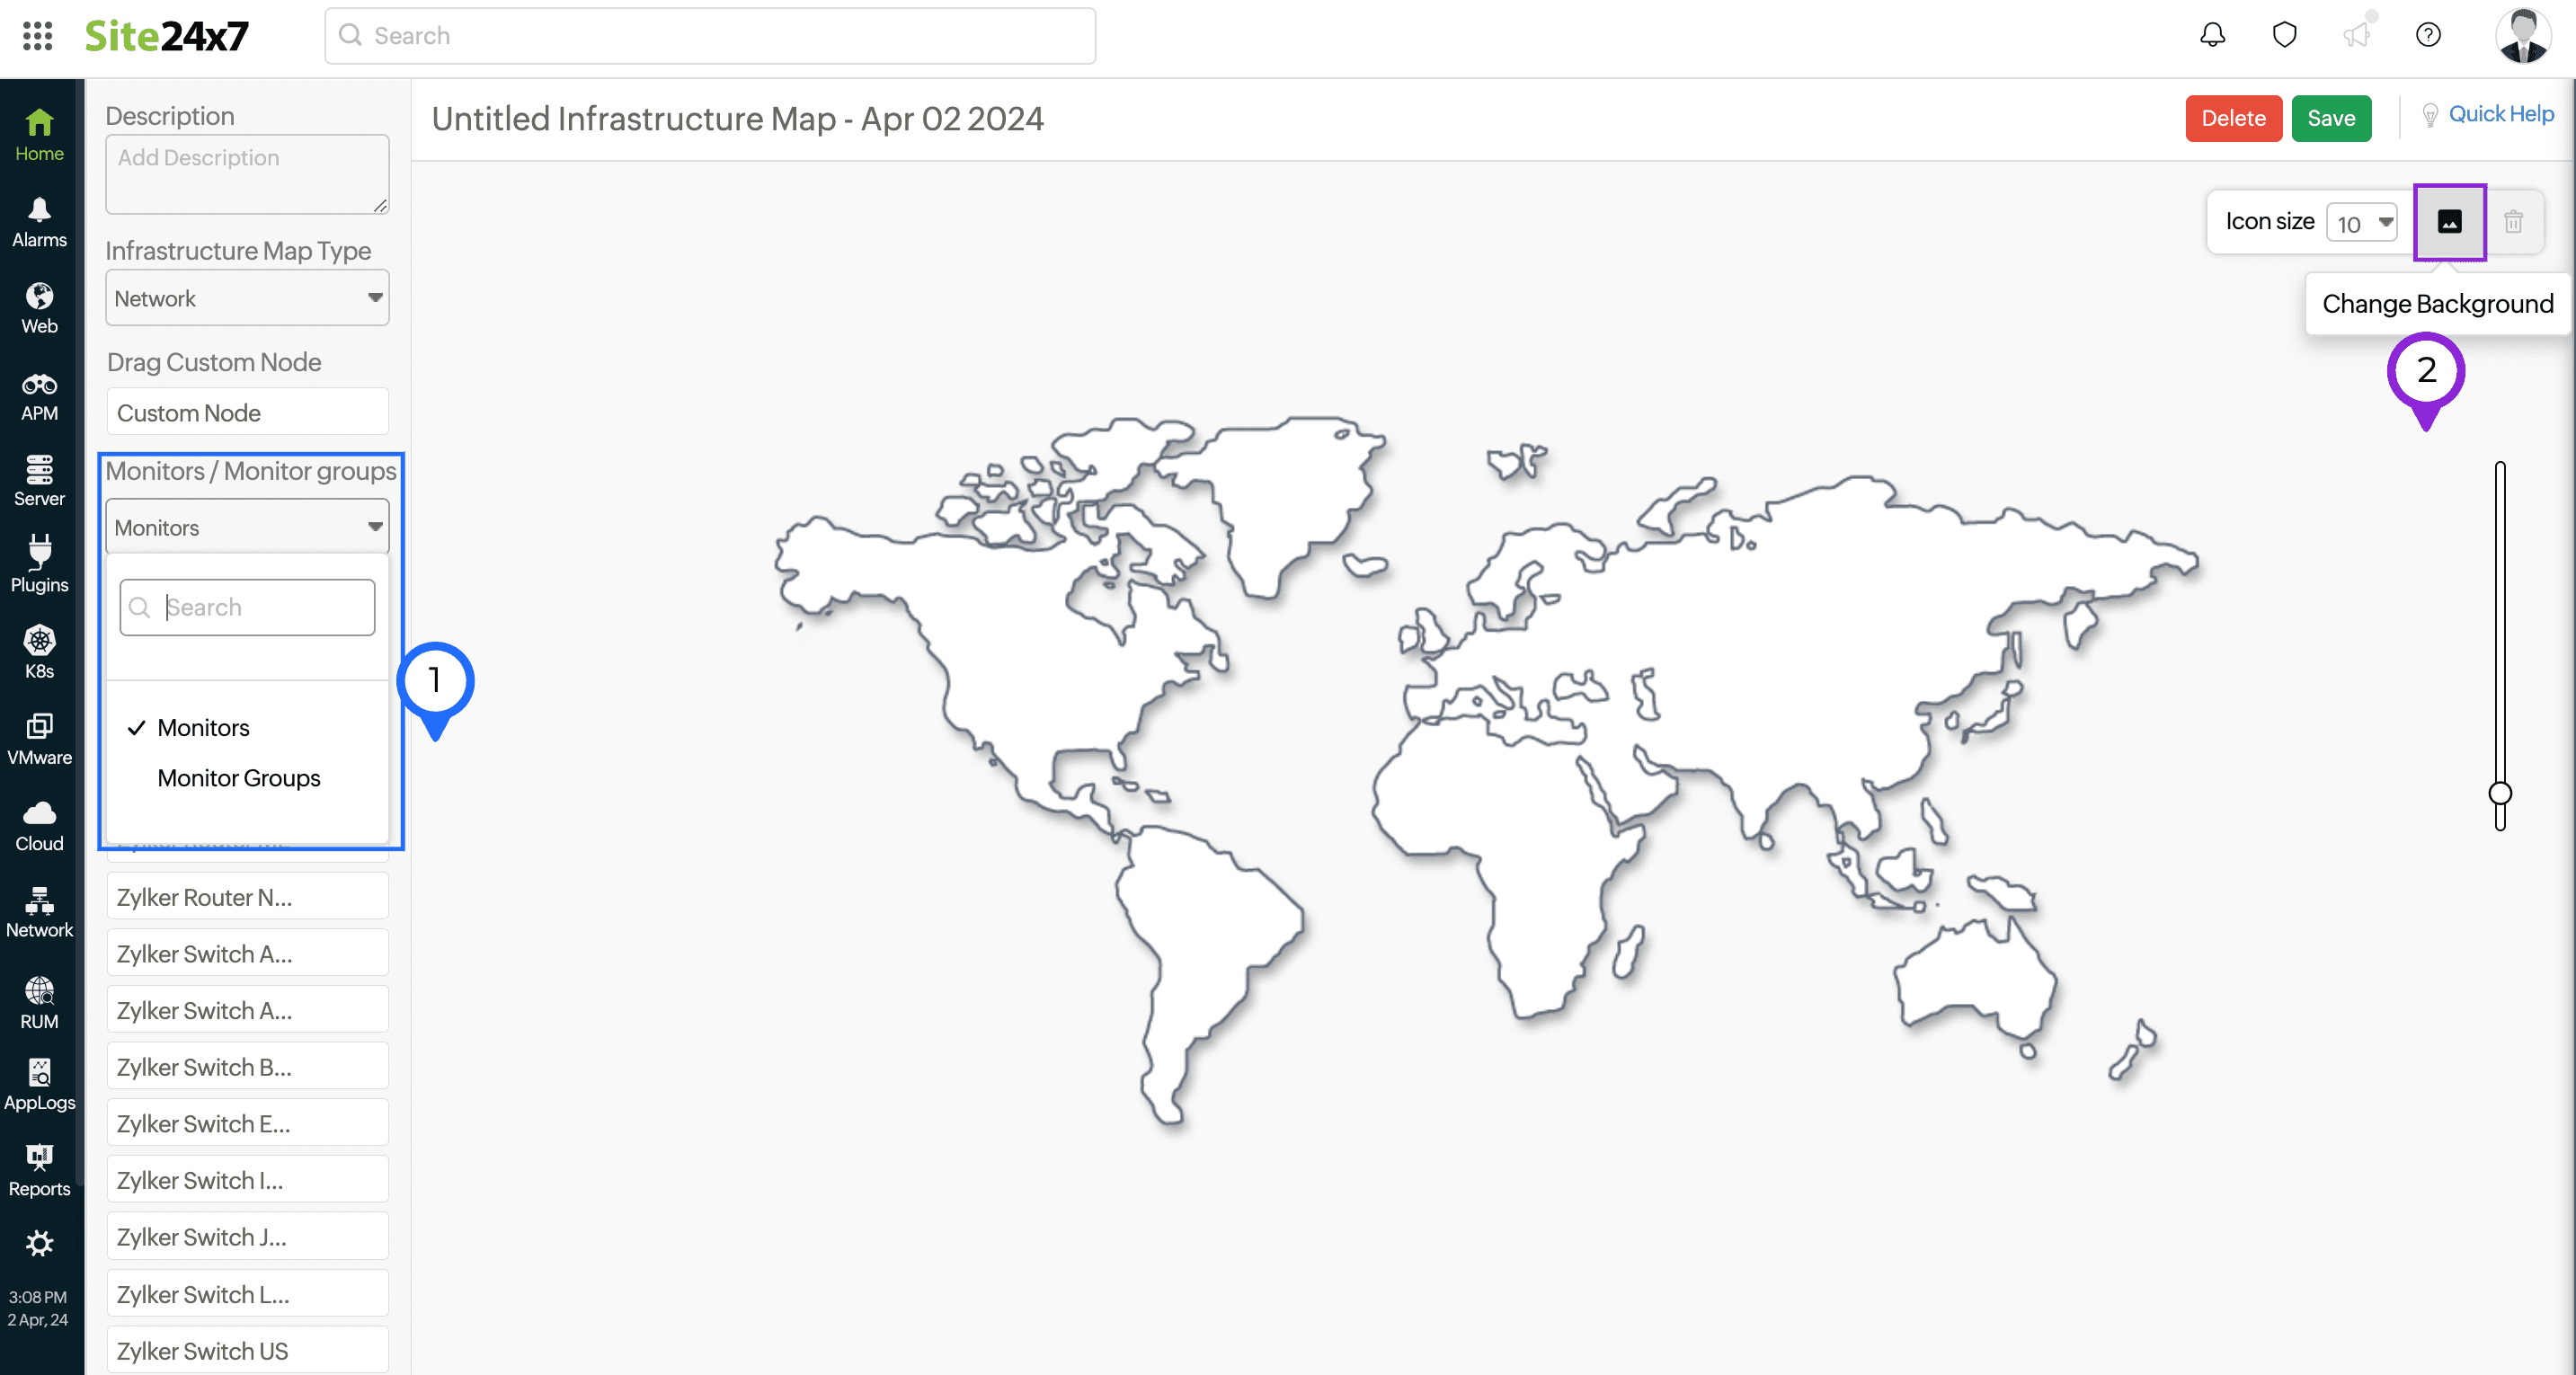
Figure 3. Selecting Monitors or Monitor Groups. - You can change the background by clicking Change Background
 icon (Figure 3, marked as 2). There are multiple background templates to choose from, such as World Maps, Continental Maps, Country Maps, and Grid lines. There is an additional option to import a custom background image by clicking Upload your image (Figure 4).
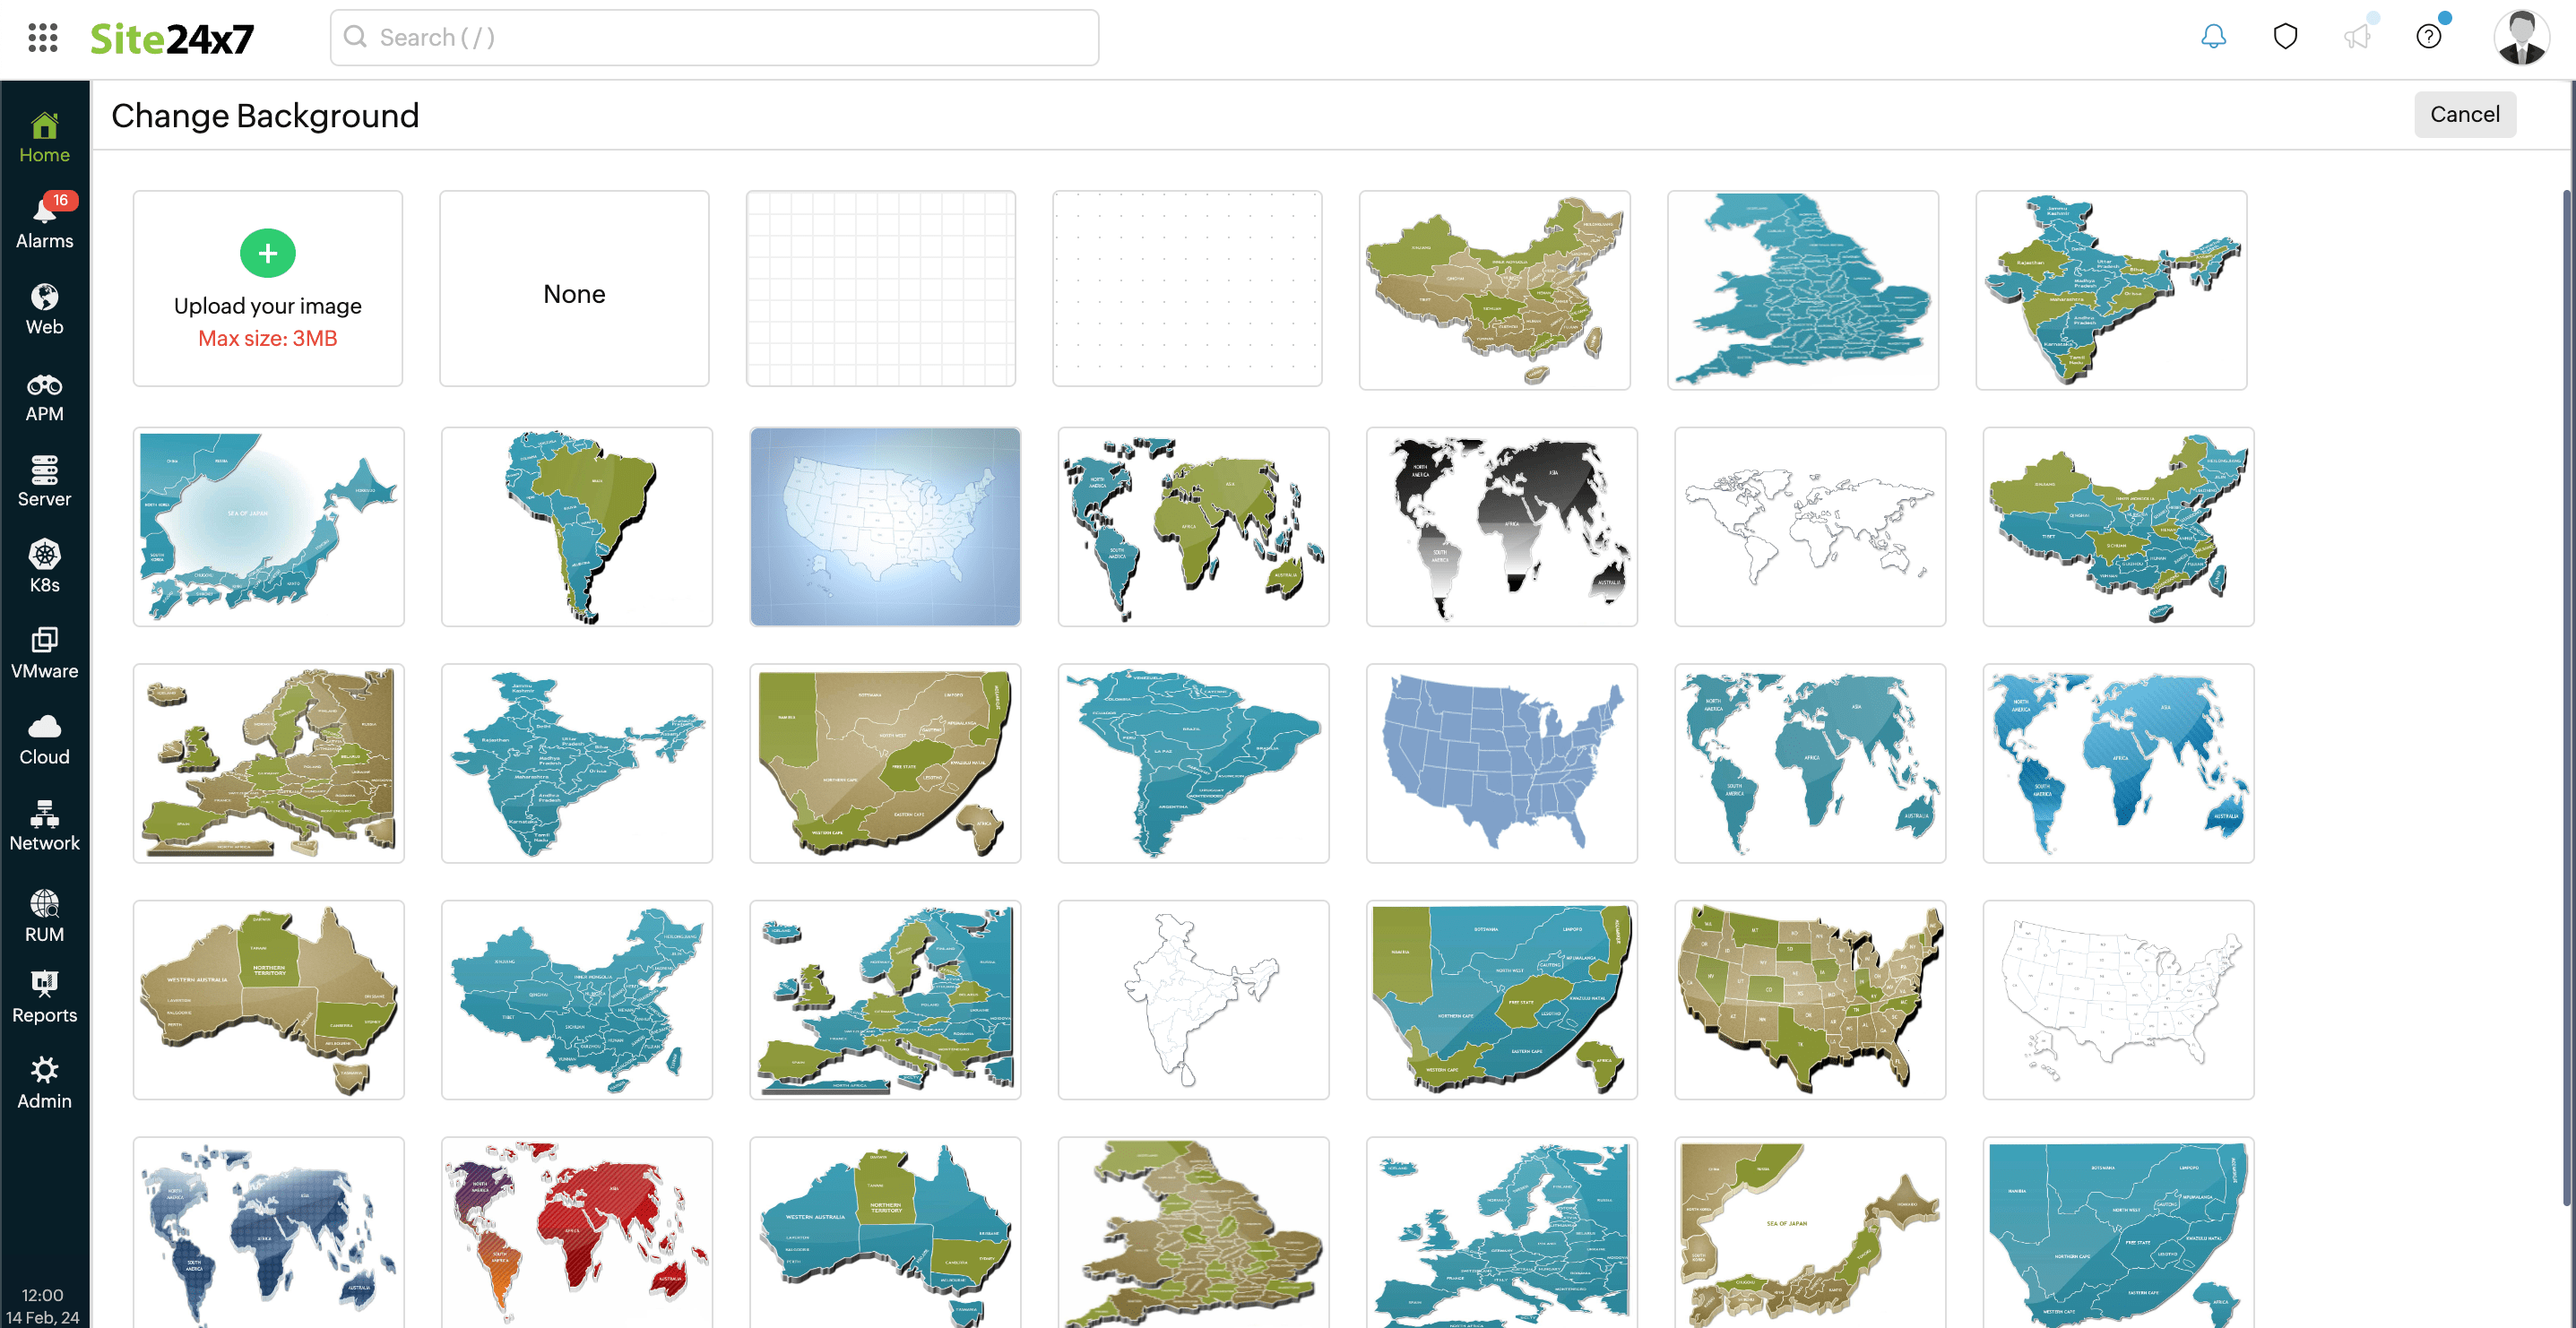
Figure 4. Changing the background image. - Once you've set your background image, drag and drop the selected network device from the left pane onto the canvas. You can resize your monitor icon by selecting the size from the drop-down list (Figure 5).
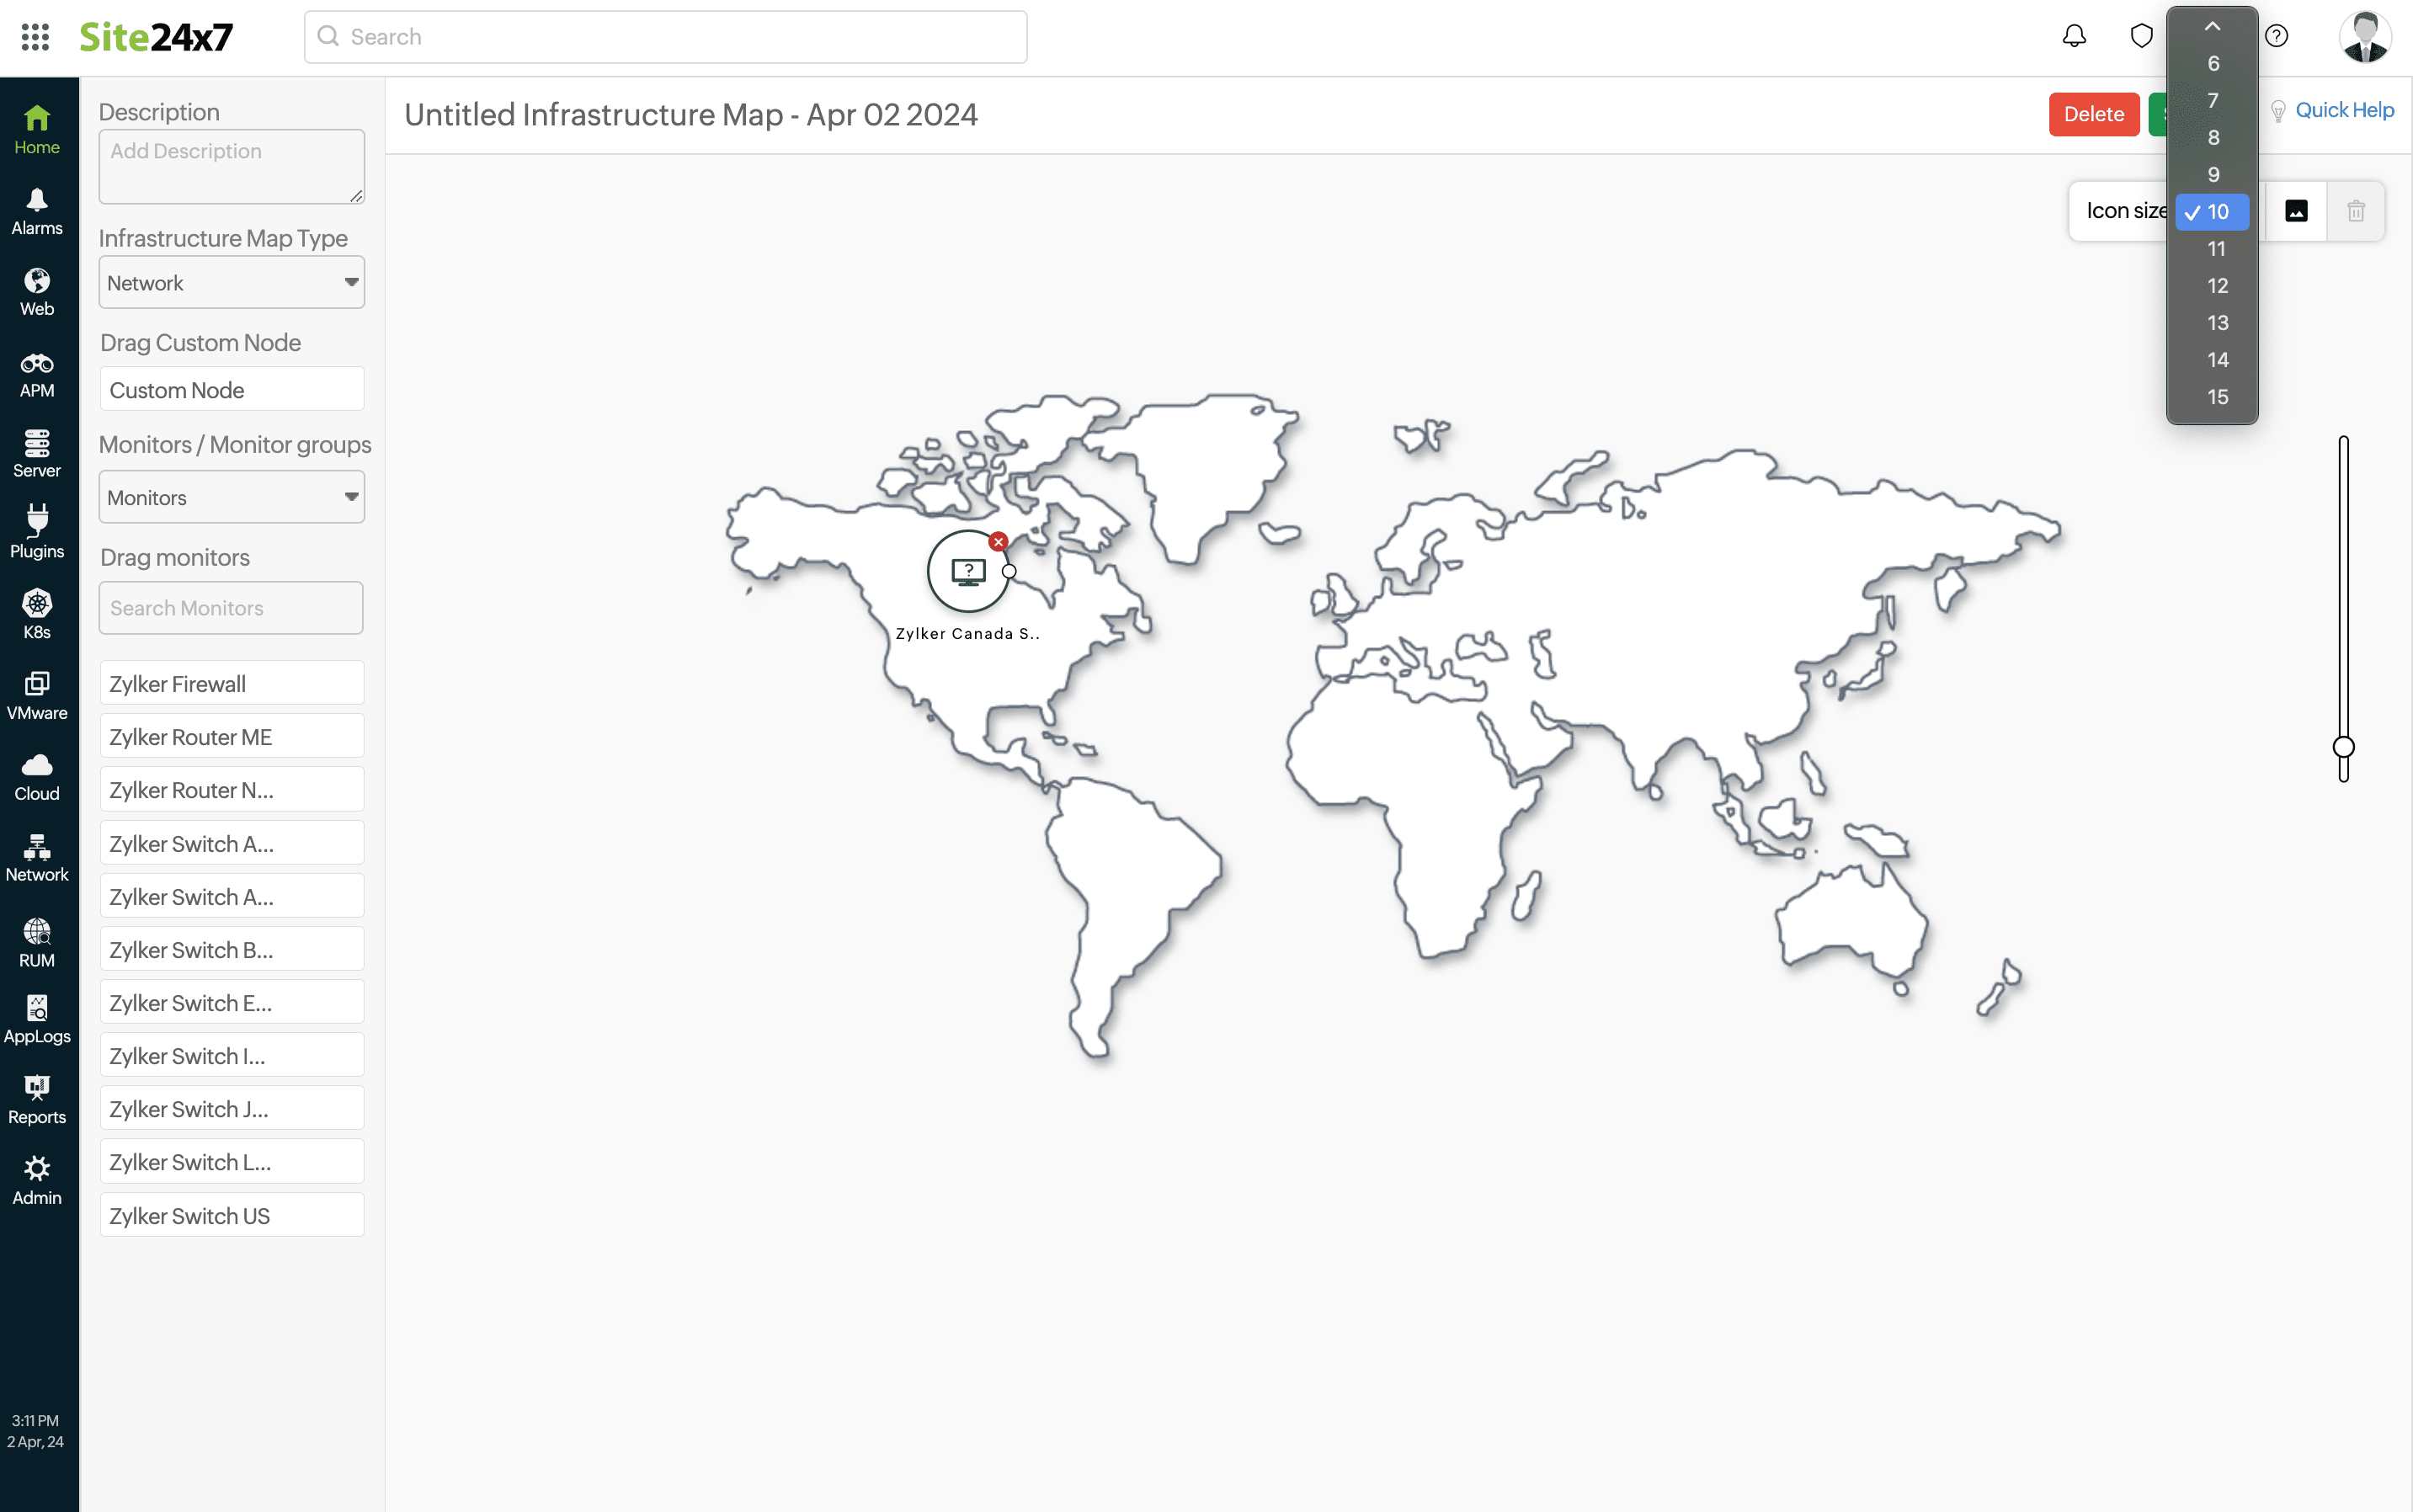
Figure 5. Adding devices to the map. - You can also add any custom device that is not monitored within Site24x7 for tracking purposes. For instance, you can drag a Custom Node from the left pane (Figure 6) and place it on the map. On doing so, the Add Custom Node pop-up opens where you can provide the Display Name field, select the type of device in the Icon field so that the appropriate icon will be displayed on the map, and provide a description for the custom node in the Description field. Then, click Save to add the device to the map.
Custom nodes are depicted by square-shaped icons while devices monitored in Site24x7 are depicted by circular icons.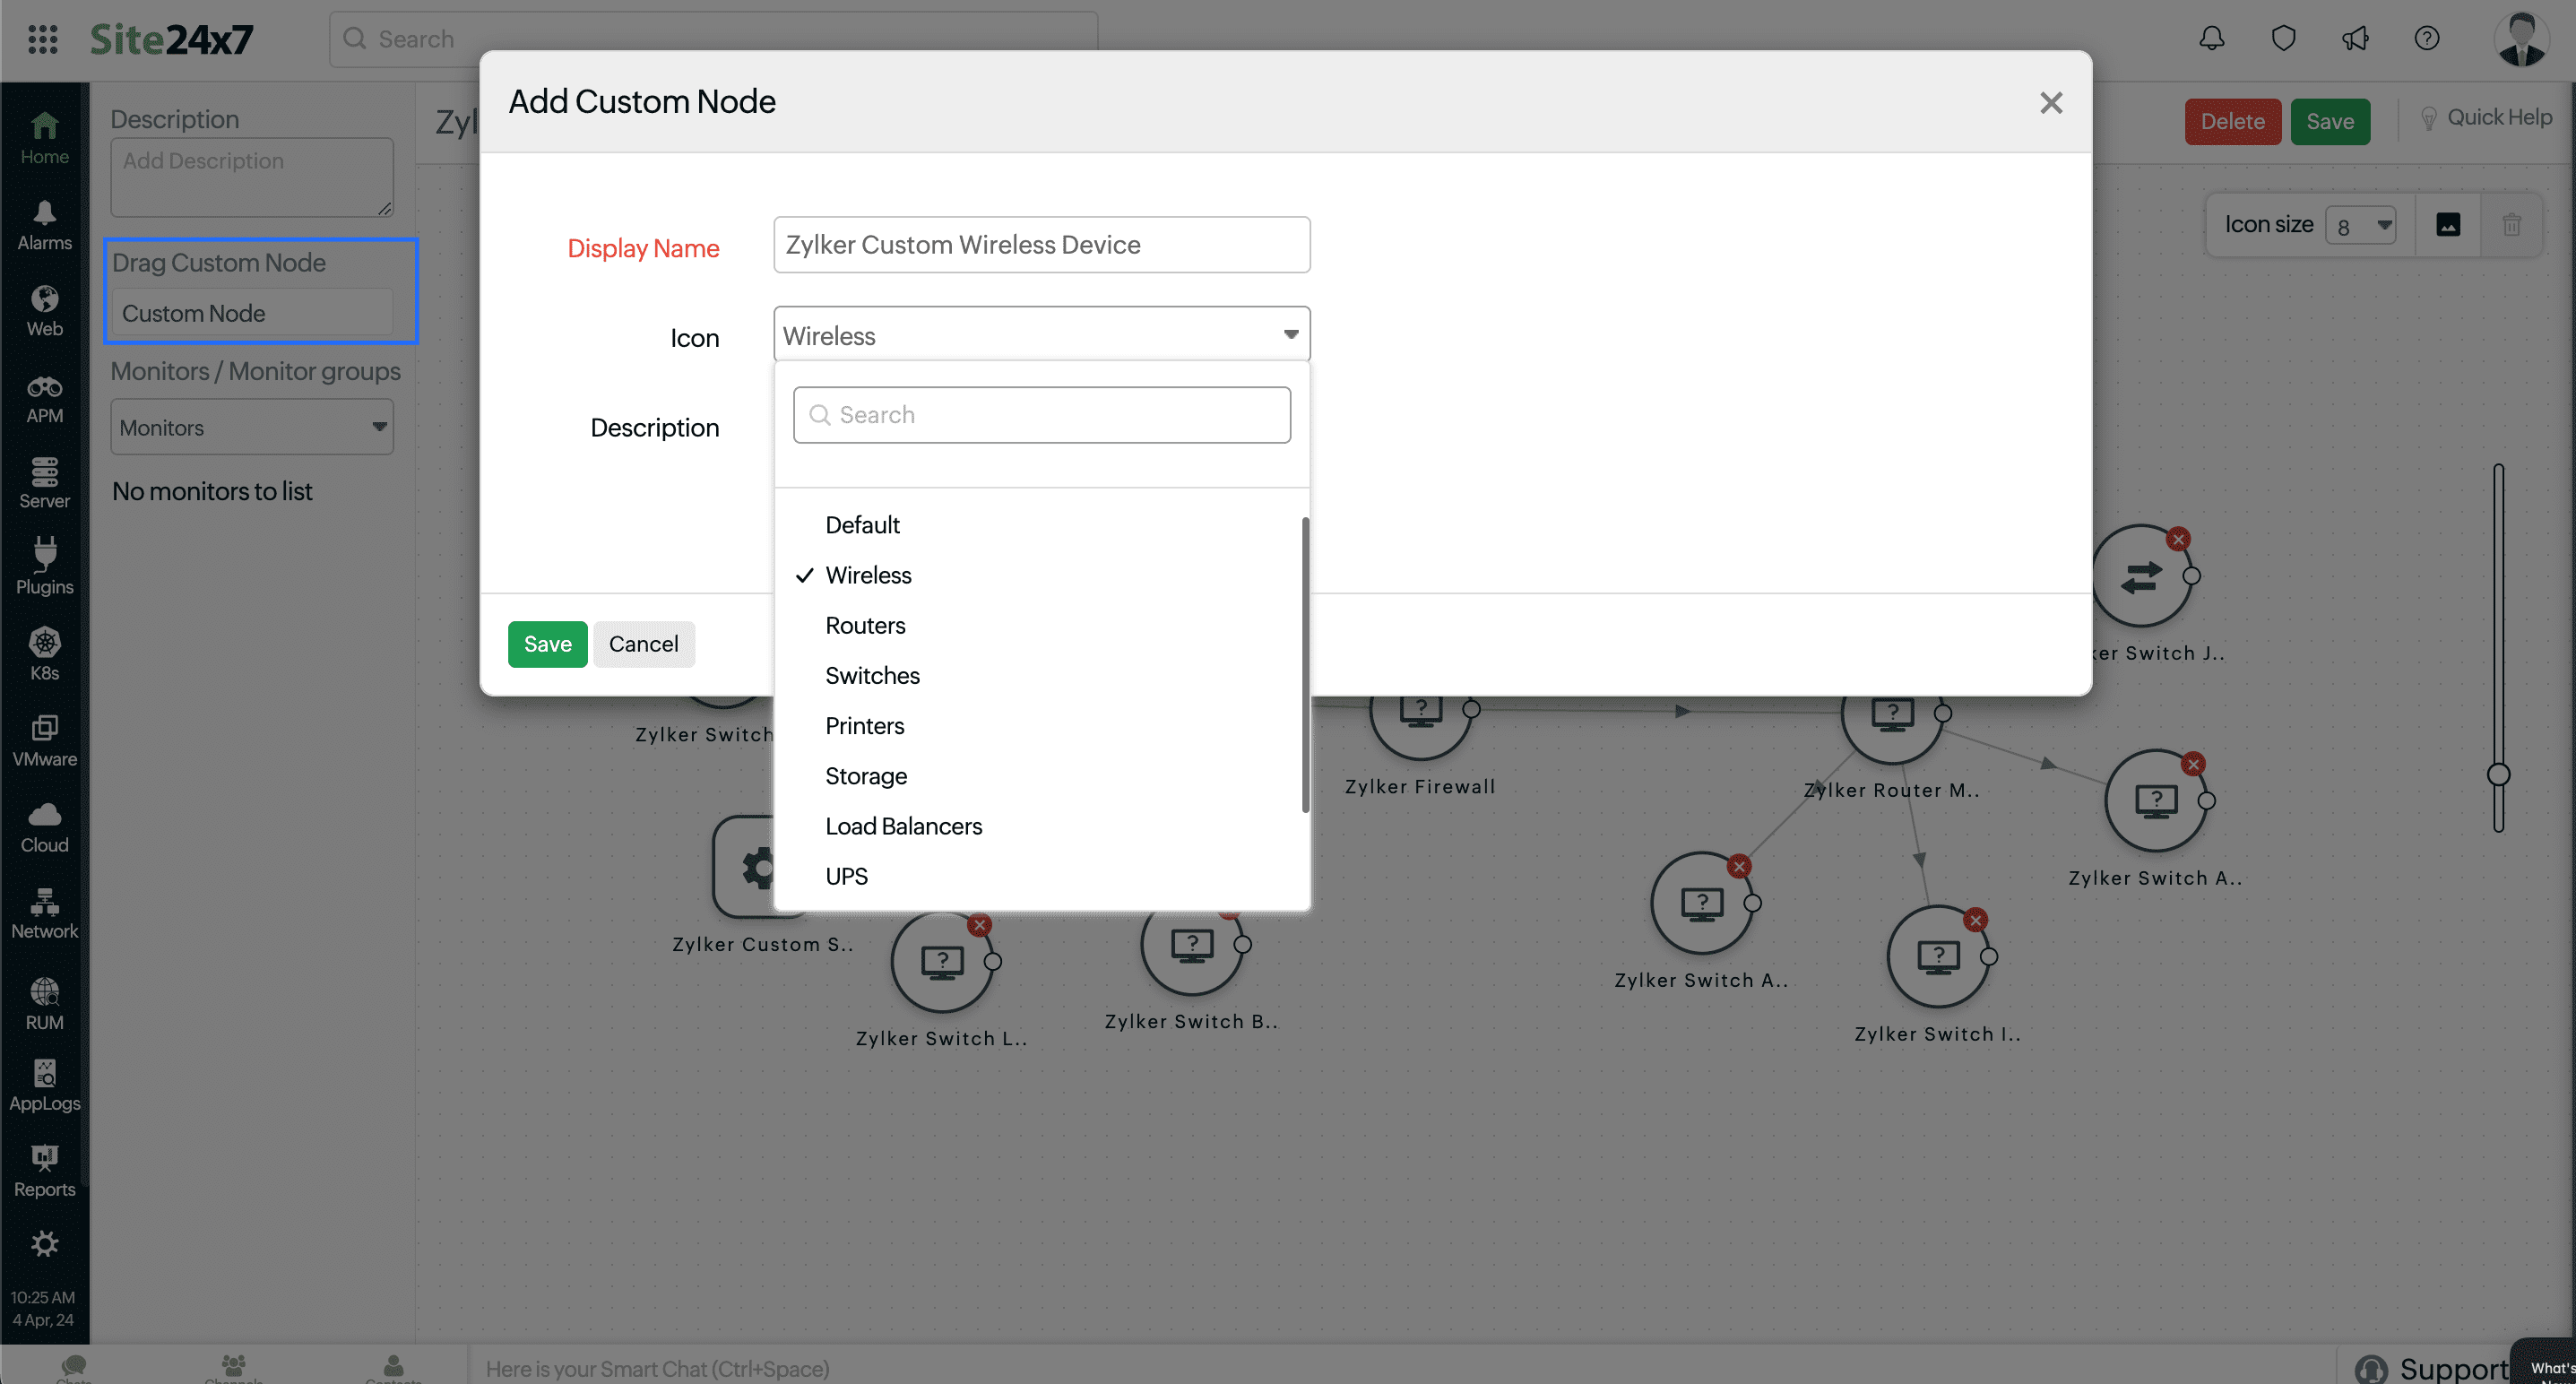
Figure 6. Adding a Custom Node.(See the blue bordered box in the grayed area). - You can select multiple nodes at once by holding control (Ctrl) on your keyboard and clicking the required devices. Once selected, you can drag the nodes as a set or delete them by clicking on the Delete button found in the top right corner.
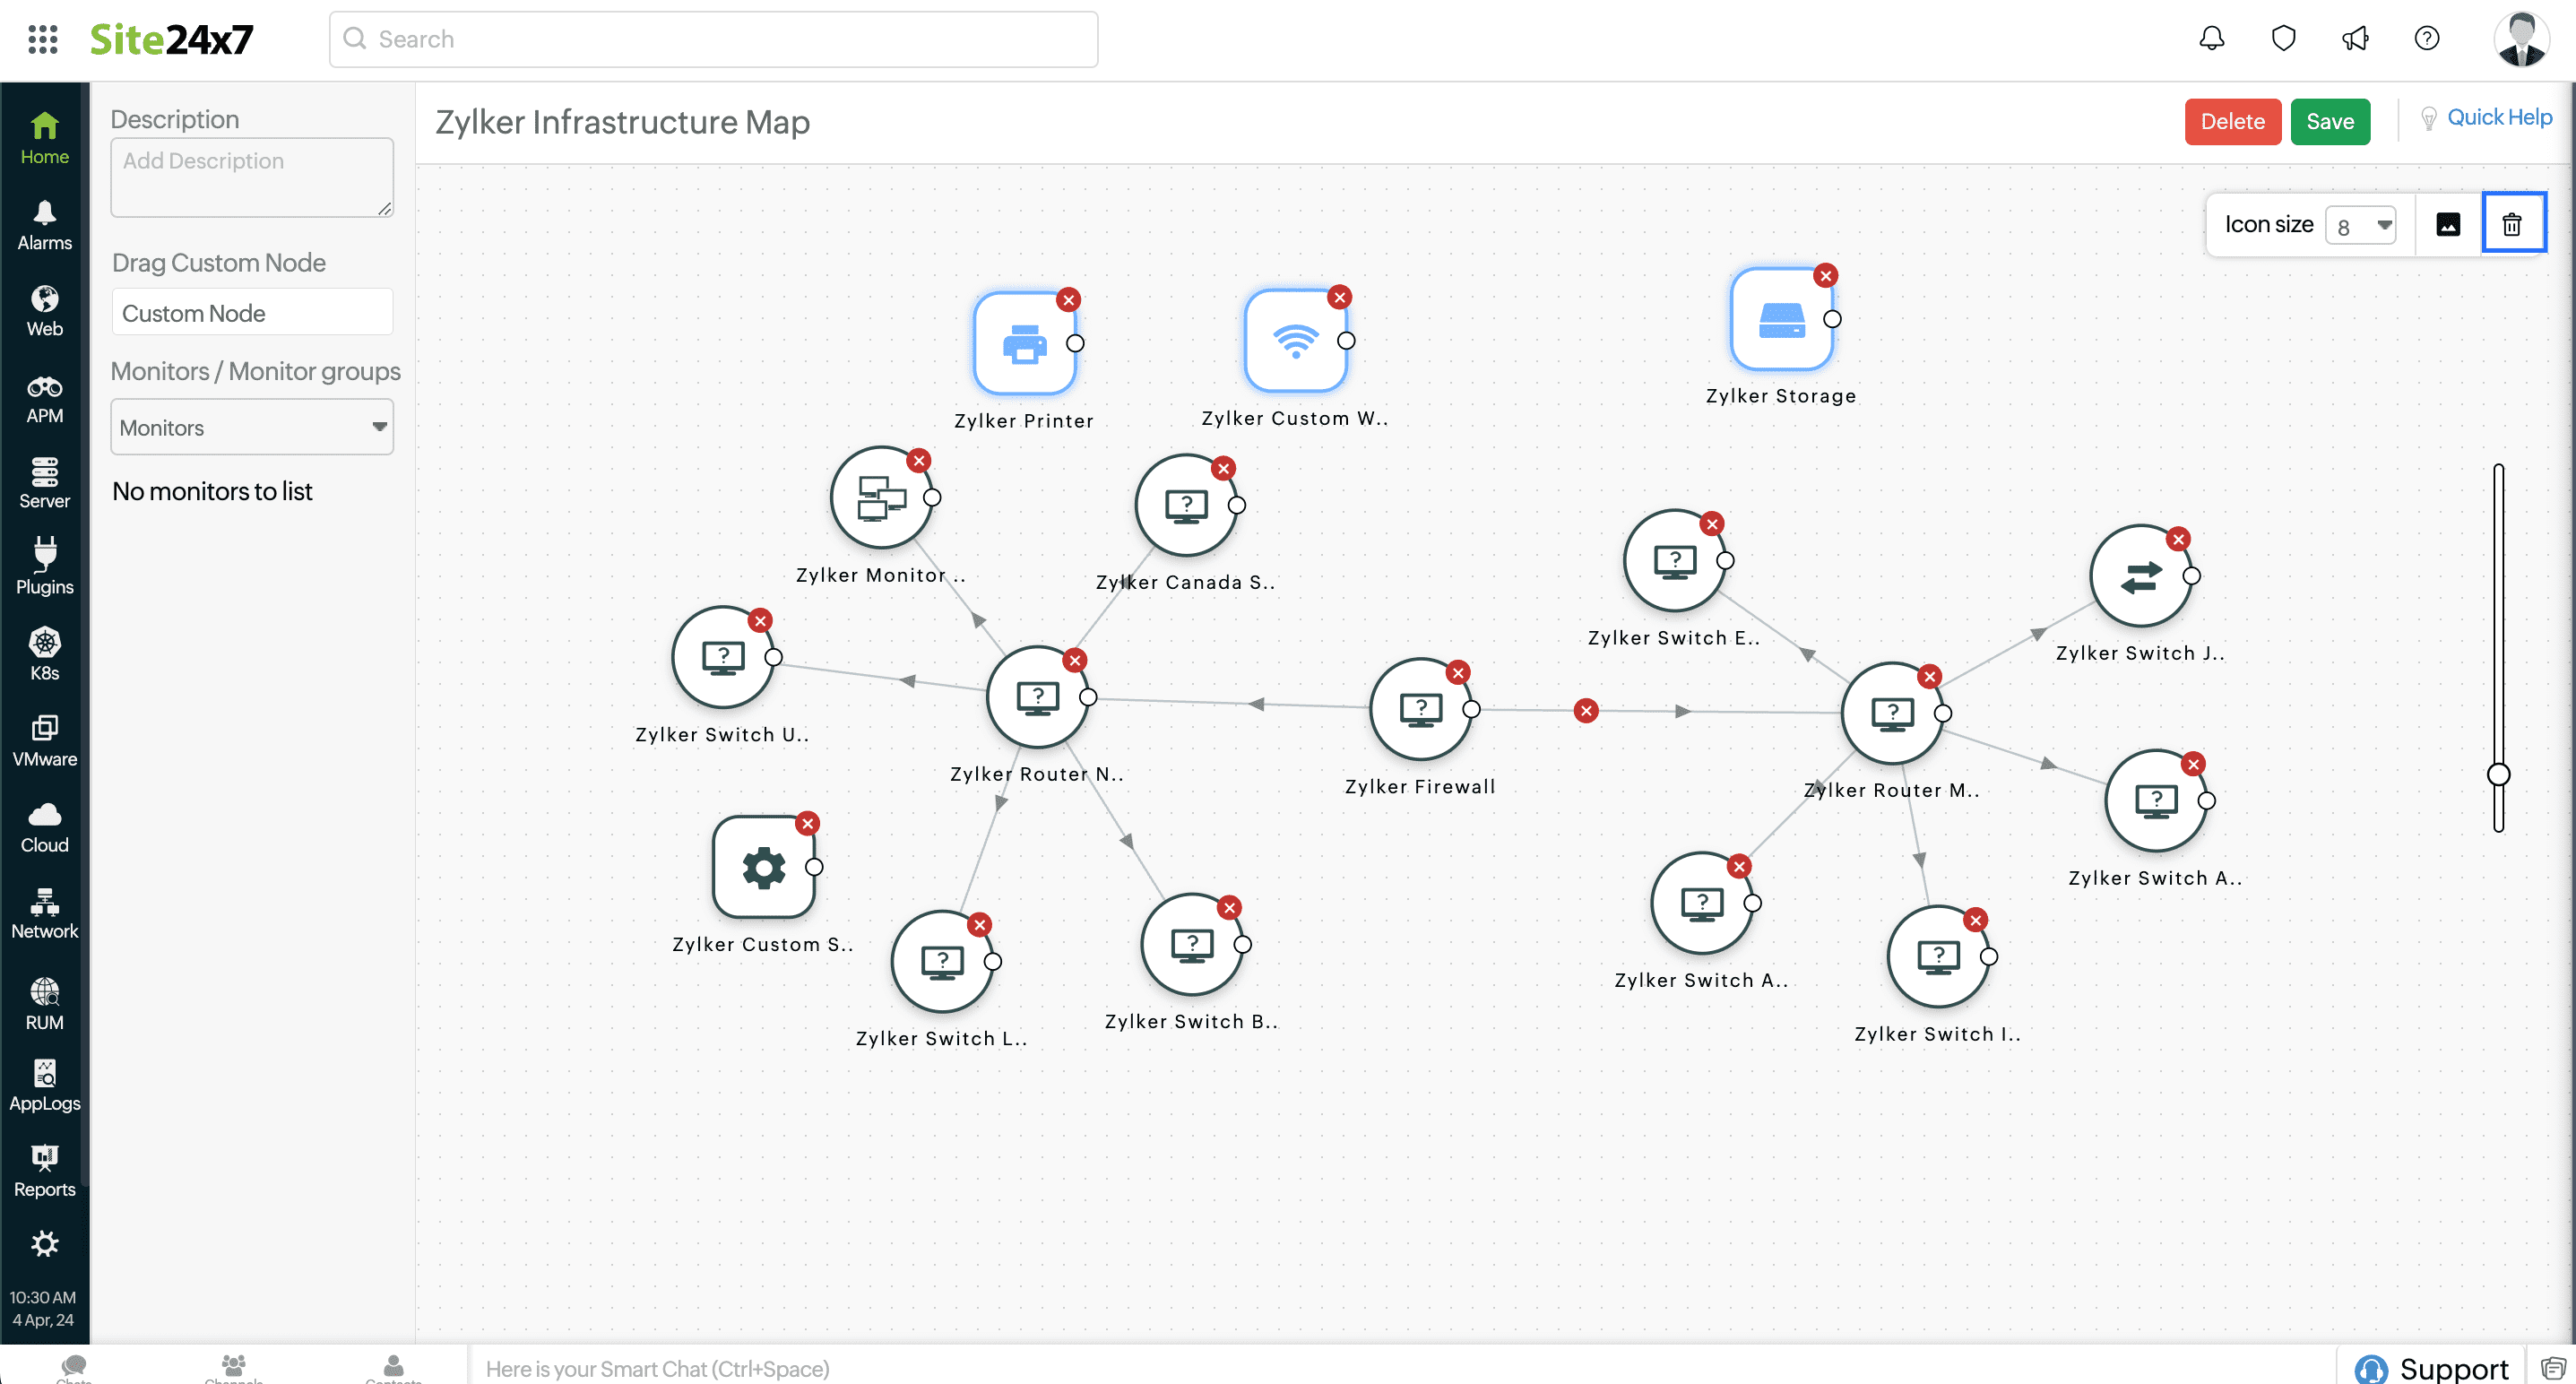
Figure 7. Selecting multiple custom nodes - Clicking the x
icon on any node will delete that node.
- Once you've added multiple monitors to the canvas, you can create interlinks by drawing lines between the mini-circles attached to every monitor icon.
- Provide a suitable Link name. Select which among the two devices' interfaces should form the link, then select an interface from the drop-down list (Figure 8).
NoteYou can link a Custom Node to a device that is monitored within Site24x7. However, interface details for the custom node will not be available.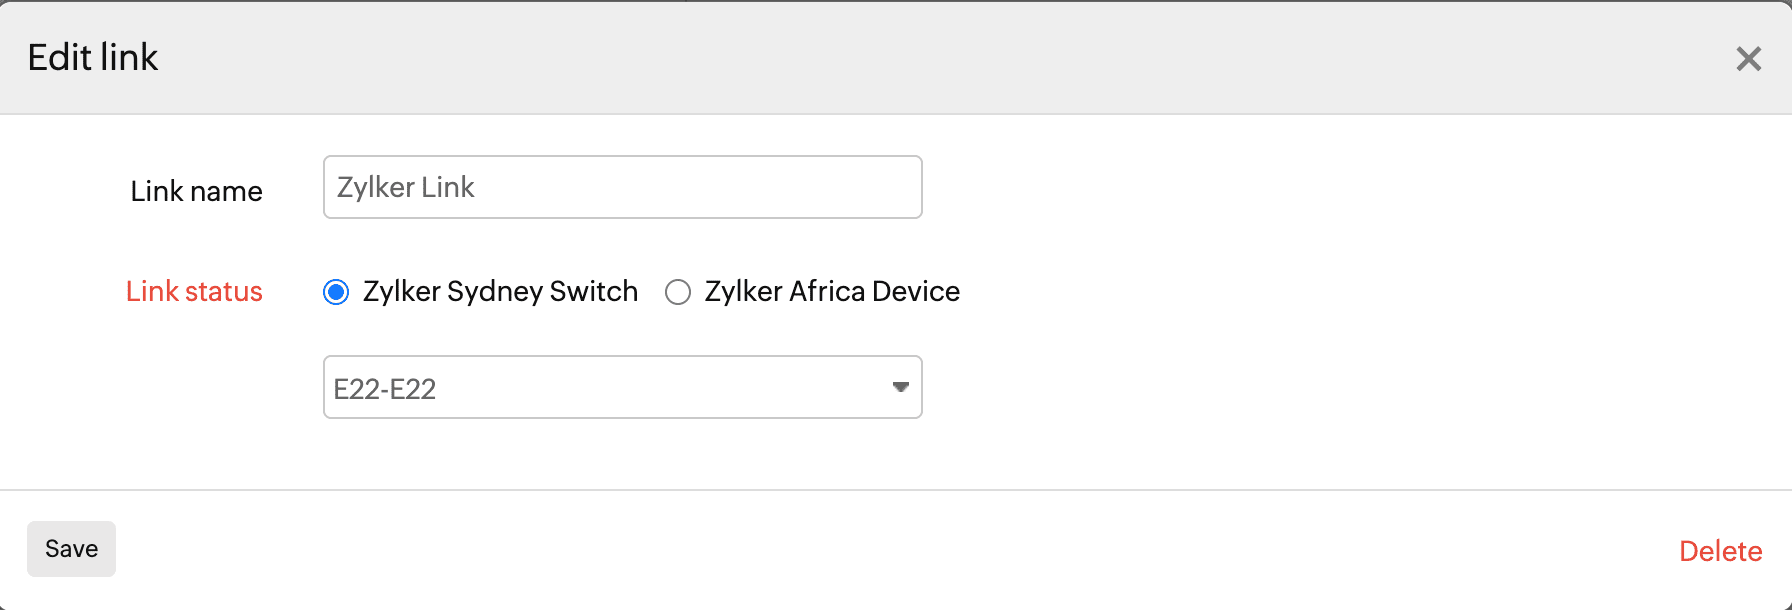
Figure 8. Editing links. - Once you've drawn your topology map over the background image, click Done Customizing. Your map is now created and will be listed. You can view the real-time status of devices and links, directly from the map, by hovering over (Figure 9) or clicking on (Figure 10) a device or a link.
NoteIt is possible to observe real-time updates without the need to manually refresh the page. For instance, if a device or link status changes from Trouble to Critical, the color changes from yellow to orange in real time (Figure 11).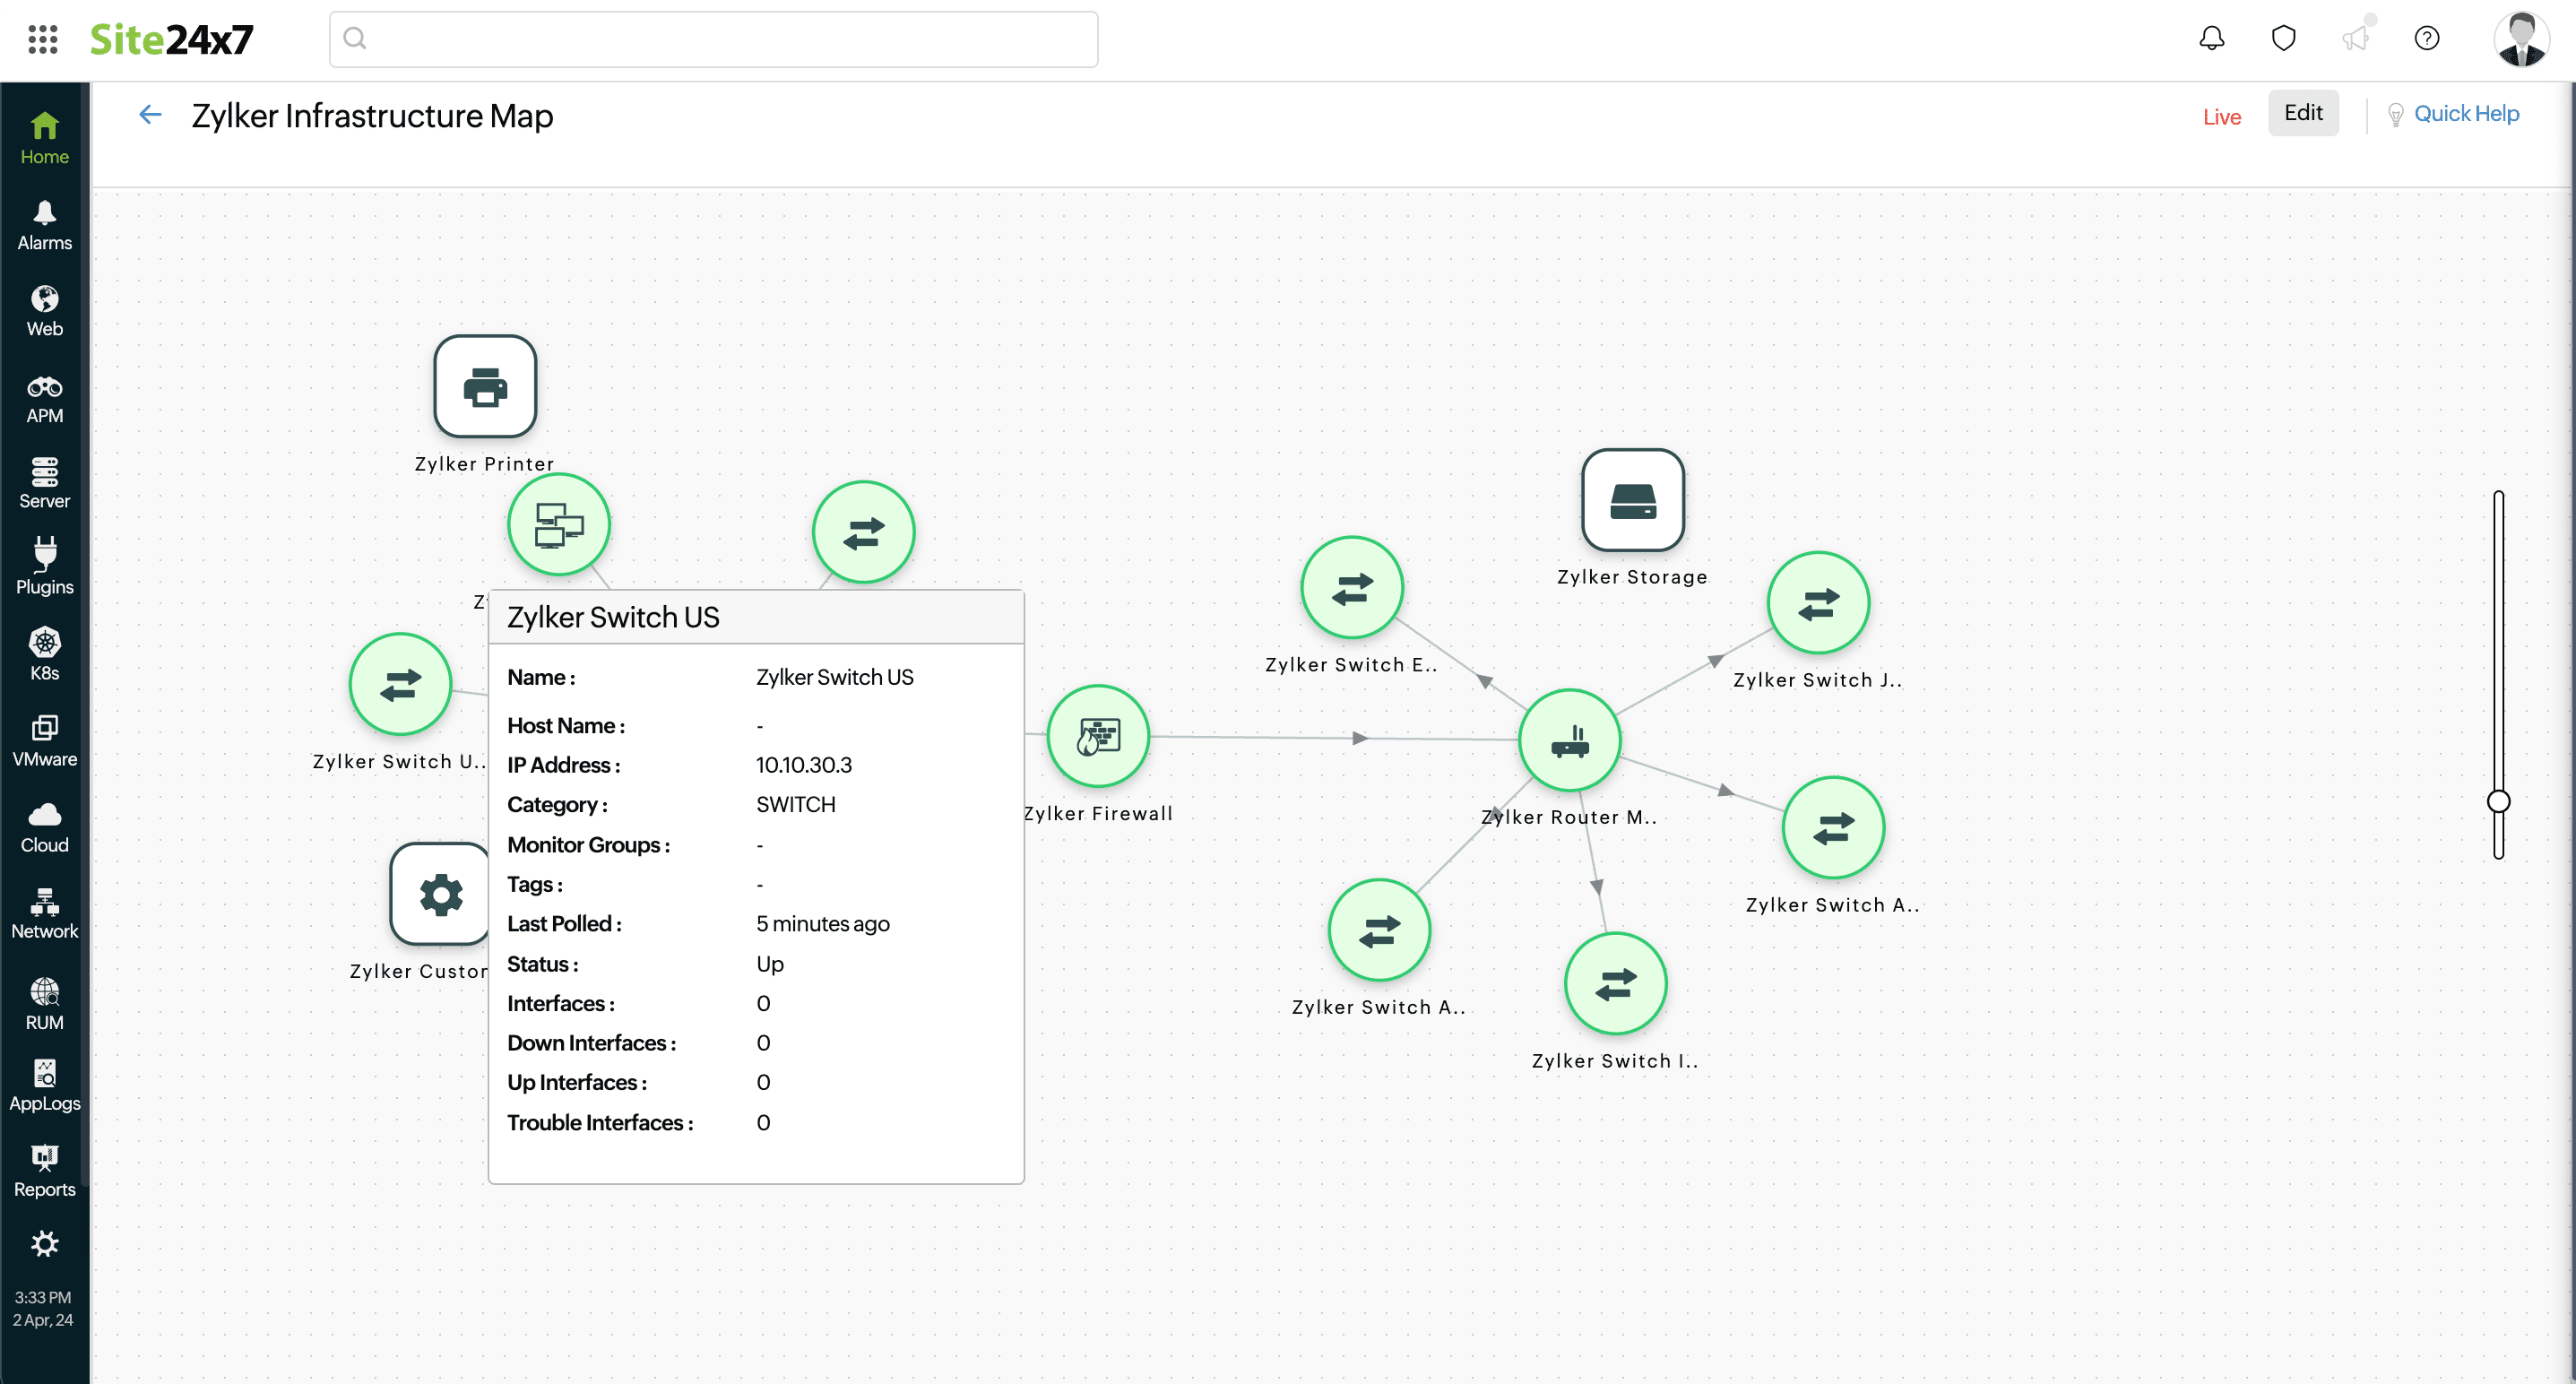
Figure 9. Hovering over a device to reveal details.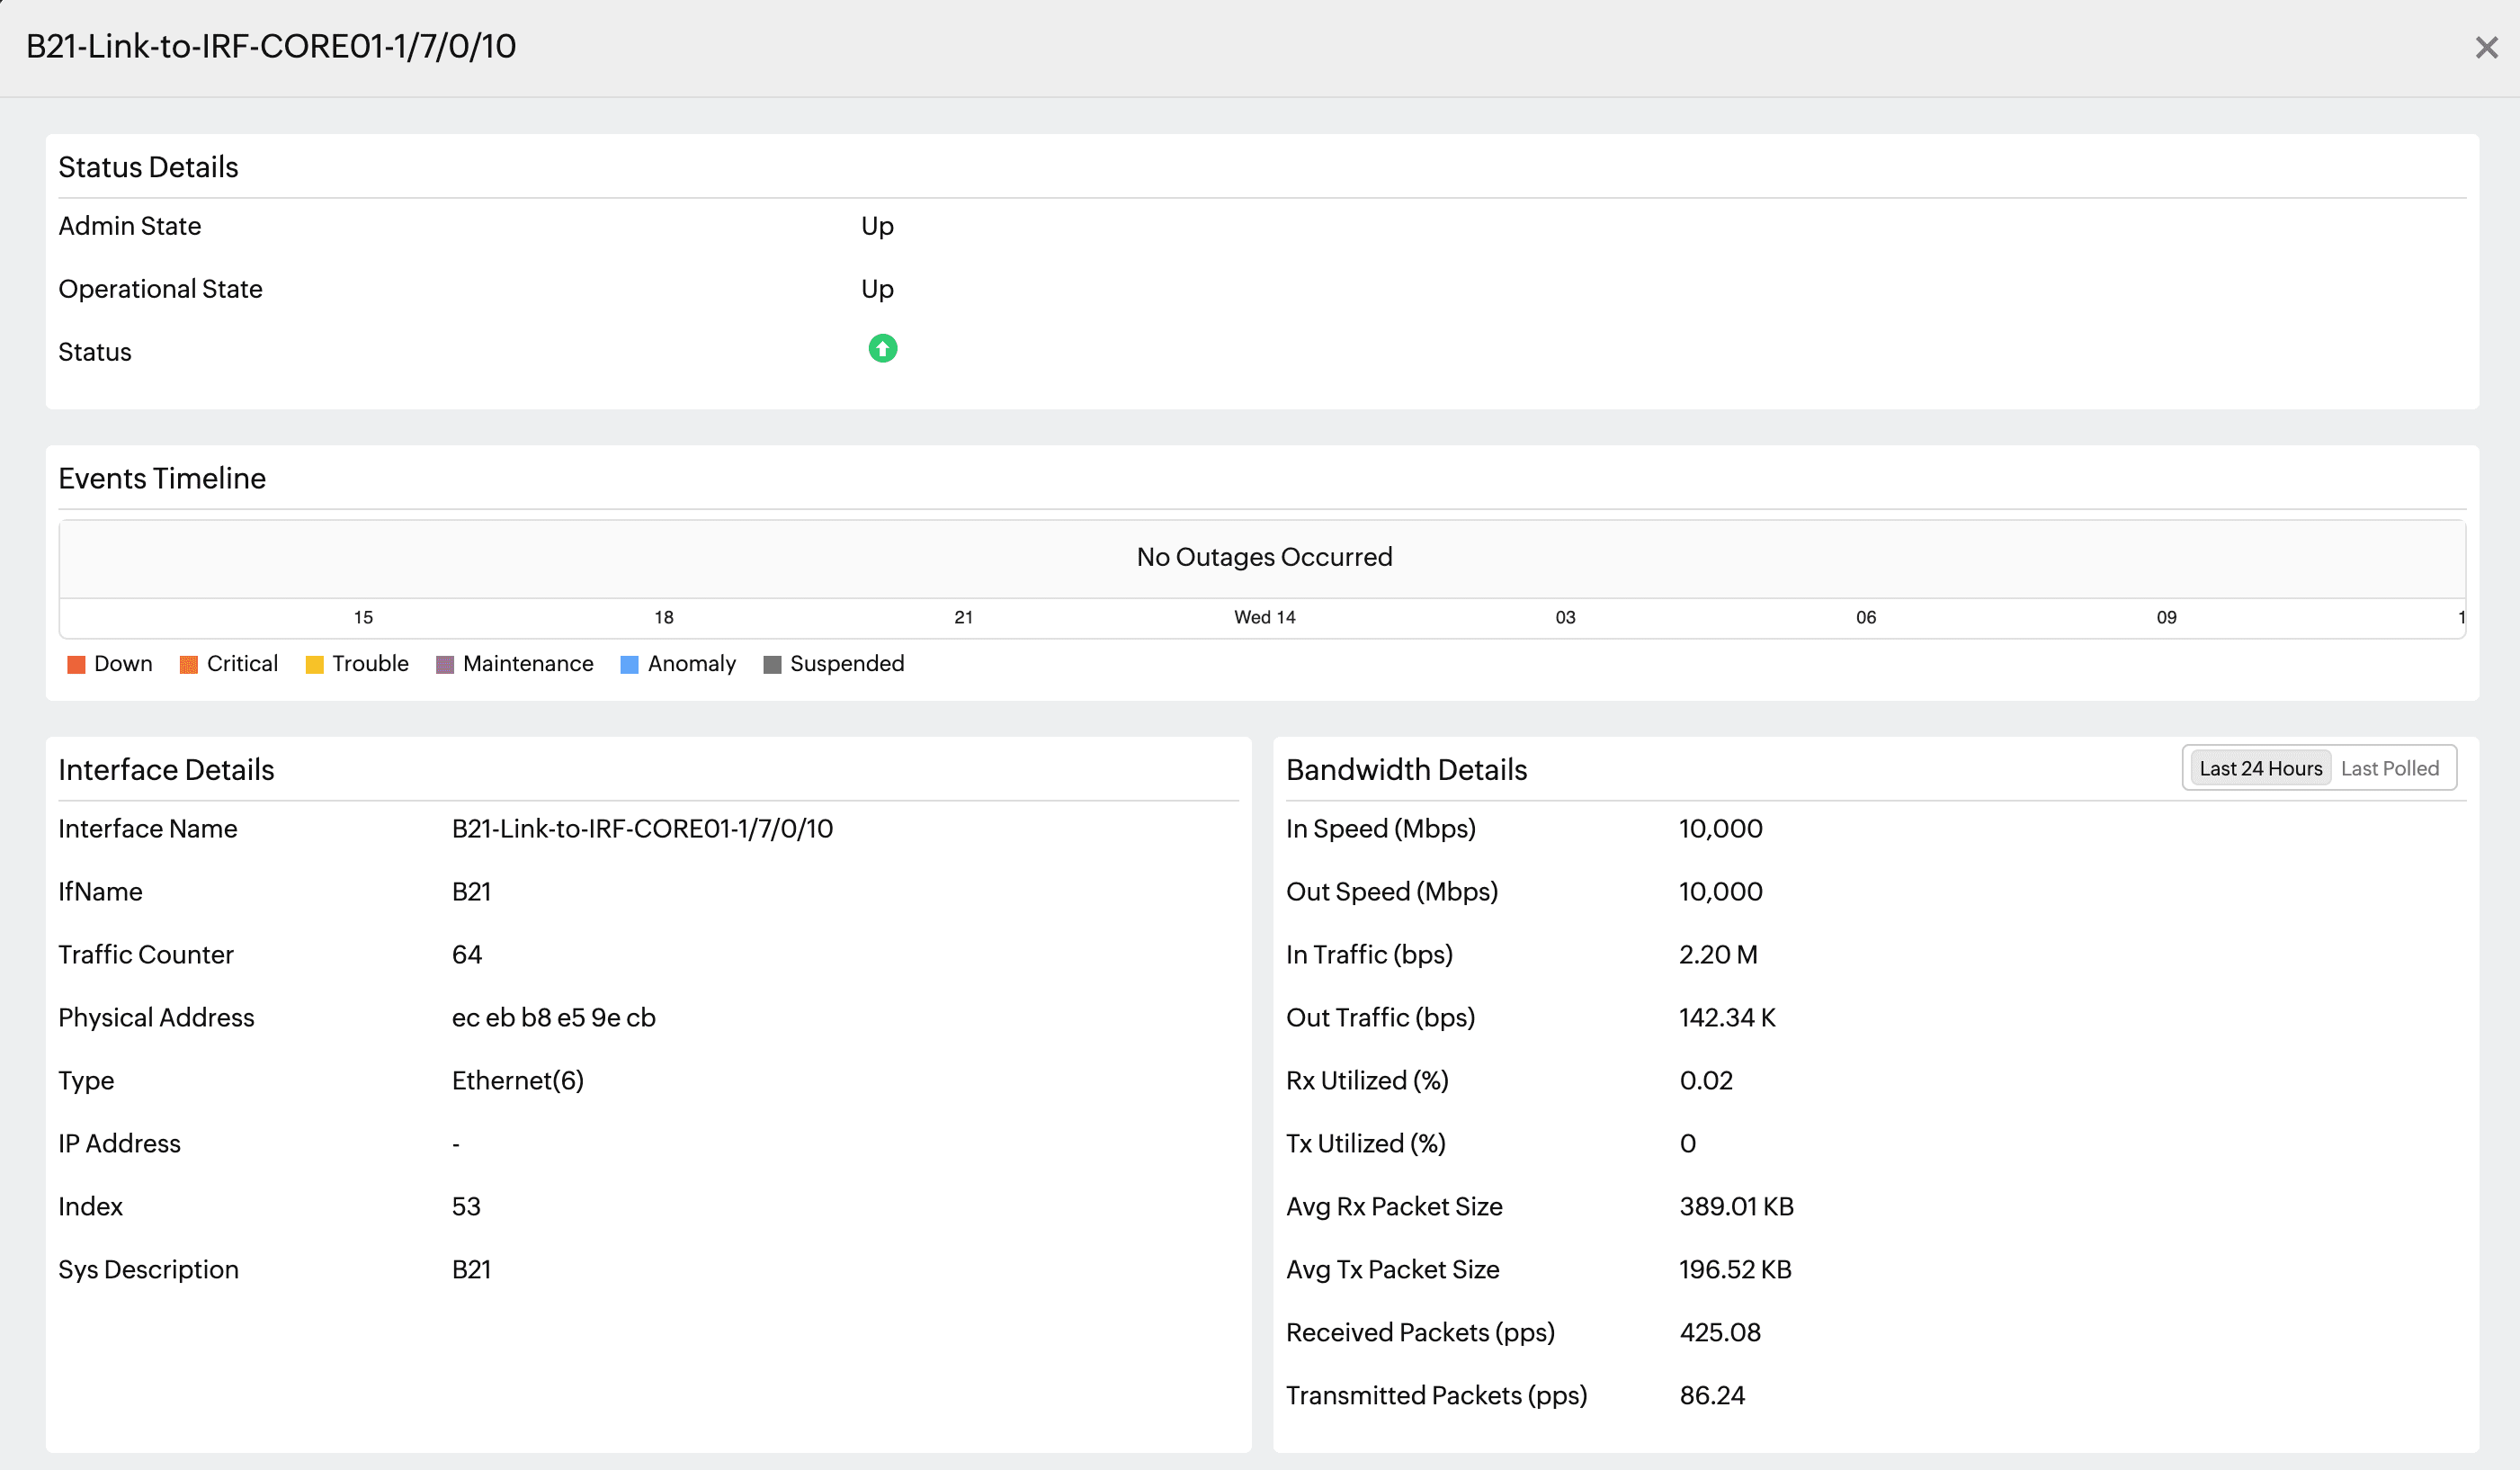
Figure 10. Clicking on an interface link.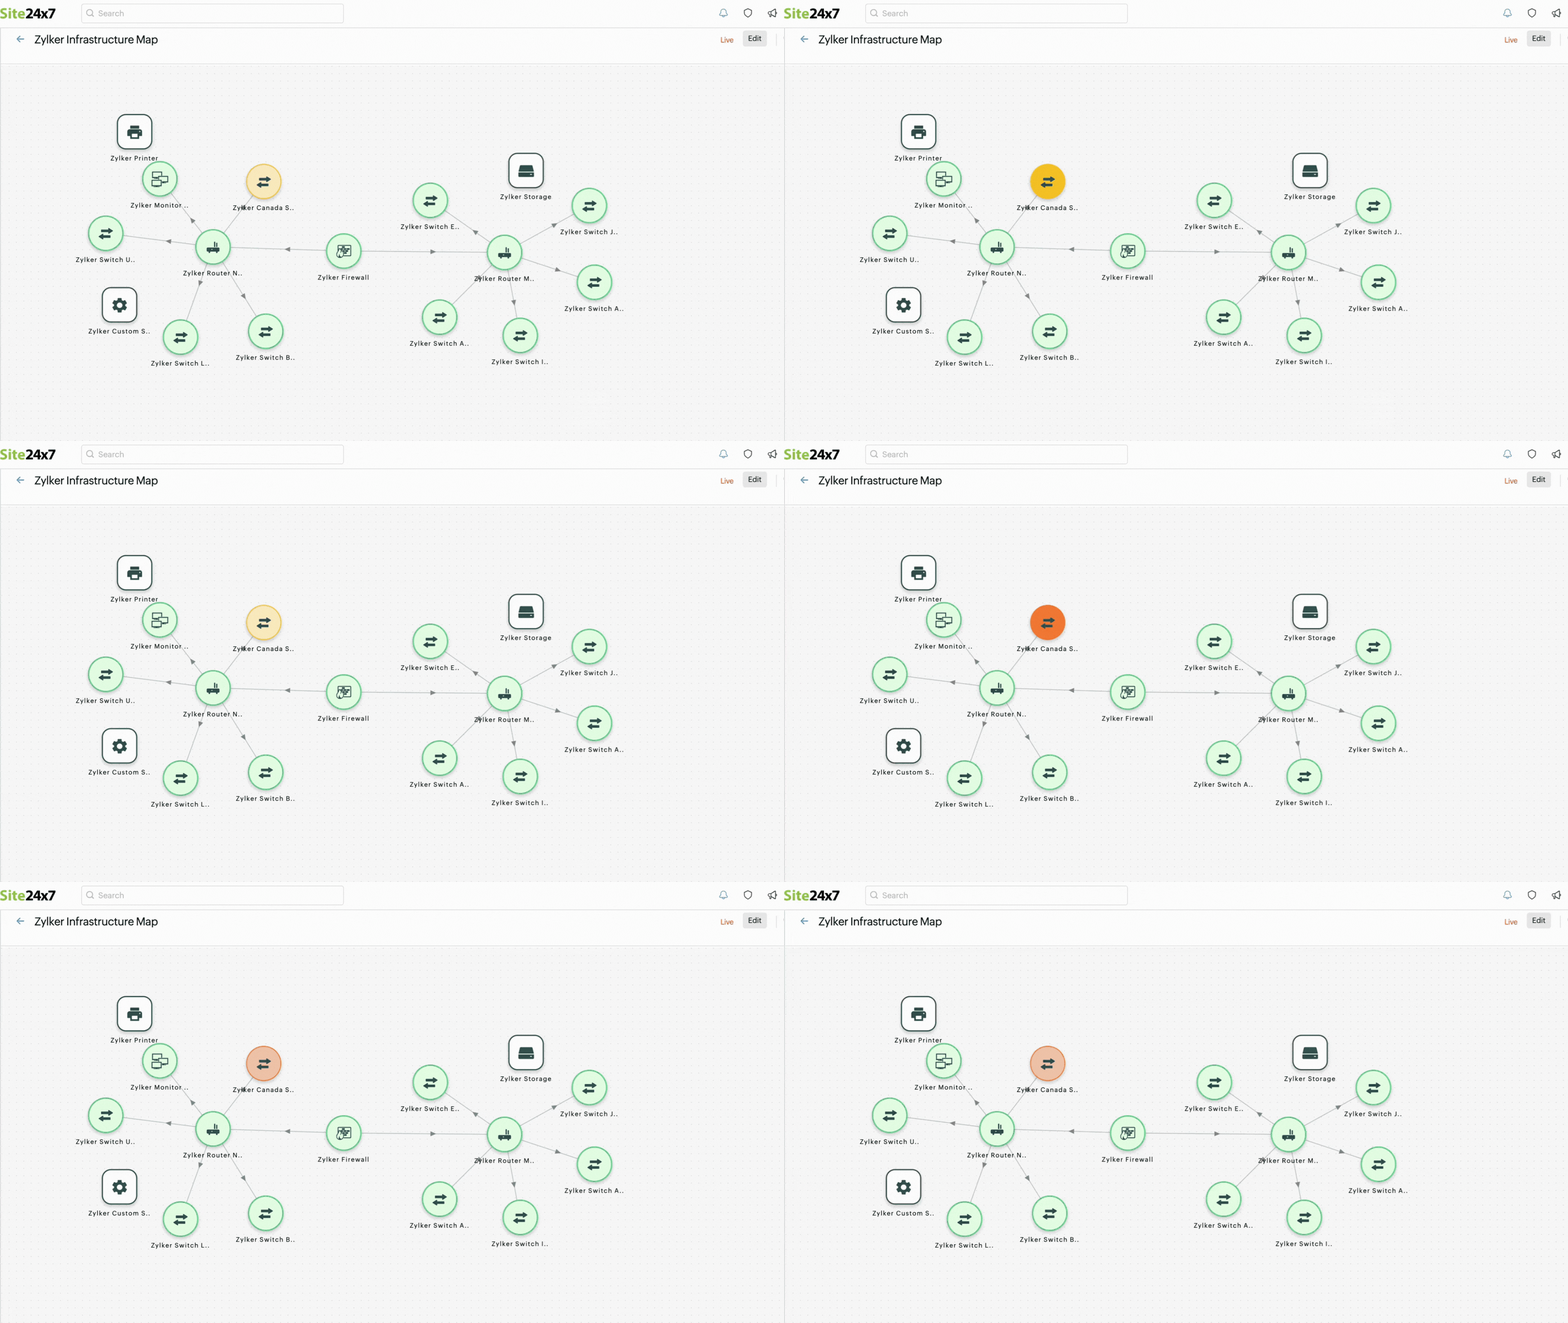
Figure 11. A device status changing from trouble to critical
Editing topology maps
- From the list of topology maps, click on the name of the map that needs to be edited.
- In the Map Editor view that opens, click Edit (Figure 8).
- Once you've finished applying edits, click Save.
Cloning topology maps
- Navigate to Network > Topology Maps.
- Click on the plus
 icon beside a map to clone it. Clicking on Yes (Figure 12) will generate an identical copy of the map that can be modified as needed.
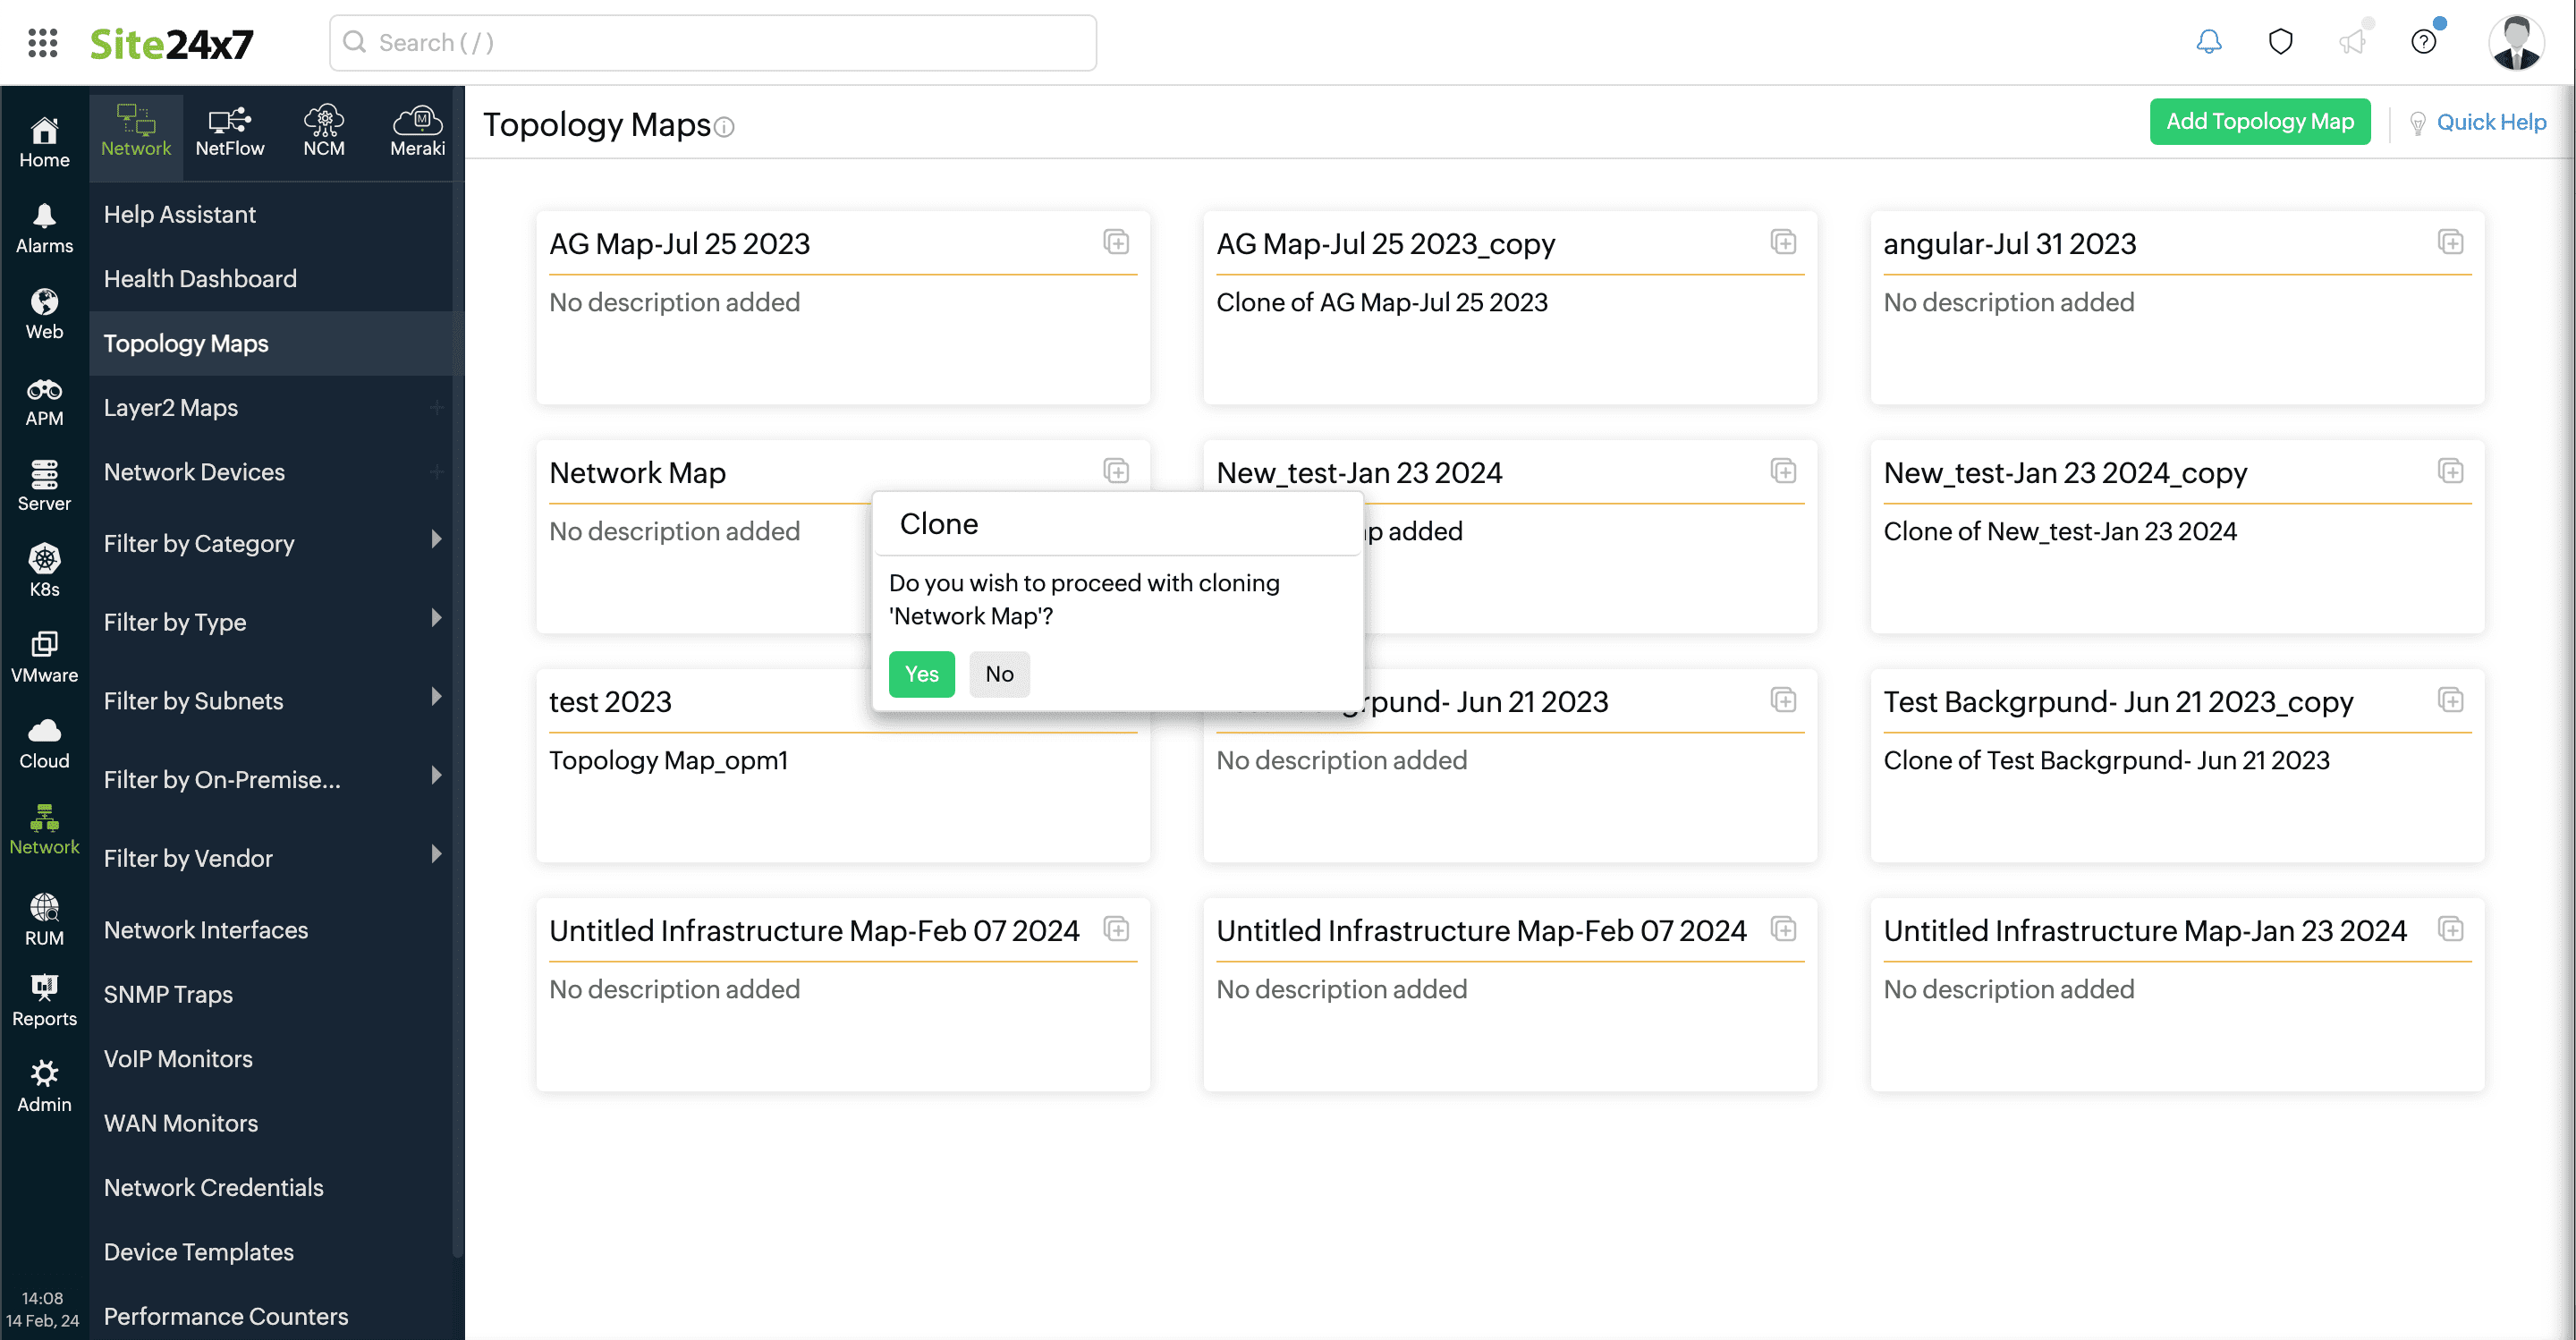
Figure 12. Cloning a topology map.
Understanding the Topology Maps view
- Hover over a node to view basic configuration details for the device along with the number of interfaces that are Up, Down, or in Trouble (Figure 9).
- Click on a node to view a graph of the network device's real-time performance stats such as response time and packet loss (Figure 13).
NoteThis will not be available for custom nodes.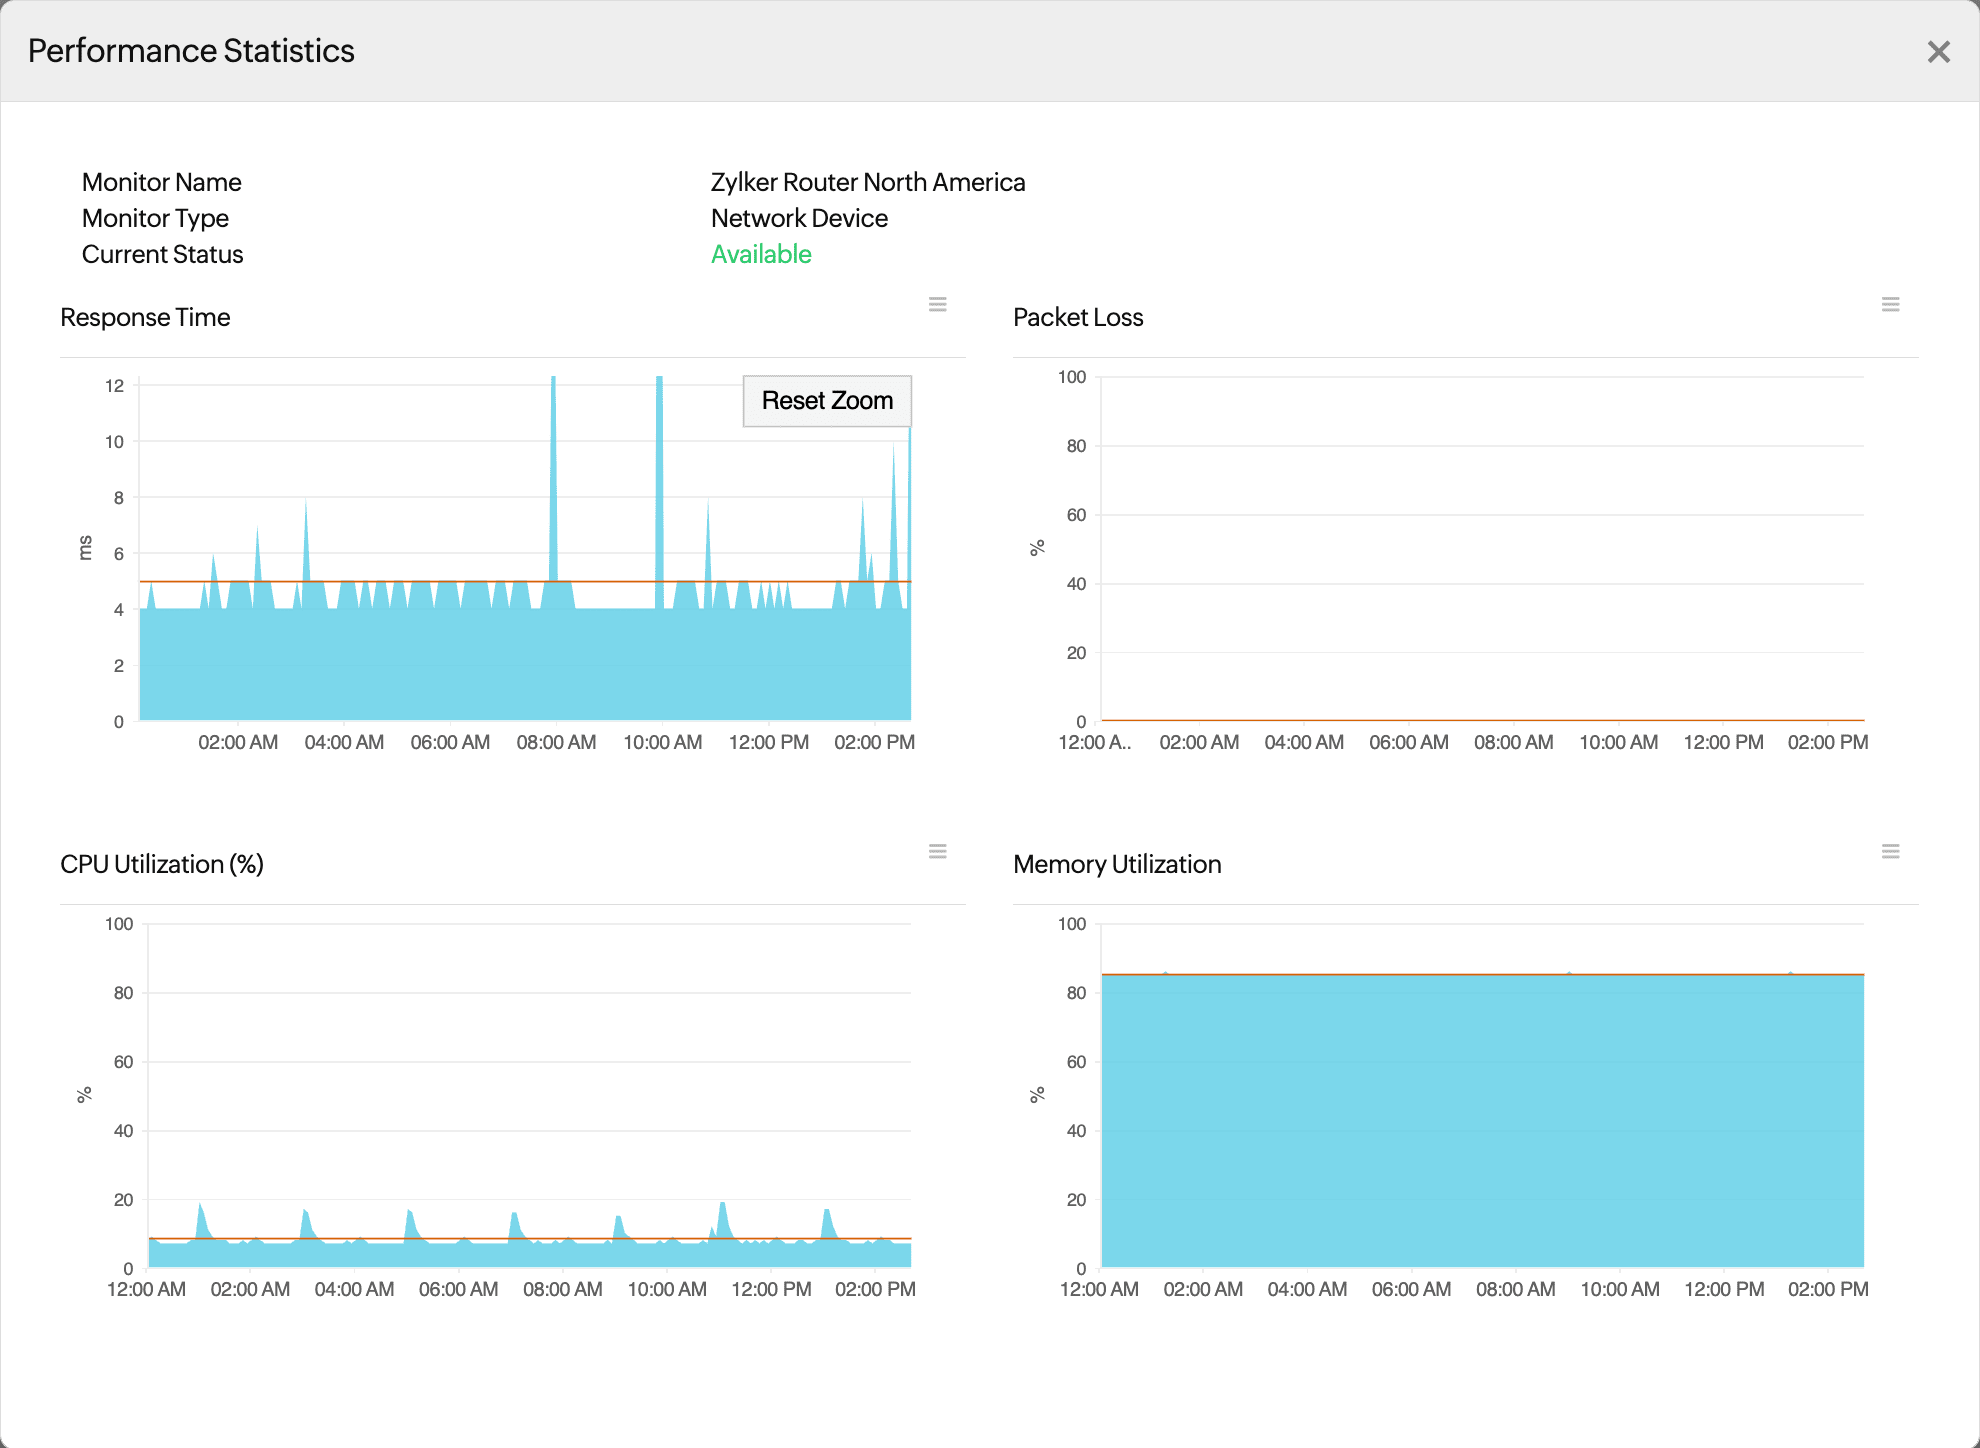
Figure 13. Root cause analysis for a device from its topology map. - Hover over a link to view basic configuration details, operational state, and admin state of the interface.
- Click on a monitor group to navigate to its Summary page.
- Click on a link to view a graph of the interface's real-time performance stats like traffic, packets, errors, and discards (Figure 10).
- The status of nodes and links are displayed as green, red, yellow, or orange, which denote that they're Up, Down, in Trouble, or Critical respectively.
- The link between the two network devices will change color when a status change is detected.
