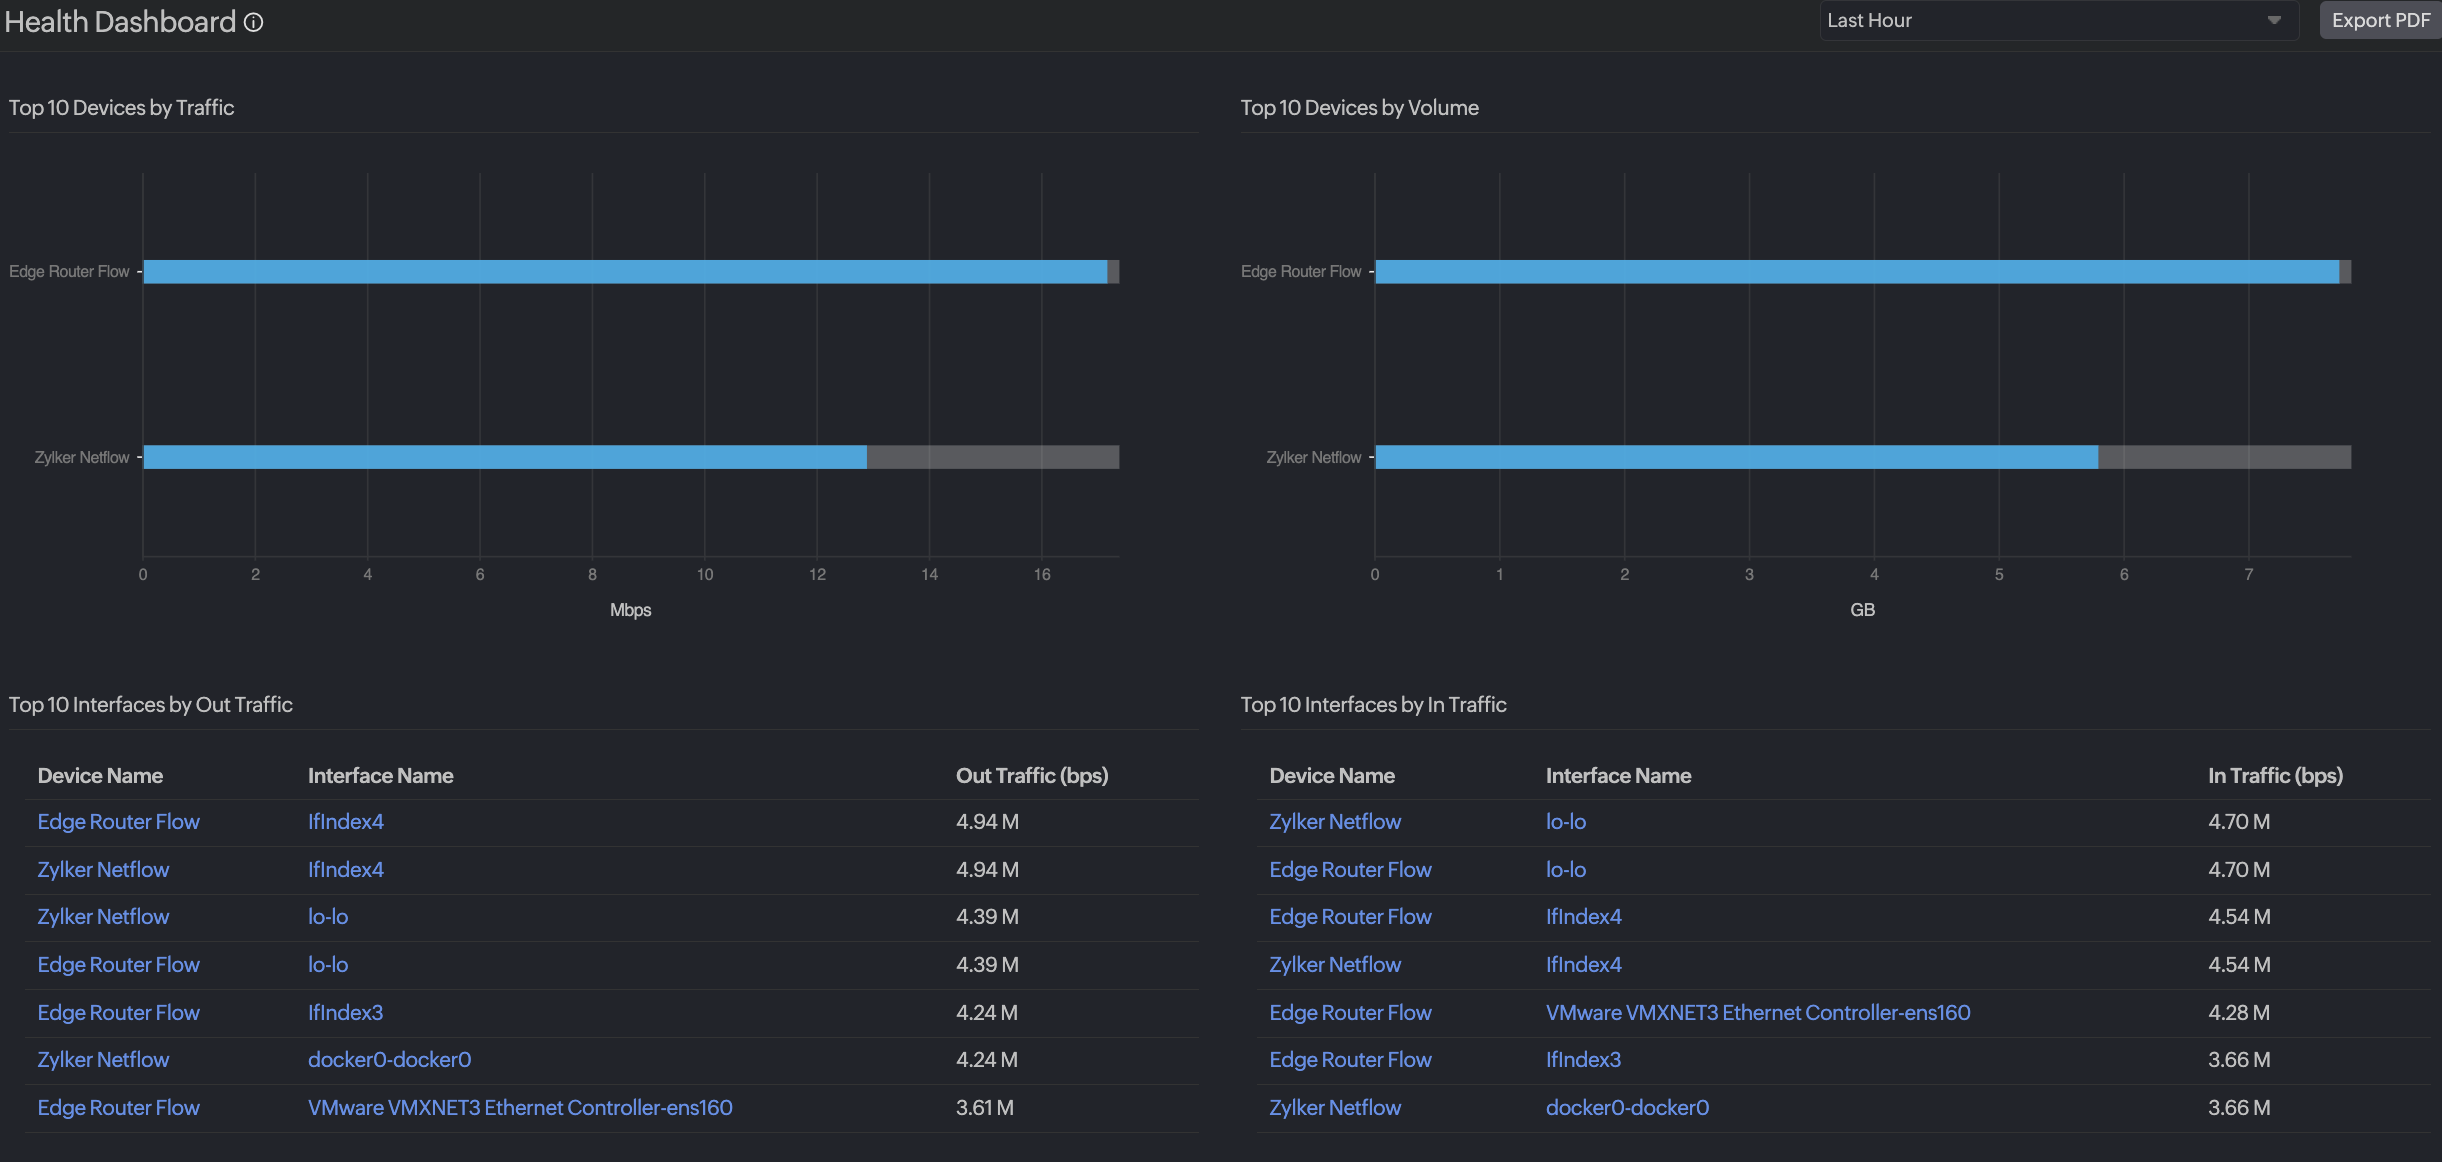
NetFlow Health Dashboard
Obtain a complete picture of the top devices and interfaces that generate maximum traffic and use the network bandwidth with NetFlow analysis. The NetFlow Health Dashboard will give you a thorough understanding of traffic patterns in your network and the interfaces that carry maximum traffic.
First, add your devices and configure them to export flows to Site24x7. Then, view key performance metrics.
NetFlow Health Dashboard uses
Using the Health Dashboard, you can:
- Identify the top devices that generate higher volumes of traffic.
- Identify the interfaces that utilize more bandwidth and optimize them.
- Spot the top interfaces by in and out traffic, and channel the traffic to other interfaces that carry minimum loads.
- Reduce workloads and fix network lag.
- Plan resource allocation across devices and interfaces.
Viewing the Health Dashboard
- Log in to your Site24x7 account.
- Navigate to Network > NetFlow > Health Dashboard.
Widgets on the Health Dashboard
You can see the following widgets on the Health Dashboard:
- Top 10 Devices by Traffic
- Top 10 Devices by Volume
- Top 10 Interfaces by Out Traffic
- Top 10 Interfaces by In Traffic
- Top 10 Interfaces by Bandwidth Transmitted (Tx Utilization)
- Top 10 Interfaces by Bandwidth Received (Rx Utilization)
- Top 10 Interfaces by Volume Transmitted (Tx Volume)
- Top 10 Interfaces by Volume Received (Rx Volume)
- Top 10 Applications by In Traffic
- Top 10 Applications by Out Traffic
- Top 10 Protocols by In Traffic
- Top 10 Protocols by Out Traffic
- Top 10 QoS by In Traffic
- Top 10 QoS by Out Traffic
- Top 10 Source IP Addresses by Traffic
- Top 10 Destination IP Addresses by Traffic
- Top 10 Conversations by In Traffic

More dashboard features
- Click the Export PDF button to export your Health Dashboard in PDF format.
- Use the drop-down menu next to the export button to choose a time period. You can pull data from the last hour, the previous day, this week, last week, this month, and last month.
