PagerDuty Logs
PagerDuty is a SaaS incident management platform through which you can manage your alerts under one console. You can forward your PagerDuty incident logs and surrounding information to Site24x7 AppLogs. This would enable you to create, monitor, and analyze your dashboards under one console.
To integrate Site24x7 AppLogs with PagerDuty, follow the steps below.
Create a Log Type in Site24x7 AppLogs
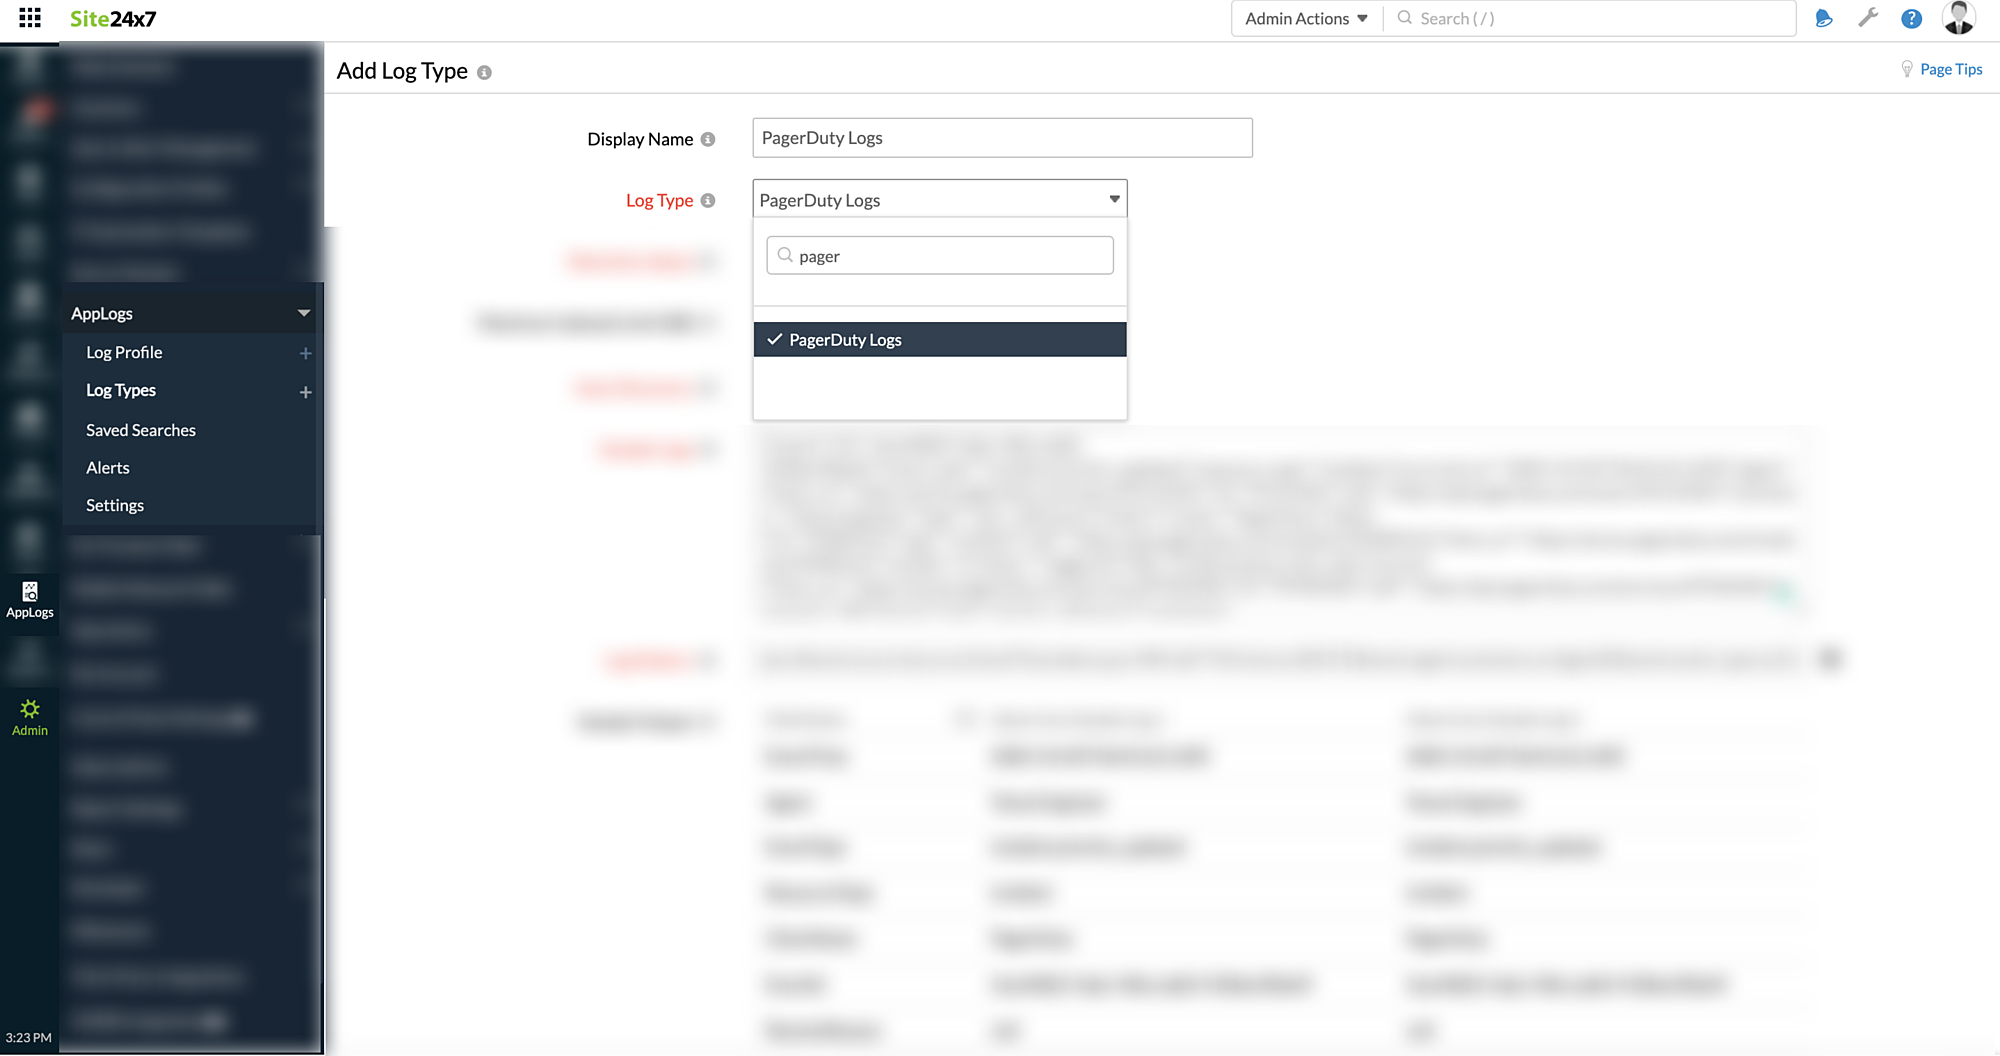
- Log in to your Site24x7 account > Admin > AppLogs > Add Log Type.
- Enter a Display Name.
- Choose PagerDuty from the Log Type drop-down.

- Enter the Retention Period and Maximum Upload Limit.
- By default, this is the log pattern identified for PagerDuty logs by Site24x7 AppLogs.
- Log Pattern:
json $event.occurred_at as EventTime:date:yyyy-MM-dd'T'HH:mm:ss.SSS'Z'$ $event.agent.summary as Agent$ $event.event_type as EventType$ $event.resource_type as ResourceType$ $event.client.name as ClientName$ $event.id as EventId$ $event.data.resolve_reason as ResolveReason$ $event.data.title as Title$ $event.data.escalation_policy.summary as EscalationPolicy$ $event.data.priority.summary as Priority$ $event.data.number as IncidentNumber:number$ $event.data.urgency as Urgency$ $event.data.service.summary as service$ $event.data.id as IncidentId$ $event.data.status as Status$ $event.data.assignees[0].summary as User$ $event.data.teams[0].summary as Team$
- Sample Logs:
{"event":{"id":"5ac64822-4adc-4fda-ade0-410becf0de4f","event_type":"incident.priority_updated","resource_type":"incident","occurred_at":"2020-10-02T18:45:22.169Z","agent":{"html_url":"https://acme.pagerduty.com/users/PLH1HKV","id":"PLH1HKV","self":"https://api.pagerduty.com/users/PLH1HKV","summary":"Tenex Engineer","type":"user_reference"},"client":{"name":"PagerDuty"},"data":{"id":"PGR0VU2","type":"incident","self":"https://api.pagerduty.com/incidents/PGR0VU2","html_url":"https://acme.pagerduty.com/incidents/PGR0VU2","number":2,"status":"triggered","title":"A little bump in the road","service":{"html_url":"https://acme.pagerduty.com/services/PF9KMXH","id":"PF9KMXH","self":"https://api.pagerduty.com/services/PF9KMXH","summary":"API Service","type":"service_reference"},"assignees":[{"html_url":"https://acme.pagerduty.com/users/PTUXL6G","id":"PTUXL6G","self":"https://api.pagerduty.com/users/PTUXL6G","summary":"User 123","type":"user_reference"}],"escalation_policy":{"html_url":"https://acme.pagerduty.com/escalation_policies/PUS0KTE","id":"PUS0KTE","self":"https://api.pagerduty.com/escalation_policies/PUS0KTE","summary":"Default","type":"escalation_policy_reference"},"teams":[{"html_url":"https://acme.pagerduty.com/teams/PFCVPS0","id":"PFCVPS0","self":"https://api.pagerduty.com/teams/PFCVPS0","summary":"Engineering","type":"team_reference"}],"priority":{"html_url":"https://acme.pagerduty.com/account/incident_priorities","id":"PSO75BM","self":"https://api.pagerduty.com/priorities/PSO75BM","summary":"P1","type":"priority_reference"},"urgency":"high","conference_bridge":{"conference_number":"+1 1234123412,,987654321#","conference_url":"https://example.com"},"resolve_reason":null}}}
- Log Pattern:
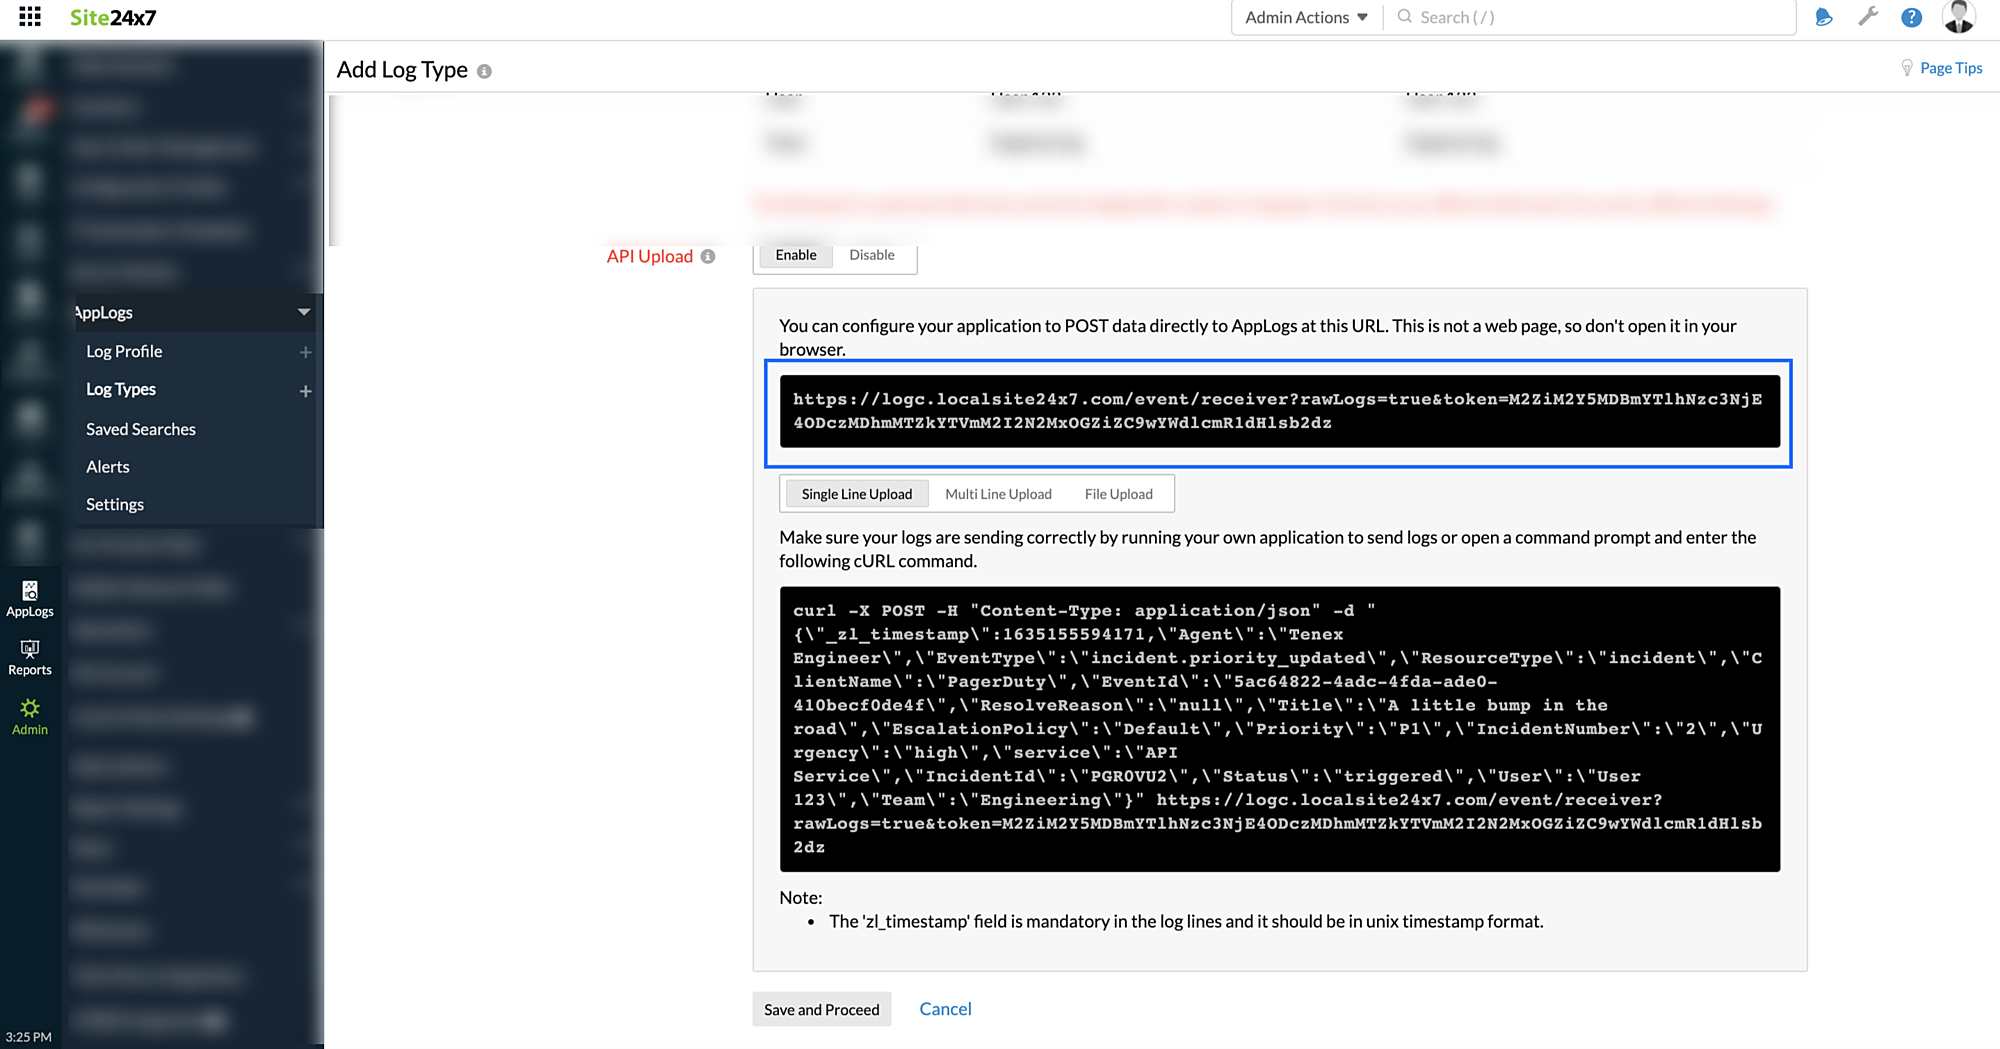
- Copy the API endpoint URL given below as shown in the screenshot.

- Click Save.
Integrate Site24x7 AppLogs with PagerDuty
- Log in to your PagerDuty account.
- Navigate to your dashboards, select the Integration tab, and click Webhooks.

- Click Create New Webhook.
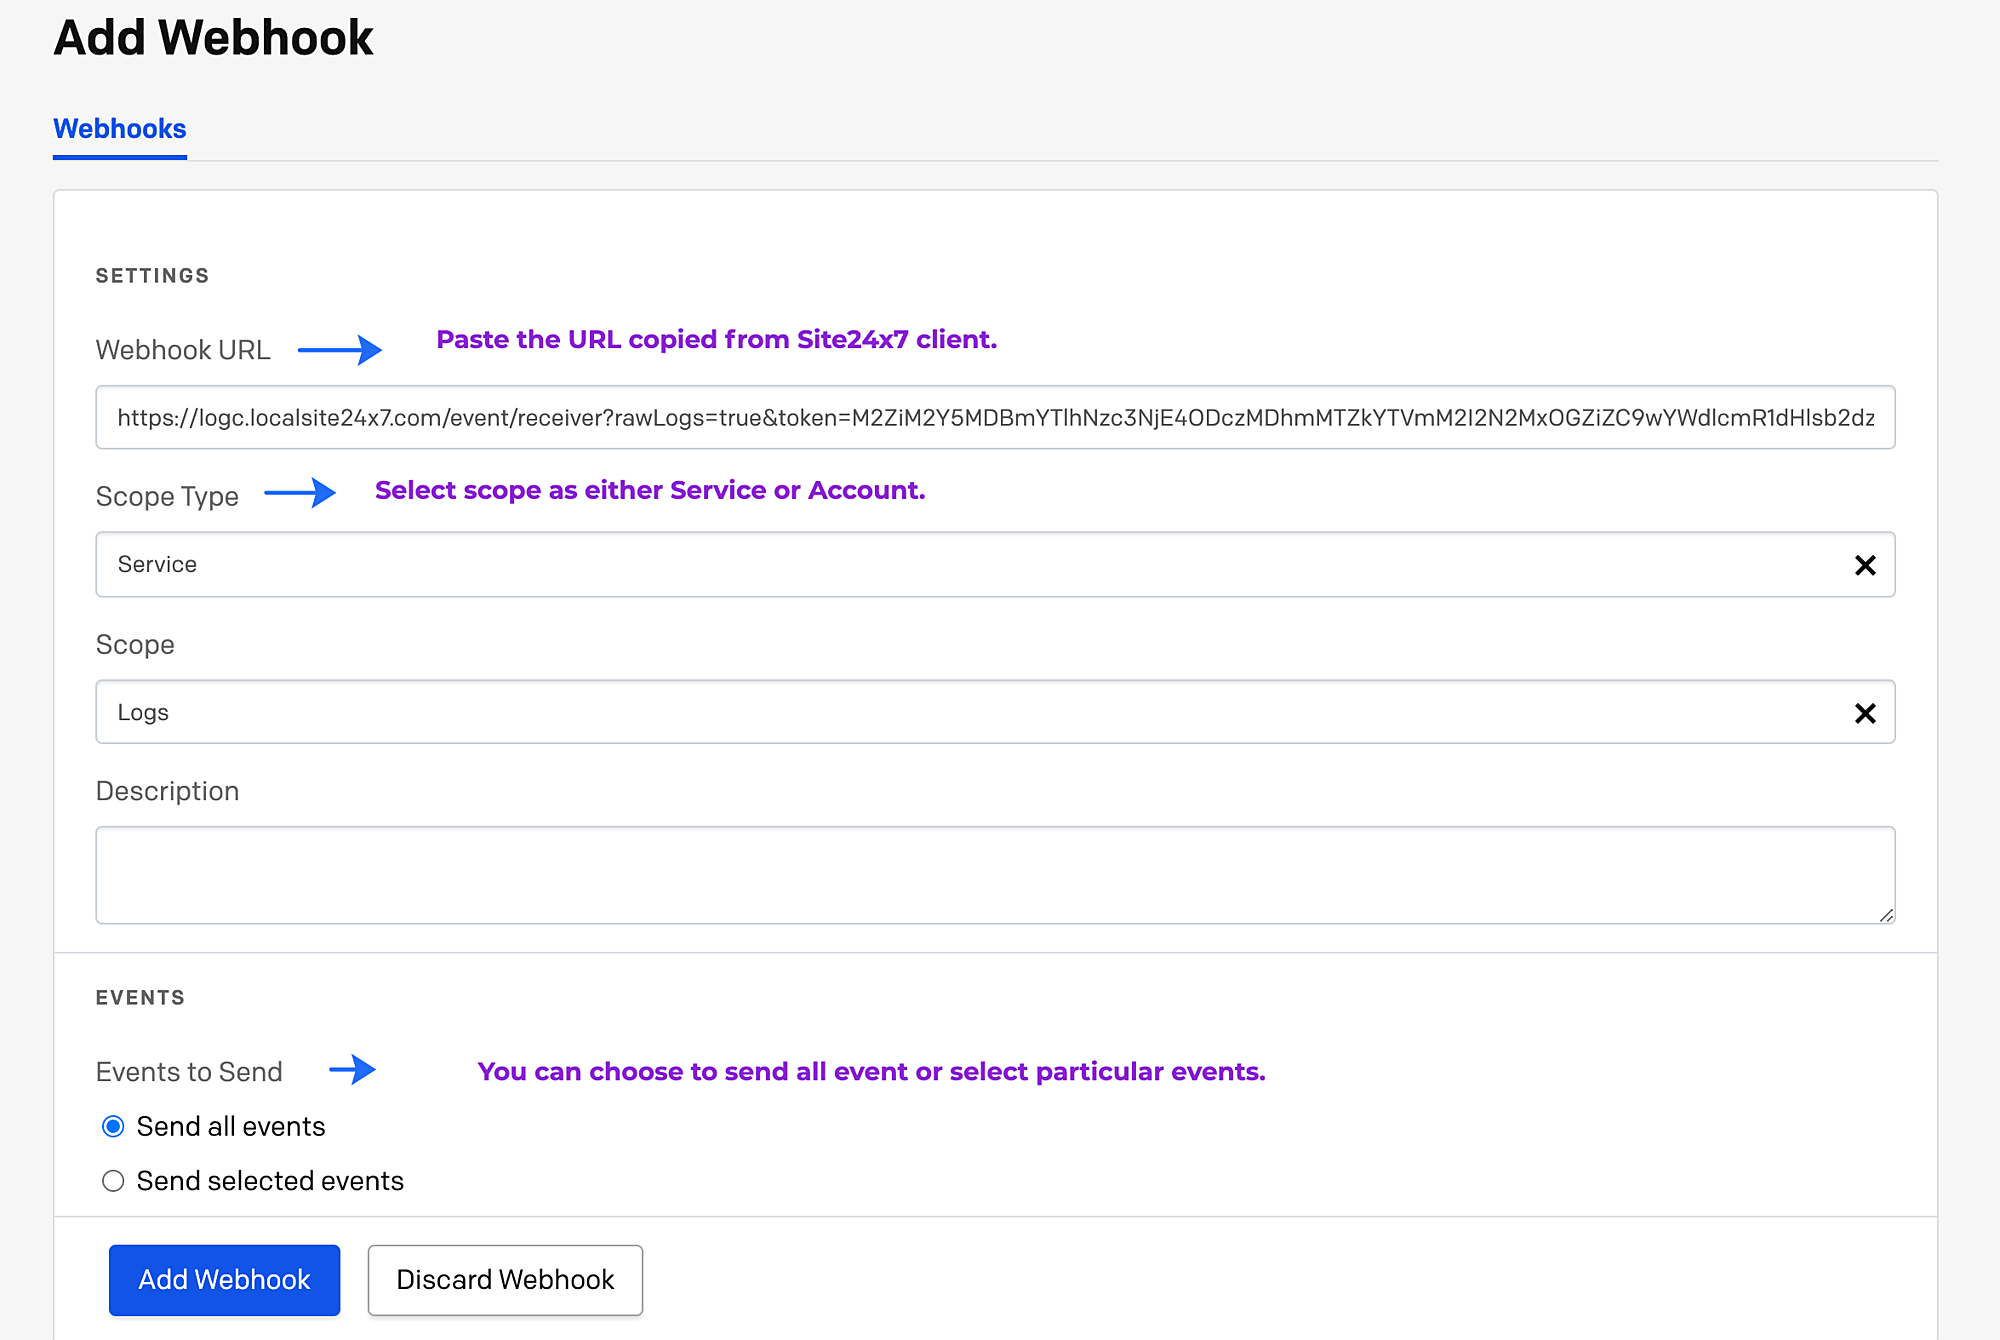
- Add the API endpoint URL copied from Site24x7 in the Webhook URL field
- Choose the Scope Type and choose either Send all events or Send selected events under Events to send.
- Click Add Webhook.

View data
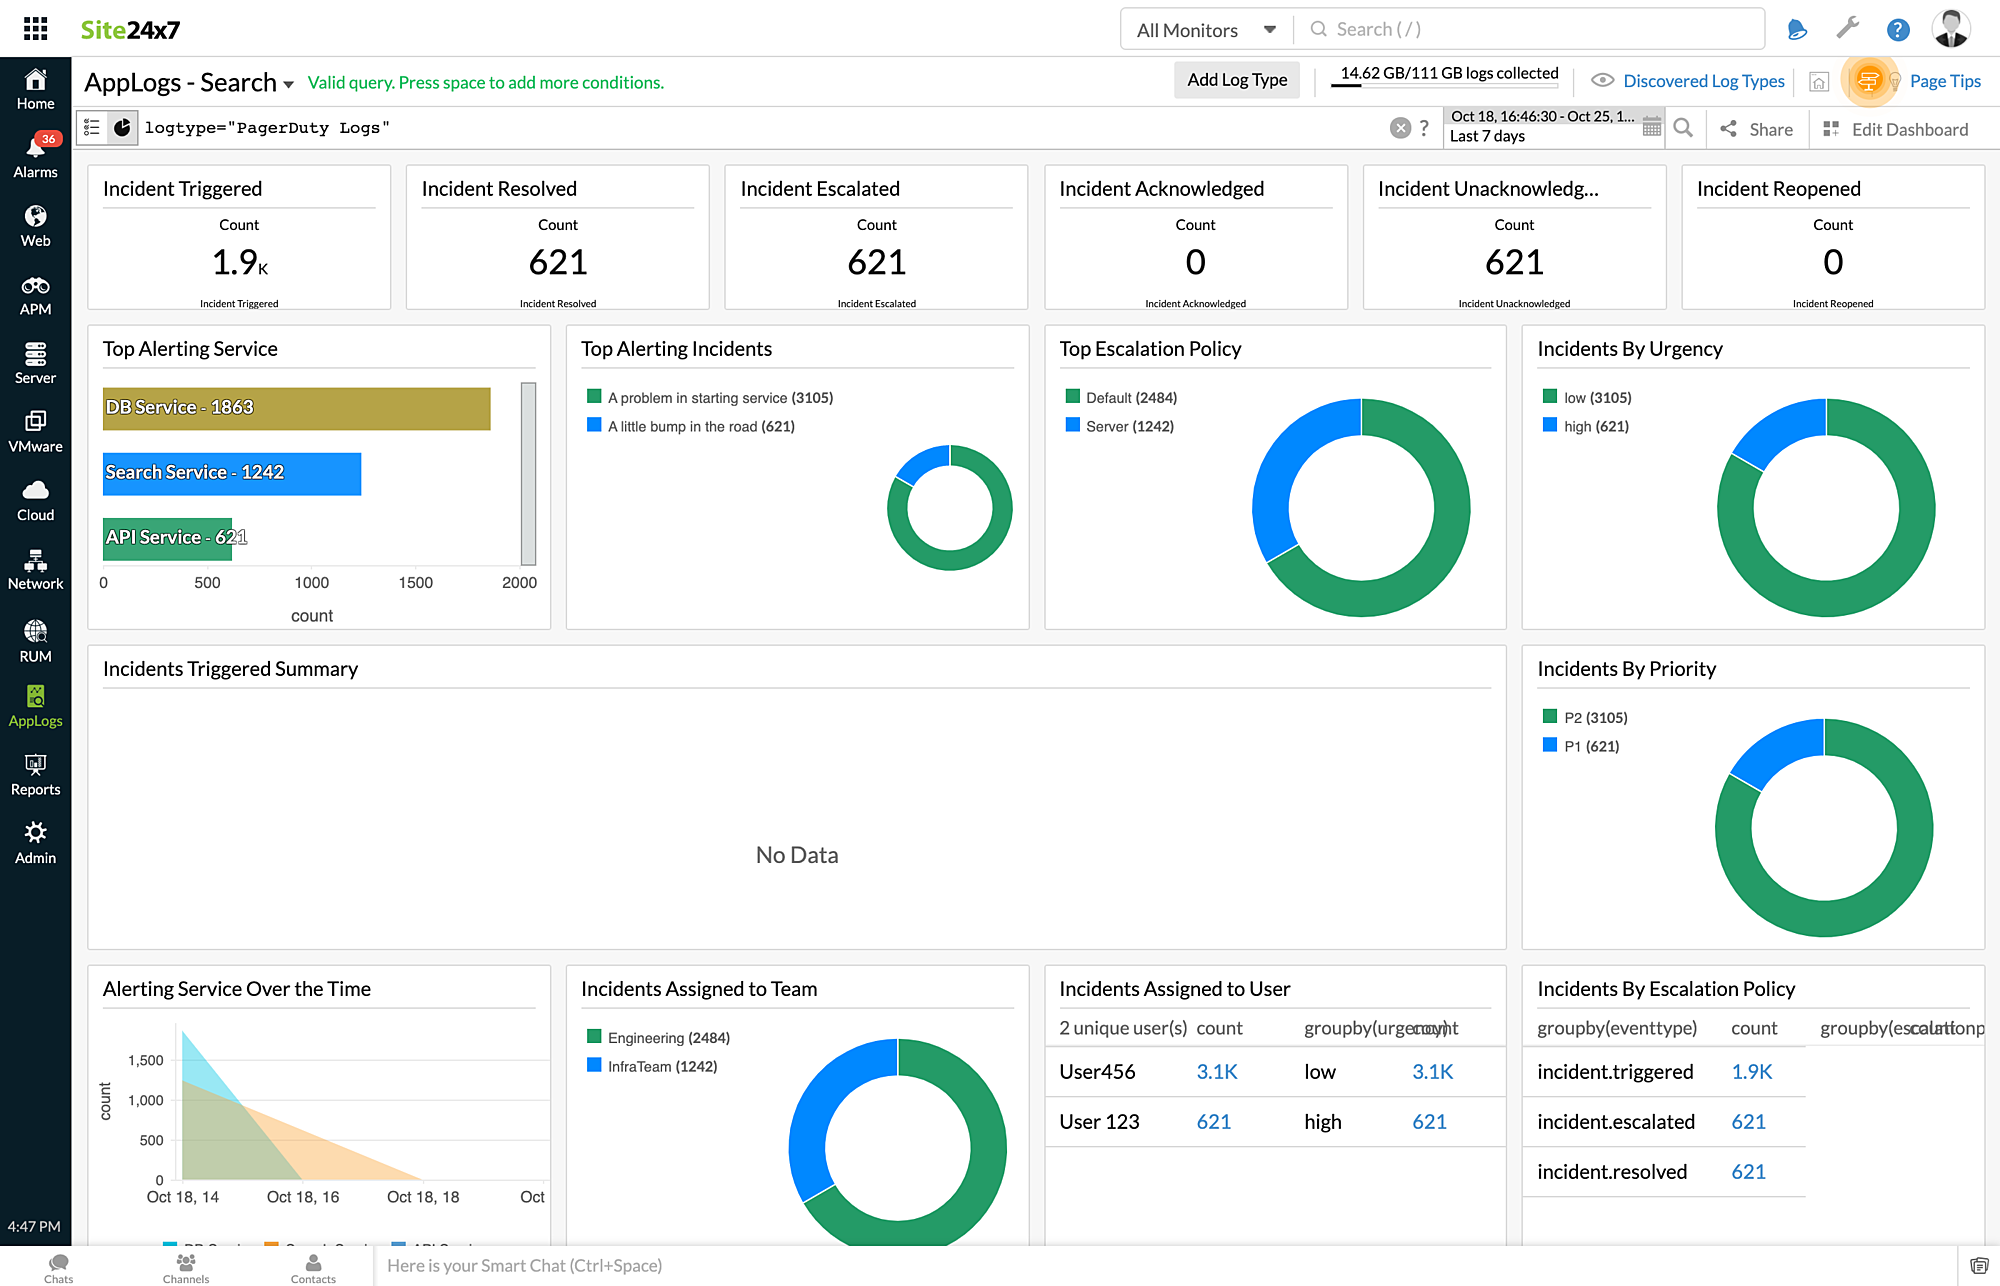
- Log in to your Site24x7 account > AppLogs.
- Enter PagerDuty Logs as the Log Type.
- The following metrics can be viewed for PagerDuty logs:
- Incident Triggered
- Incident Resolved
- Incident Escalated
- Incident Acknowledged
- Incident Unacknowledged
- Incident Reopened
- Top Alerting Service
- Top Alerting Incidents
- Top Escalation Policy
- Incidents By Urgency
- Incidents Triggered Summary
- Incidents By Priority
- Alerting Service Over the Time
- Incidents Assigned to Team
- Incidents Assigned to User
- Incidents By Escalation Policy

