Kiwi SysLogs
Kiwi Syslog Server allows you to log all syslog messages to disks, files, and databases compliant with Open Database Connectivity. It supports centralized, effective monitoring of syslog messages, SNMP, and Windows event logs. Site24x7 AppLogs has built-in support to collect logs from Kiwi Syslogs.
Getting started
1. Log in to your Site24x7 account.
2. Download and install the Site24x7 Server Monitoring Agent (Windows | Linux).
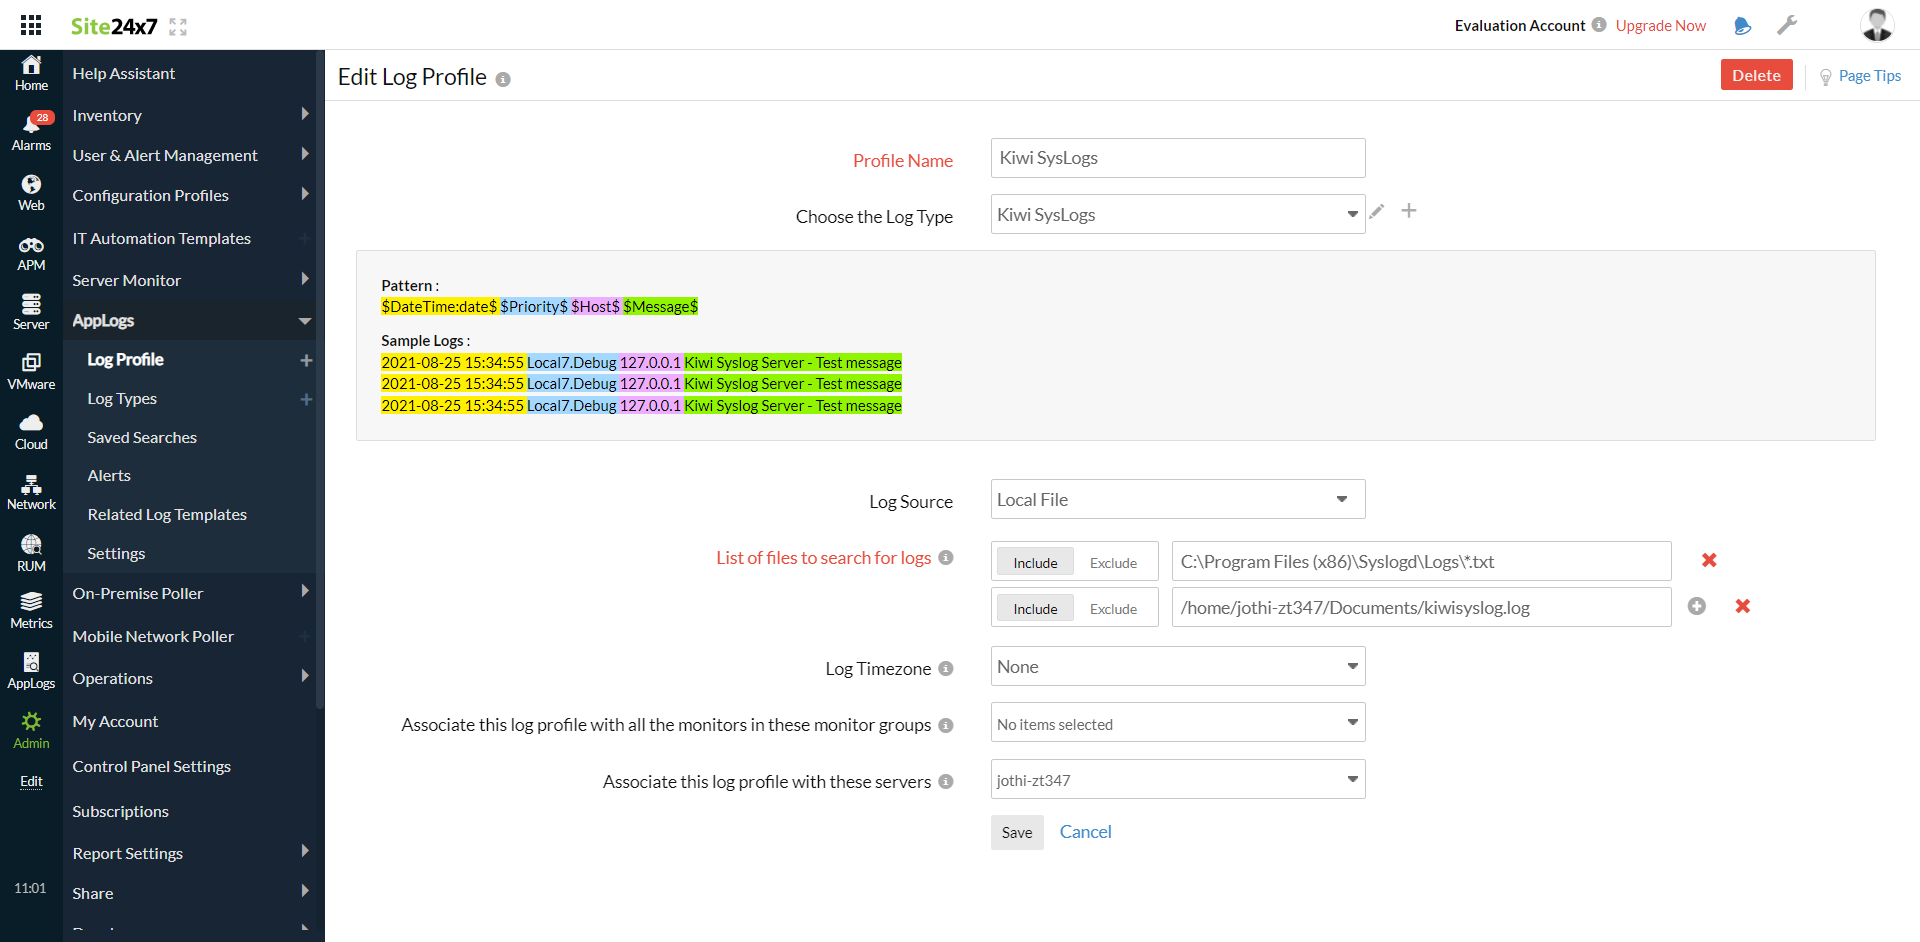
3. Go to Admin > AppLogs > Log Profile and select Add Log Profile.
4. Enter the Profile Name.
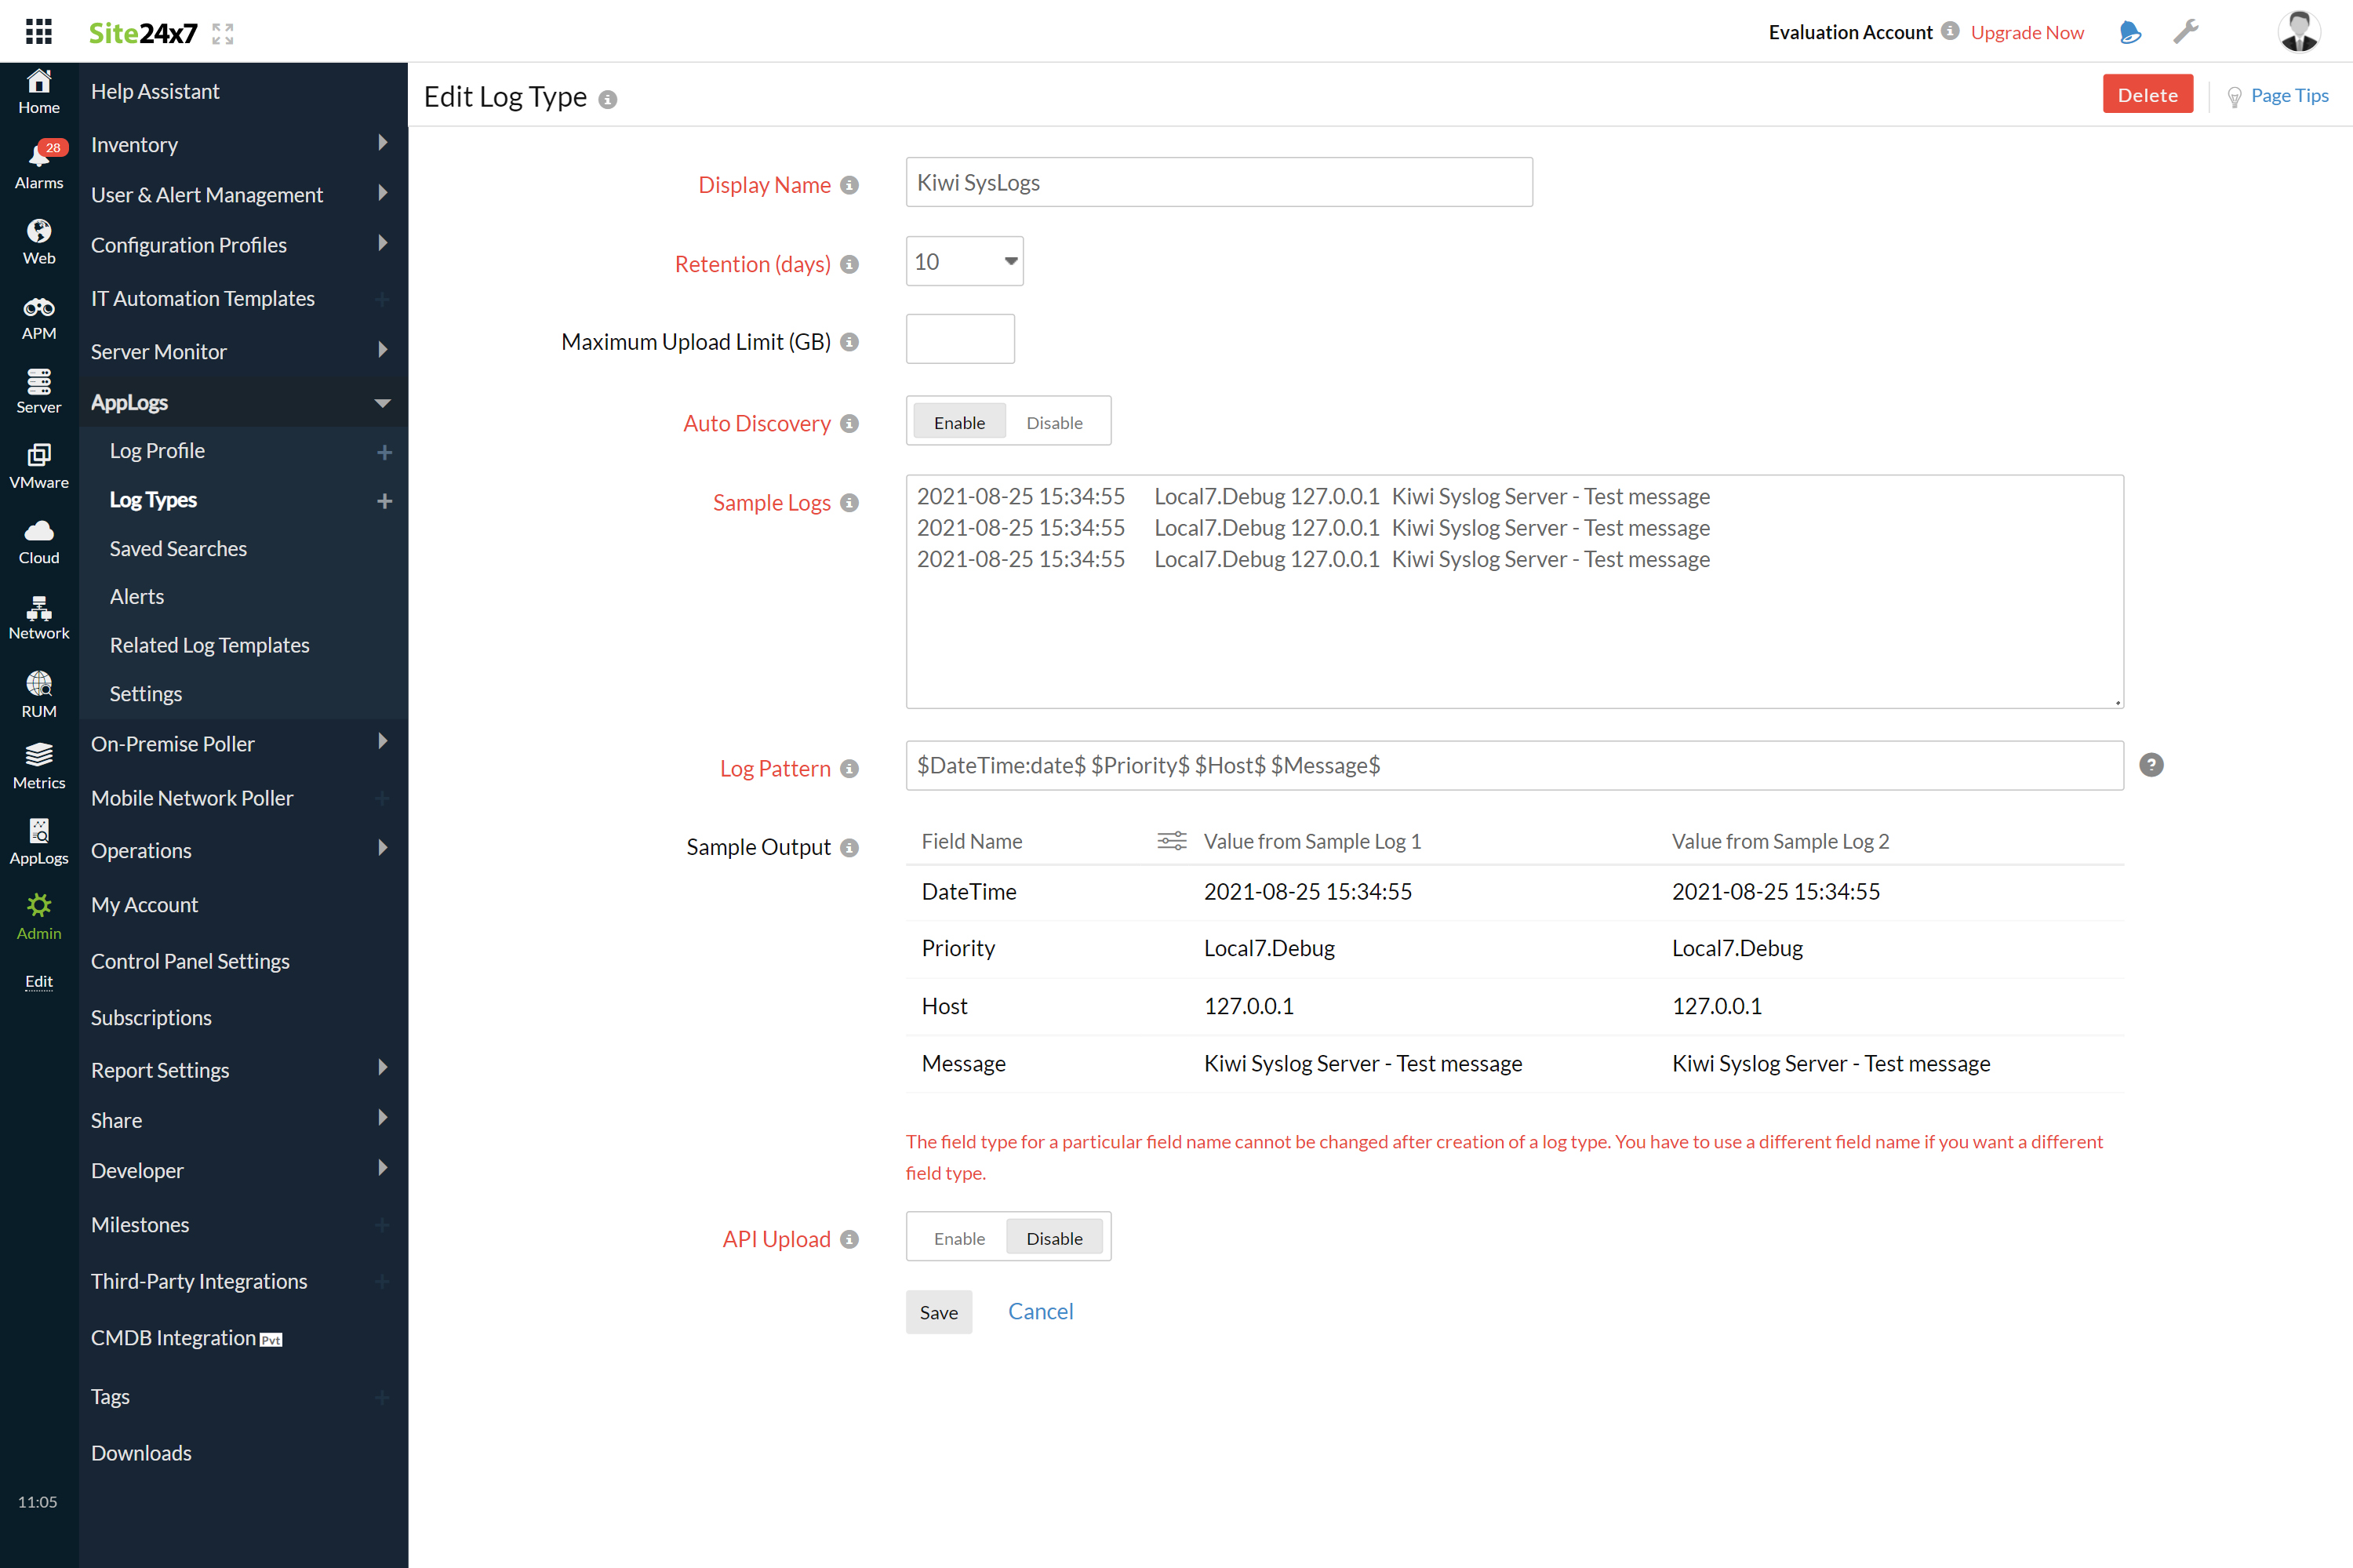
5. From the Choose the Log Type drop-down, select Kiwi SysLogs.
- The Sample Logs and Log Pattern are displayed below.
Sample Logs:
2021-08-25 15:34:55 Local7.Debug 127.0.0.1 Kiwi Syslog Server - Test message
These logs are separated into fields, each of which takes its respective value and is then uploaded to Site24x7. - By default, this is the Log Pattern identified by AppLogs for Kiwi Syslogs:
$DateTime:date$ $Priority$ $Host$ $Message$ - You can add a custom Log Pattern instead of the default one. To do so, click the pencil icon and specify your pattern.

6. From the Log Source drop-down, select Local File.
7. By default, the path below is used as the file source:
Linux: "C:\\Program Files (x86)\\Syslogd\\Logs\\*.txt"
- If your source path is different from the default path, specify it in the List of files to search for logs field.
8. Select either monitors or monitor groups to collect the logs.

9. Click Save.
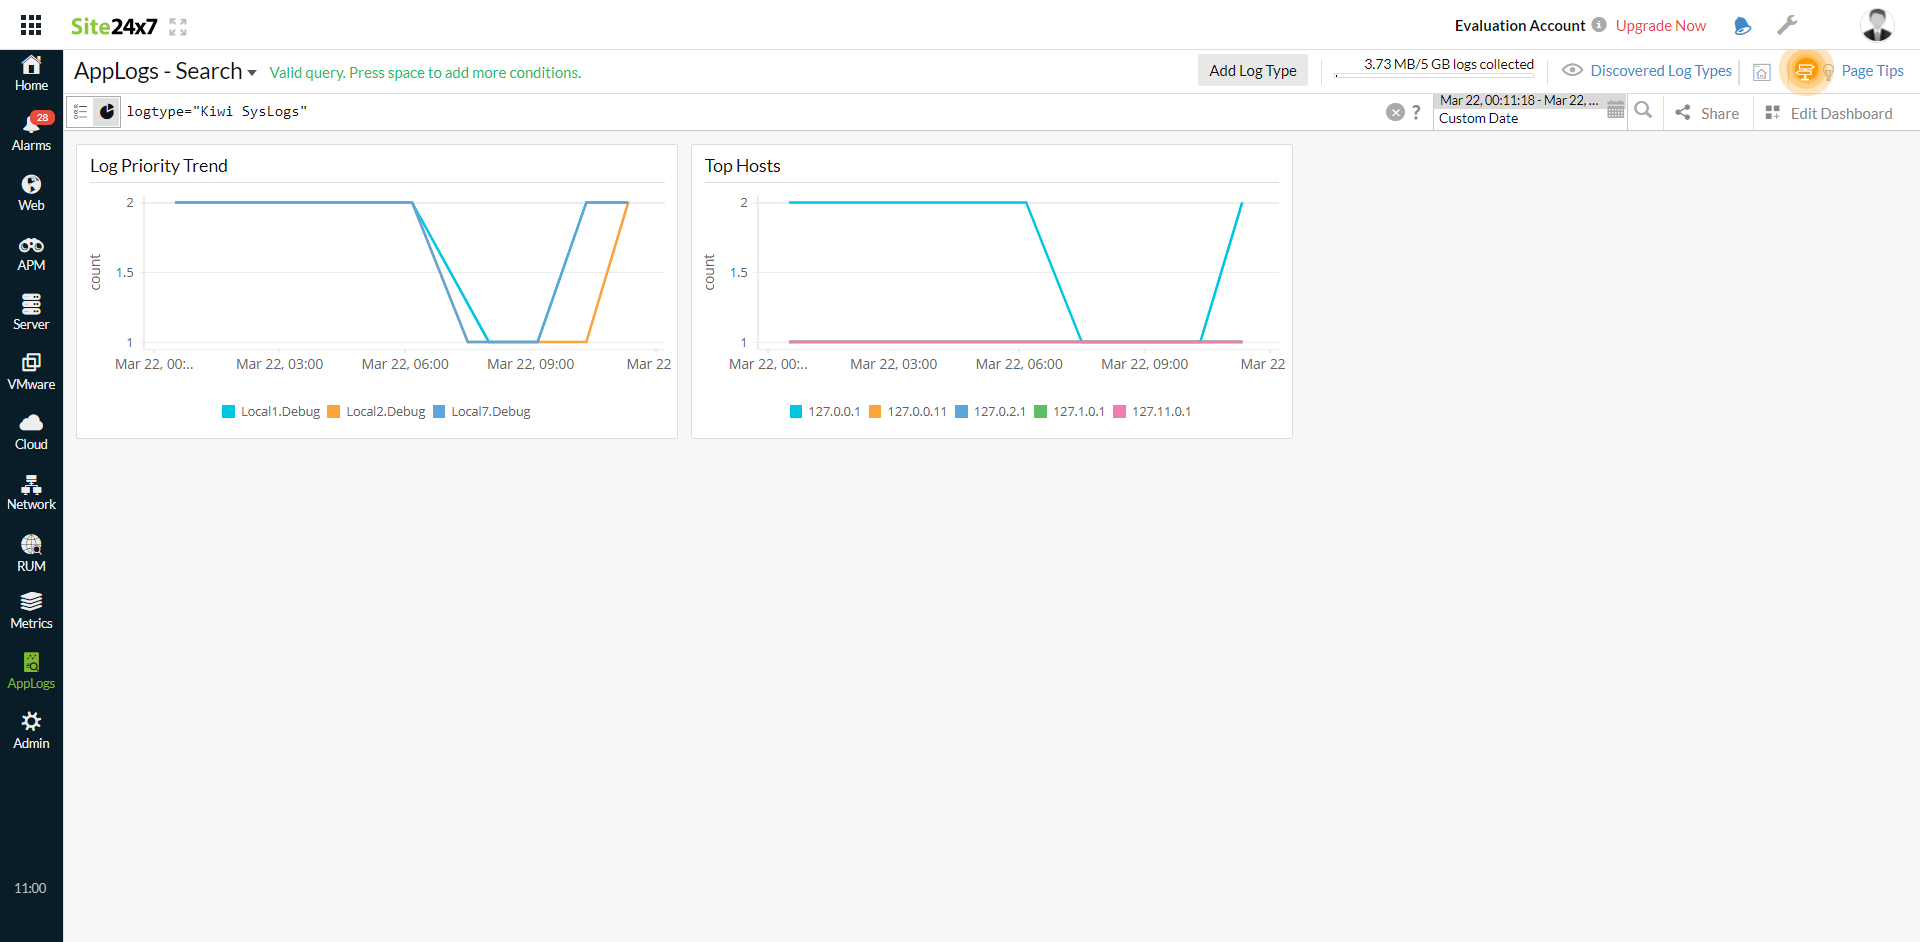
Dashboard
AppLogs creates an exclusive dashboard for every log type and shows a few widgets by default. Here's a list of the widgets available on the Kiwi Syslogs dashboard:
- Log Priority Trend
- Top Hosts
