Monitor details
Site24x7 web client home screen offers comprehensive and insightful details into various aspects of your monitoring. You can instantly gather detailed reports, identify the status of your monitors, obtain information on outages, and much more.
Click on any monitor to view further details such as Summary, Outages, Inventory, Alert Logs, and Log Report.
Time Frame widget
On the individual monitor page, click the Time Frame widget to view the status of your monitors in different time frames for monitor types.
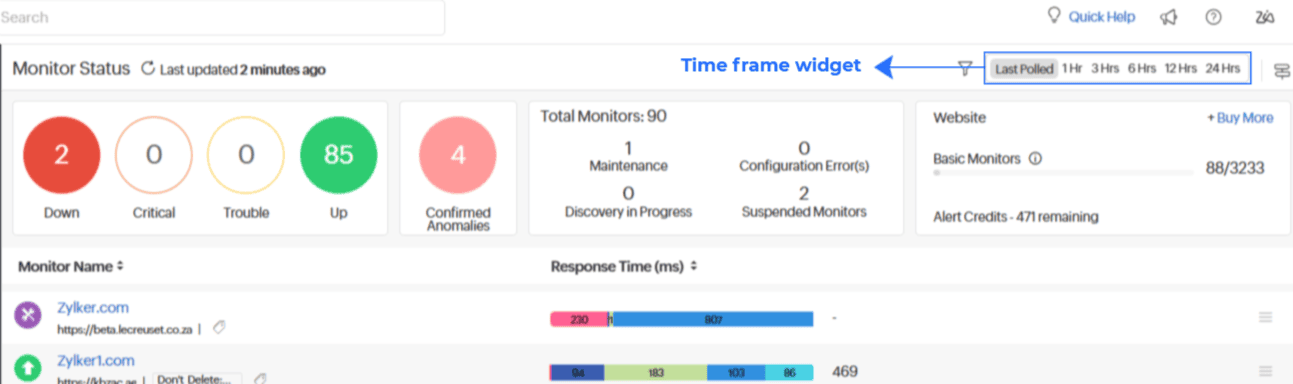
Select the desired time period from the drop-down in the top right corner to view the monitor details. To specify a time range using natural language and obtain all these details, click the Smart Time Selector ![]() icon.
icon.
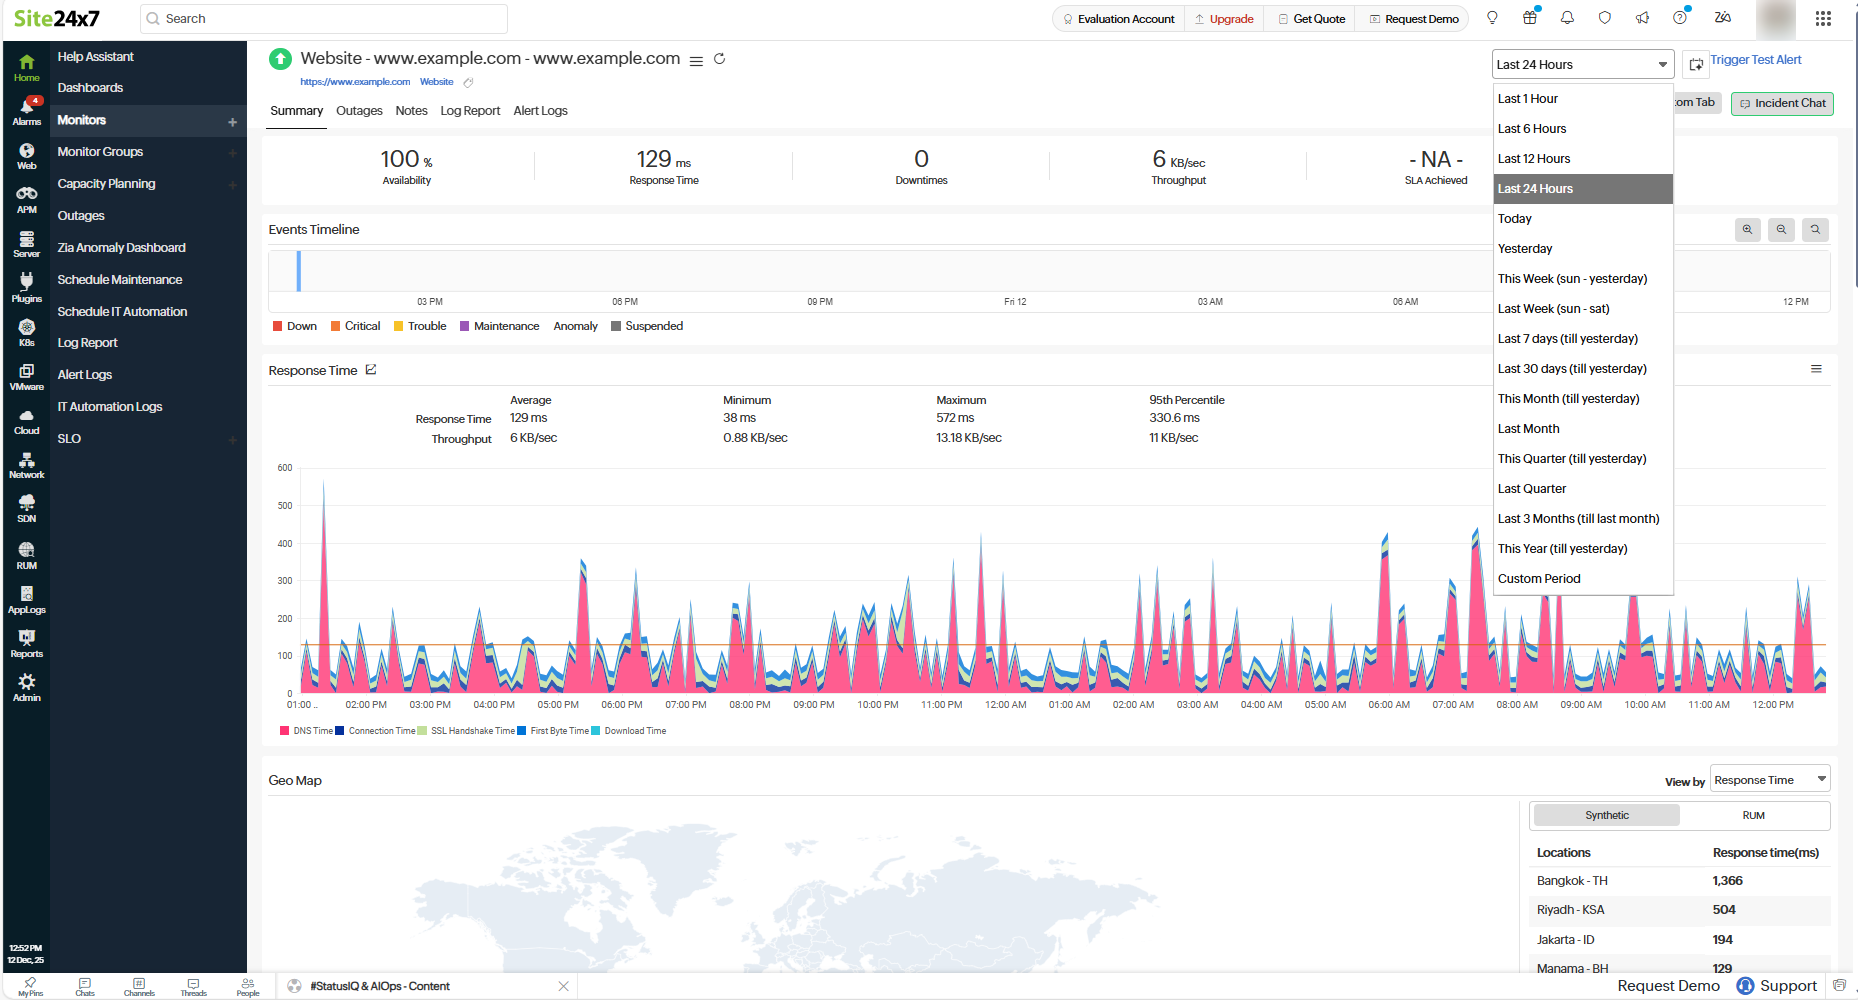
Summary
Obtain an overview of the availability and performance of your monitors with widgets like:
| Control panel options | Functionality |
| Overall Status widget | View the monitor metrics like Availability, Downtimes, SLA Achieved, and others. The available metrics differ based on the type of monitor |
| Events Timeline widget | Events timeline widget records all the past events including Down, Critical, Trouble, Maintenance, Suspended, or Anomalies status of your selected monitor for a selected time range. Each event is color coded for easy identification. Events can be drilled down to extract maximum data and facilitate easy troubleshooting. It also gives you insight into details like outage duration and the exact outage period. |
| Performance chart | Track real-time and historical trends of key metrics for a monitor, helping you quickly assess its performance over time. |
- Apart from the mentioned widgets, other widgets related to the specific monitor types can be found in the summary sections.
- A tooltip appears as a small pop-up when the user hovers over a tab or an icon. It provides more information about the feature.
Outages
The Outages tab lists all the outages that happened for the particular monitor. You can filter the outages based on the time period for analyzing.
To mark it as maintenance, follow the steps below:
- Click the hamburger
 icon, and from the drop-down select Mark as Maintenance. Select Yes in the confirmation message.
 - To change it's state back to downtime, click the hamburger icon and from the drop-down select Mark as Downtime. Select Yes in the confirmation message.
Notes
To include a description or additional context about the monitor, you can use the Notes tab. Notes keep your team informed of runbook steps, recent changes, or reference documents. To format your notes, follow the Markdown syntax.
Under the Inventory section, you can view more details about the monitor, like configuration, operation, associated monitor groups, monitoring locations, and profiles for threshold and notification settings.
The Inventory tab has been renamed to Notes, unifying inventory and contextual information such as runbooks, SOPs, references, and recent changes.
Log Reports
Gain insights into the performance and status of all monitors with the captured logs. Monitor application performance, detect anomalies, and troubleshoot issues in your monitored services with log reports.
Alert Logs
Gather an overview of all alerts generated by Site24x7 for your monitored resource with alert logs.
Related articles
-
On this page
- Time Frame widget
- Summary
- Outages
- Notes
- Log Reports
- Alert Logs
- Related articles