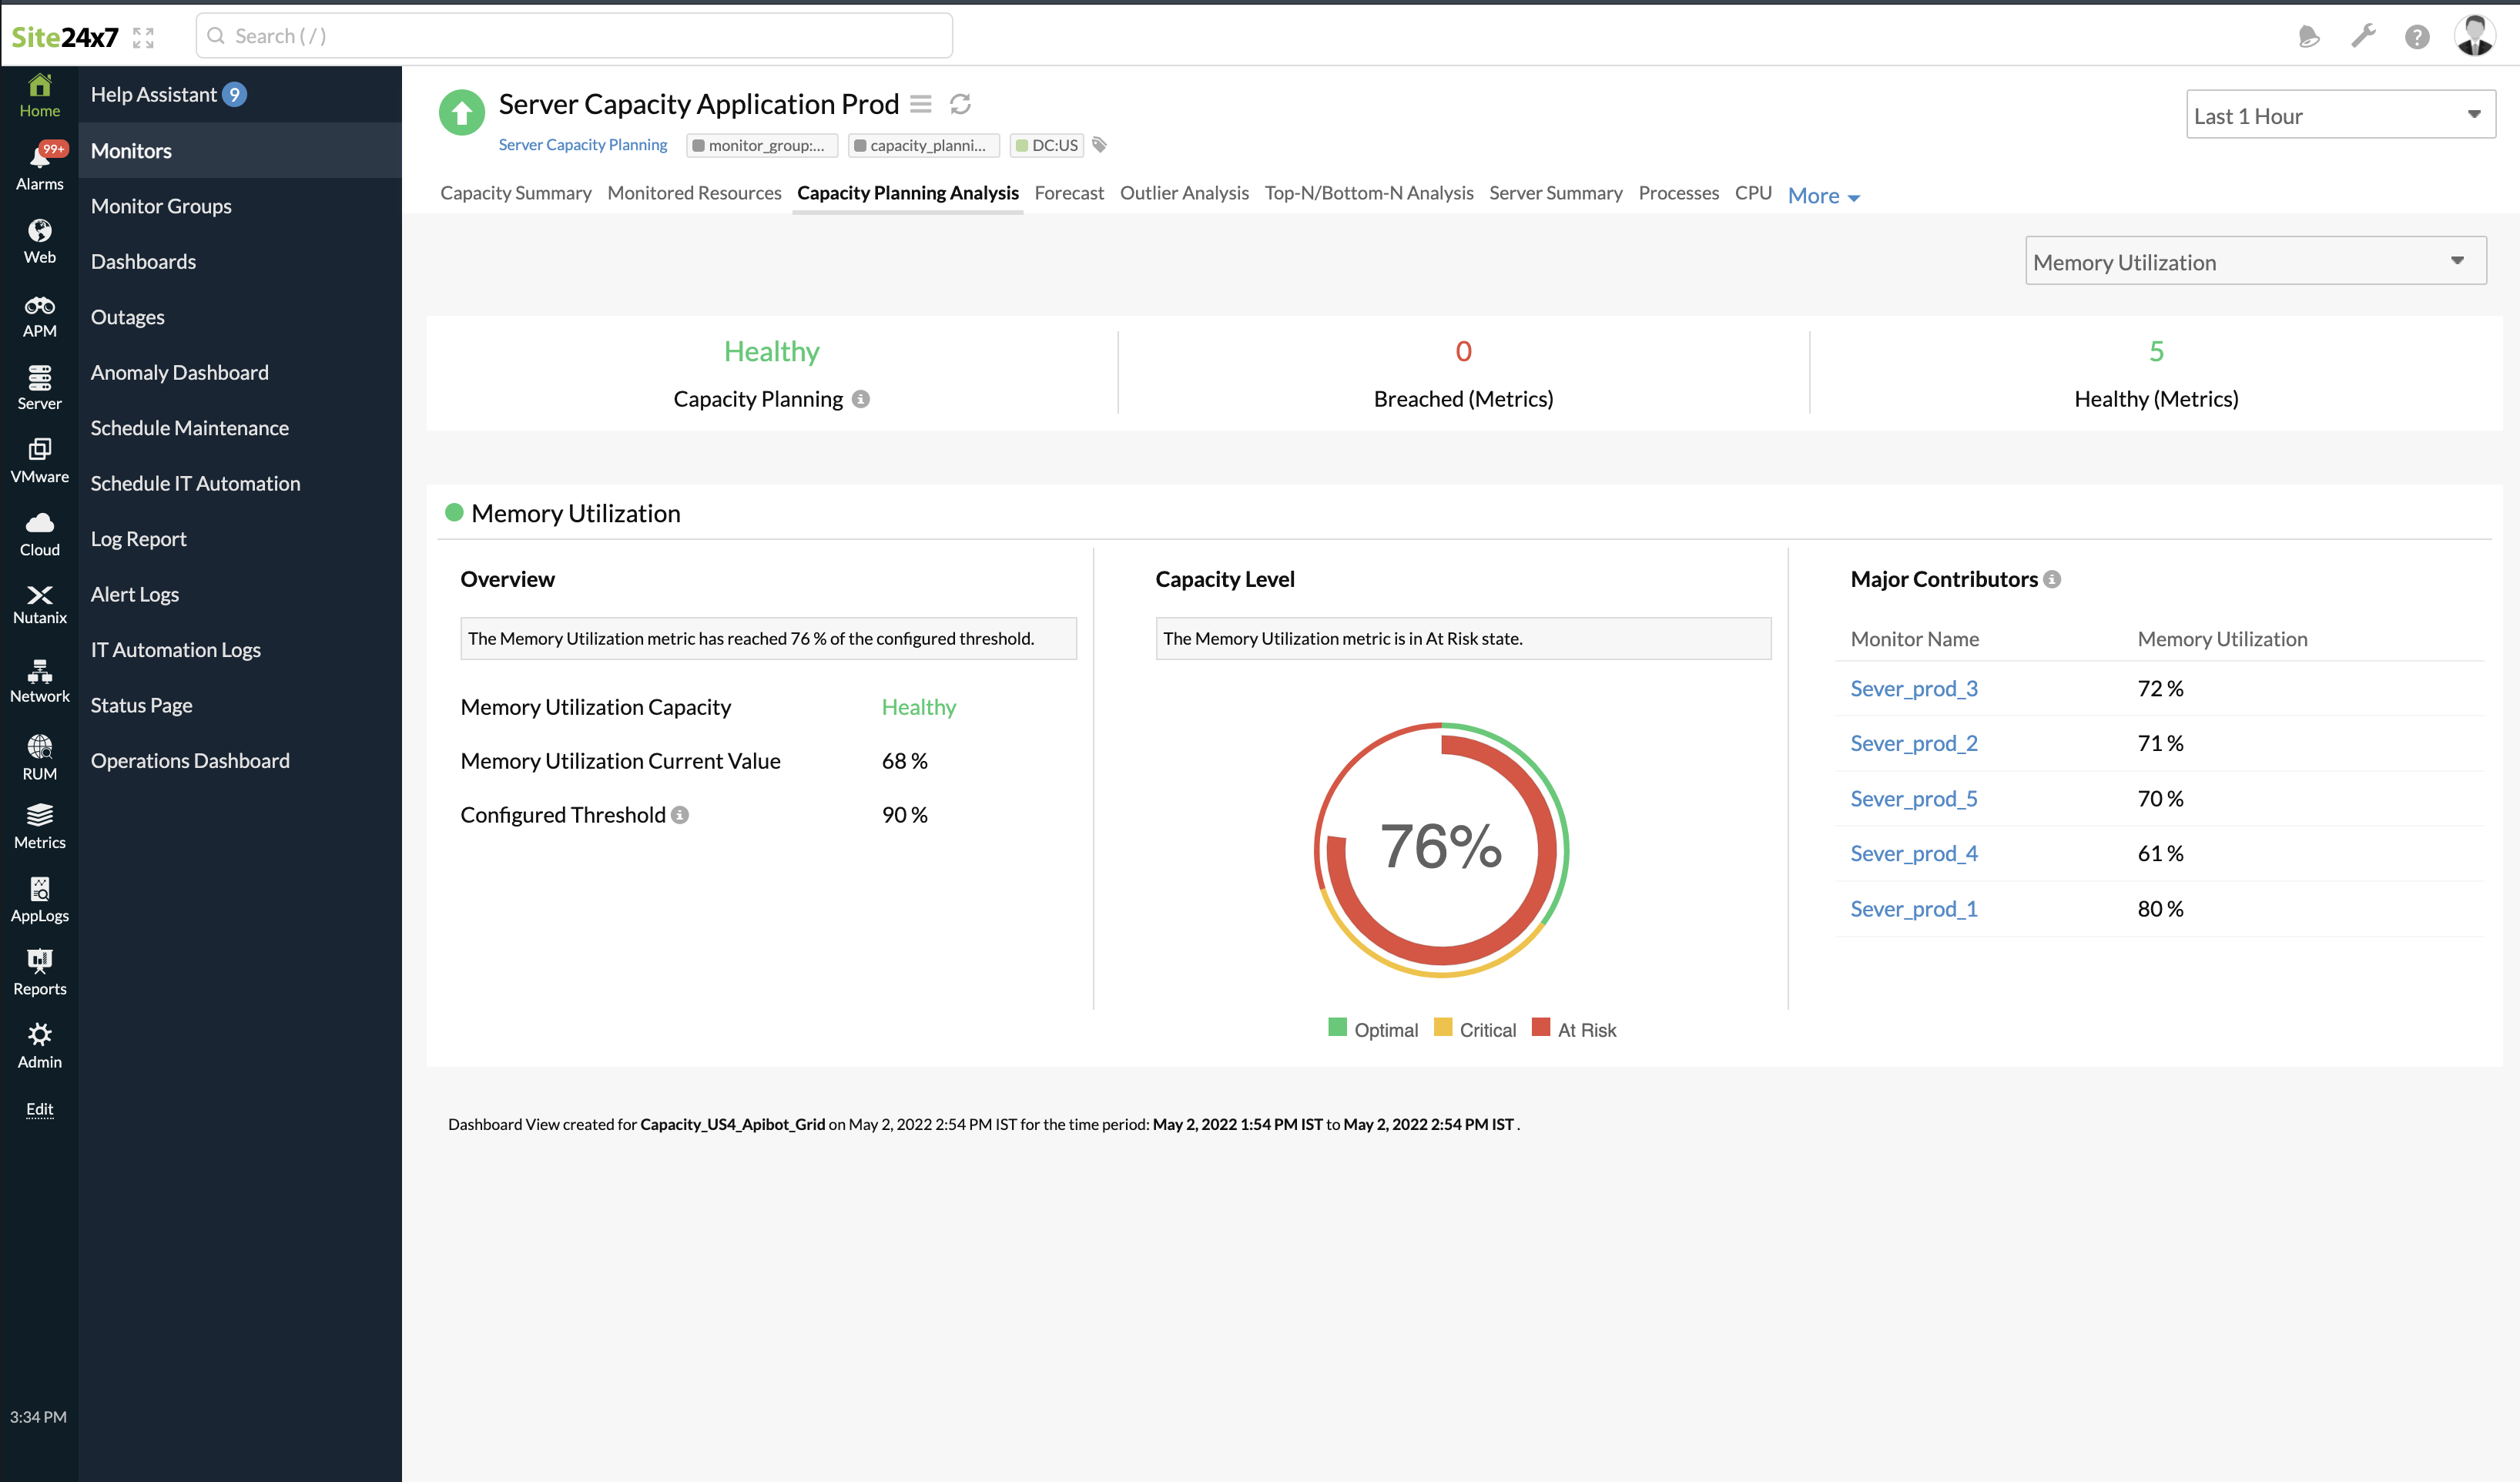
Capacity Planning Analysis for Capacity Planning Monitors
Capacity Planning Analysis provides the current health and an overview of the capacity usage metrics based on your monitor type. The health analysis is based on the performance metrics of the resource type. For instance, with an EC2 Capacity Planning monitor, the stats would include CPU Usage, Number of Bytes Received, Number of Bytes Sent, CPU Credit Balance, and Burst Balance.
You can also choose performance metrics with custom values for the health analysis, and configure threshold metrics.
Use case
Consider that for Server Capacity Planning, the Capacity Level of Memory Utilization is At Risk. You can check whether the performance value of Memory Utilization is under control or not and track the top servers contributing to this high utilization. By clicking that particular server, you will be redirected to that monitor summary page, where you can check the time-based memory utilization chart to verify the state of your resources.
Why Capacity Planning Analysis?
Capacity Planning Analysis allows you to:
- Get an overall status of your Capacity Planning monitor based on the Capacity Planning configuration provided in the Threshold Profile.
- Get the health status, performance value, Capacity Level, and Major Contributors of an attribute in a single view.
- View the number of metrics that have been breached and are healthy.
- Choose the required metric in the drop-down menu and get a filtered view.
Capacity Planning Analysis configuration
The Capacity Planning Analysis configuration determines the health of the Capacity Planning monitors. You can configure the capacity planning for your resource in the Home > Monitor Groups > Capacity Planning monitor > Edit > Capacity Planning Threshold > Capacity Planning Configuration section.
You can also choose the performance metrics with custom values to determine the health analysis.
Capacity level analysis for different metrics
You can obtain the status overview, capacity level, and the monitor that contributes to the capacity for every metric with capacity level analysis.
Overview
For every metric at the resource level, you can obtain an overview of the status, capacity level, and the monitor that contributes to the capacity in the Overview grid. You can use the drop-down menu in the top-right corner to choose and view all metrics or selected metrics.
For instance, if you choose the metric Number of Bytes Received, you can view if the capacity level is healthy, the current value, the threshold assigned, and the percentage difference.

Capacity Level
Capacity Level is the percentage of the current value to reach the threshold value. For example, in Memory Utilization Attribute, the current value is 68%, and the assigned threshold is 90%. Their Capacity Level is 76%, which means the current value reached 76% of the assigned threshold.
The following table defines severity based on the capacity level:
| Capacity Level (%) | Severity |
| 0-35 | Optimal |
| 36-70 | Critical |
| 71-100 | At Risk |
Major Contributors
The Major Contributors section lists all the monitors that contribute to the capacity level along with the value. It helps you understand which monitor or instance uses up the maximum capacity in a particular Capacity Planning monitor group and how much they contribute. If you click a monitor, you will be redirected to that monitor's summary page.
Capacity Planning Analysis Report
The Capacity Planning Analysis report lets you generate and share a scheduled summary of your capacity planning insights. It is based on the data available in the Capacity Planning Analysis tab and includes key metrics such as resource utilization trends, projected growth, and potential capacity risks.
Instead of manually reviewing the analysis view, you can configure a report to be sent at regular intervals to selected alerting groups. This helps teams stay updated on infrastructure capacity without needing to log in to the console each time.
The report is useful for tracking how resources are being used over time and understanding when capacity limits may be reached. With visibility into future usage patterns, teams can plan scaling activities, optimize resource allocation, and avoid performance issues caused by resource exhaustion.
By receiving these reports regularly, operations and engineering teams can ensure consistent monitoring of capacity trends, make timely decisions, and maintain optimal infrastructure performance across monitored environments.
