Azure Virtual Machines Monitoring Integration
Azure Virtual Machines (VMs) is one of the several types of on-demand, scalable computing resources that Azure offers. An Azure VM gives you the flexibility of virtualization without having to buy and maintain the physical hardware that runs it. However, you still need to maintain the VM by performing tasks, such as configuring, patching, and installing the software that runs on it.
With Site24x7's integration, you can now monitor your VM metrics, configure thresholds, and receive alerts about critical issues.
Setup and configuration
Adding Azure VMs while configuring a new Azure monitor
If you haven't configured an Azure monitor yet, add one by using the following steps:
- Log in to your Site24x7 account.
- Choose Cloud from the left navigation pane, and select Azure > Add Azure Monitor. You can also follow these steps to add an Azure monitor.
- During Azure monitor configuration, in the Edit Azure Monitor page, select Azure Virtual Machine from the Service/Resource Types drop-down.
Adding an Azure VM to an existing Azure monitor
If you already have an Azure monitor configured for the tenant, you can add the Azure VM using the following steps:
- Log in to your Site24x7 account.
- Navigate to the Infrastructure Dashboard, Inventory Dashboard, or Management Actions from the left navigation pane of the Azure monitor for which you wish to add an Azure VM.
- Click the ham icon and select the Edit option, which will bring you to the Edit Azure Monitor page.
- In the Edit Azure Monitor page, select the corresponding Subscription and the Resource Group from the drop-down menu, select Azure Virtual Machine from the Service/Resource Types drop-down, and click Save.
After successful configuration, go to Cloud > Azure, select Azure Virtual Machine from the Azure monitor drop-down. Now you can view the discovered VMs.
It will take around 15-30 minutes to discover new Azure resources. For the immediate discovery of the selected configuration, go to the Infrastructure Dashboard of the Azure monitor and click the Discover Nowoption from the ham icon.
Polling frequency
Site24x7's Azure VM monitor collects metric data every minute and the statuses from your applications every five minutes.
Supported metrics
The following metrics are collected:
| Metric name | Description | Statistic | Unit |
|---|---|---|---|
| CPU Credits Consumed | Total number of credits consumed by the VM. Only available on B-series burstable VMs | Average | Count |
| CPU Credits Remaining | Total number of credits available to burst. Only available on B-series burstable VMs | Average | Count |
| Disk Read Bytes | Bytes read from the disk during the monitoring period | Average | Bytes |
| Disk Read Operations/Sec | Disk input operations per second (IOPS) | Average | Count per second |
| Disk Write Bytes | Bytes written to the disk during the monitoring period | Average | Bytes |
| Disk Write Operations/Sec | Disk write IOPS | Average | Count per second |
| Inbound Flows | The number of current flows in the inbound direction (traffic going into the VM) | Average | Count |
| Network In | The number of billable bytes received on all network interfaces by the VM(s) | Average | Bytes |
| Network Out | The number of outbound billable bytes on all network interfaces by VMs (deprecated) | Average | Bytes |
| OS Disk Queue Depth | OS disk queue depth (or queue length) | Average | Count |
| OS Disk Read Bytes/sec | Bytes per second read from a single disk during the monitoring period for an OS disk | Average | Count per second |
| OS Disk Read Operations/Sec | Read IOPS from a single disk during the monitoring period for an OS disk | Average | Count per second |
| OS Disk Write Bytes/sec | Bytes per second written to a single disk during the monitoring period for an OS disk | Average | Count per second |
| OS Disk Write Operations/Sec | Write IOPS from a single disk during the monitoring period for an OS disk | Average | Count per second |
| Outbound Flows | The number of current outbound flows (traffic going out of the VM) | Average | Count |
| Data Disk Queue Depth | Data disk queue depth (or queue length) | Average | Count |
| Data Disk Read Bytes/sec | Bytes per second read from a single disk during the monitoring period | Average | Count per second |
| Data Disk Read Operations/Sec | Read IOPS from a single disk during the monitoring period | Average | Count per second |
| Data Disk Write Bytes/sec | Bytes per second written to a single disk during the monitoring period | Average | Count per second |
| Data Disk Write Operations/Sec | Write IOPS from a single disk during the monitoring period | Average | Count per second |
| Percentage CPU | The percentage of allocated compute units that are currently in use by the VM(s) | Average | Percent |
| Temp Disk Read Bytes/Sec | The average rate at which data is read from the temporary disk attached to the virtual machine. Useful for tracking temporary storage read throughput. | Average | Bytes |
| Temp Disk Write Bytes/Sec | The average rate at which data is written to the temporary disk. Helps assess the write activity and performance of temporary storage. | Average | Bytes |
| Temp Disk Read Operations/Sec | The average number of read operations per second on the temporary disk. Indicates read IOPS usage for temp storage. | Average | Count per second |
| Temp Disk Write Operations/Sec | The average number of write operations per second on the temporary disk. Helps monitor write IOPS performance for temp storage. | Average | Count per second |
| Temp Disk Queue Depth | The average number of both read and write requests queued on the temporary disk. A high value may indicate storage bottlenecks. | Average | Milliseconds |
| Temp Disk Latency (Preview) | The average time taken to service I/O requests on the temporary disk. Useful for identifying delays in temp disk performance. | Average | Milliseconds |
| Data Disk Latency (Preview) | The average latency experienced by data disks on the VM. Higher latency may impact application performance and responsiveness. | Average | Milliseconds |
| OS Disk Latency (Preview) | The average latency for I/O operations on the operating system disk. Helps in diagnosing performance issues related to boot and system processes. | Average | Milliseconds |
Server Monitoring Extension
With the Server Monitoring Extension installed, you can get system-level metrics and other features, including over 100 plugin integrations, IT Automation, detailed Root Cause Analysis reports, event log and syslog monitoring, and more.
The Contributor Role is required to install the Server Monitor Extension from the Site24x7 portal.
Installation methods
Method 1
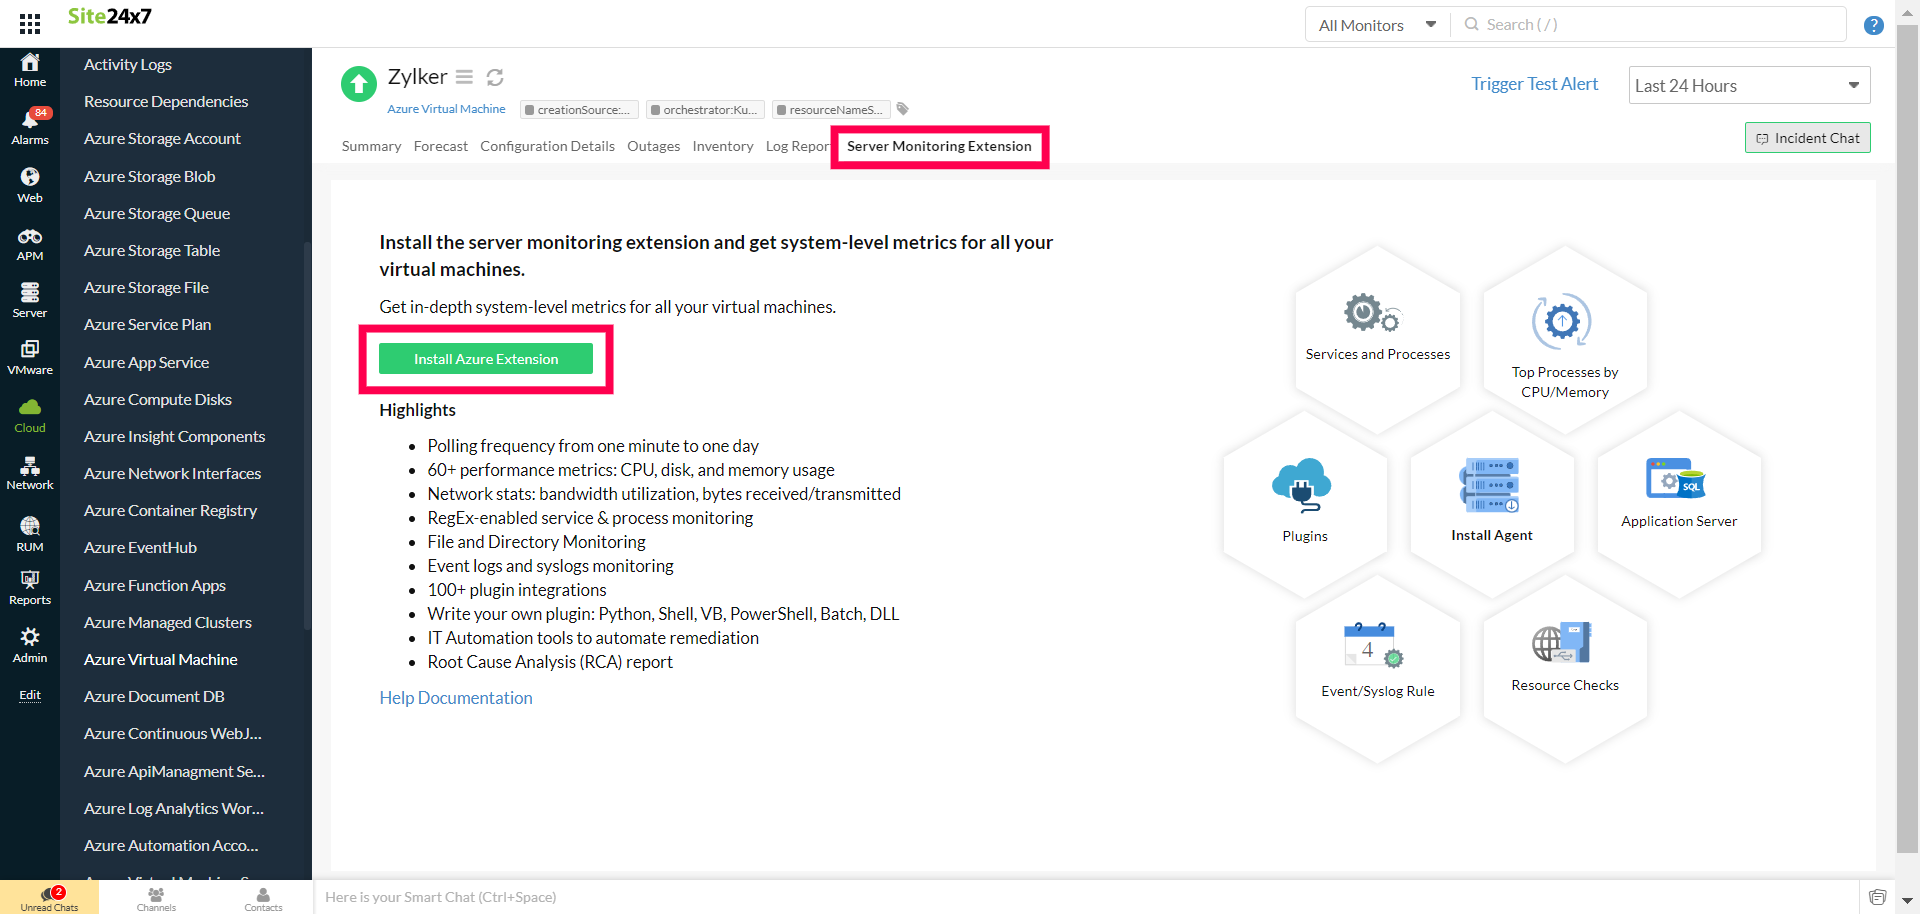
- Go to Cloud > Azure.
- Select Azure Virtual Machine from the Azure drop-down, and click the required VM.
- Select the Server Monitoring Extension tab and click Install Azure Extension.
Method 2
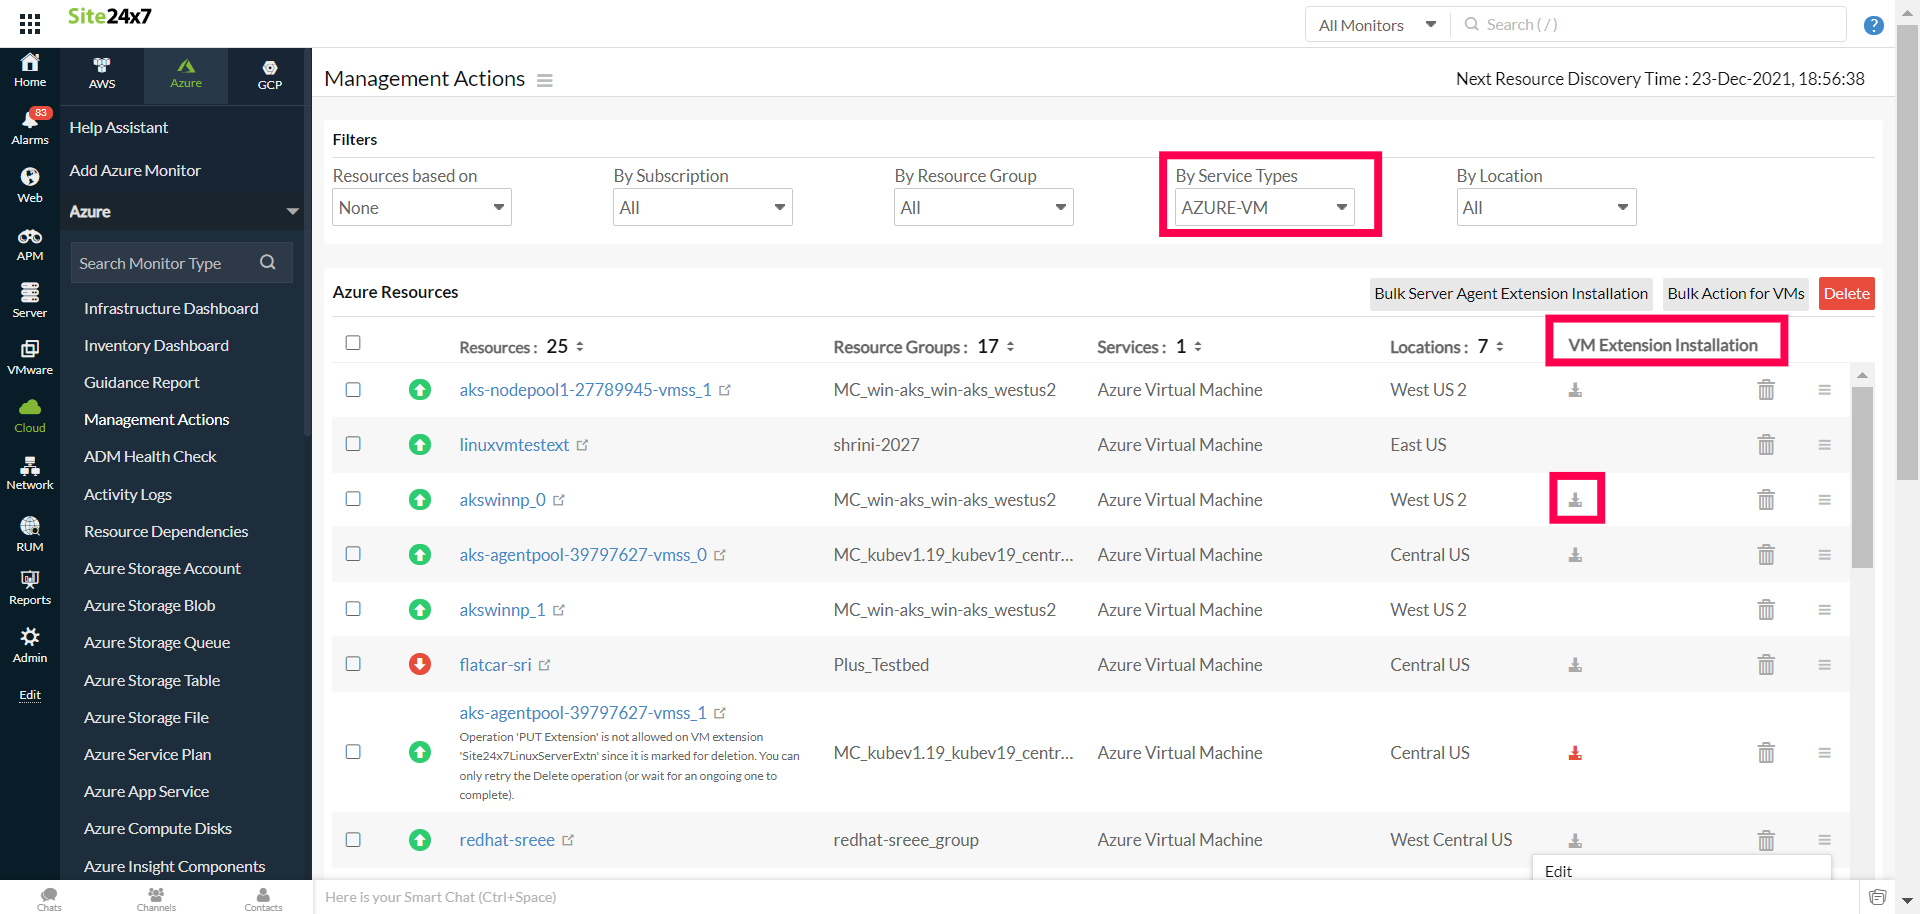
- Go to Cloud > Azure and click the Azure monitor and select the Management Actions tab from the drop-down.
- On the Management Actions page, select AZURE-VM from the By Service Types drop-down.
- Click on the install icon in the VM Extension Installation column to install the extension.
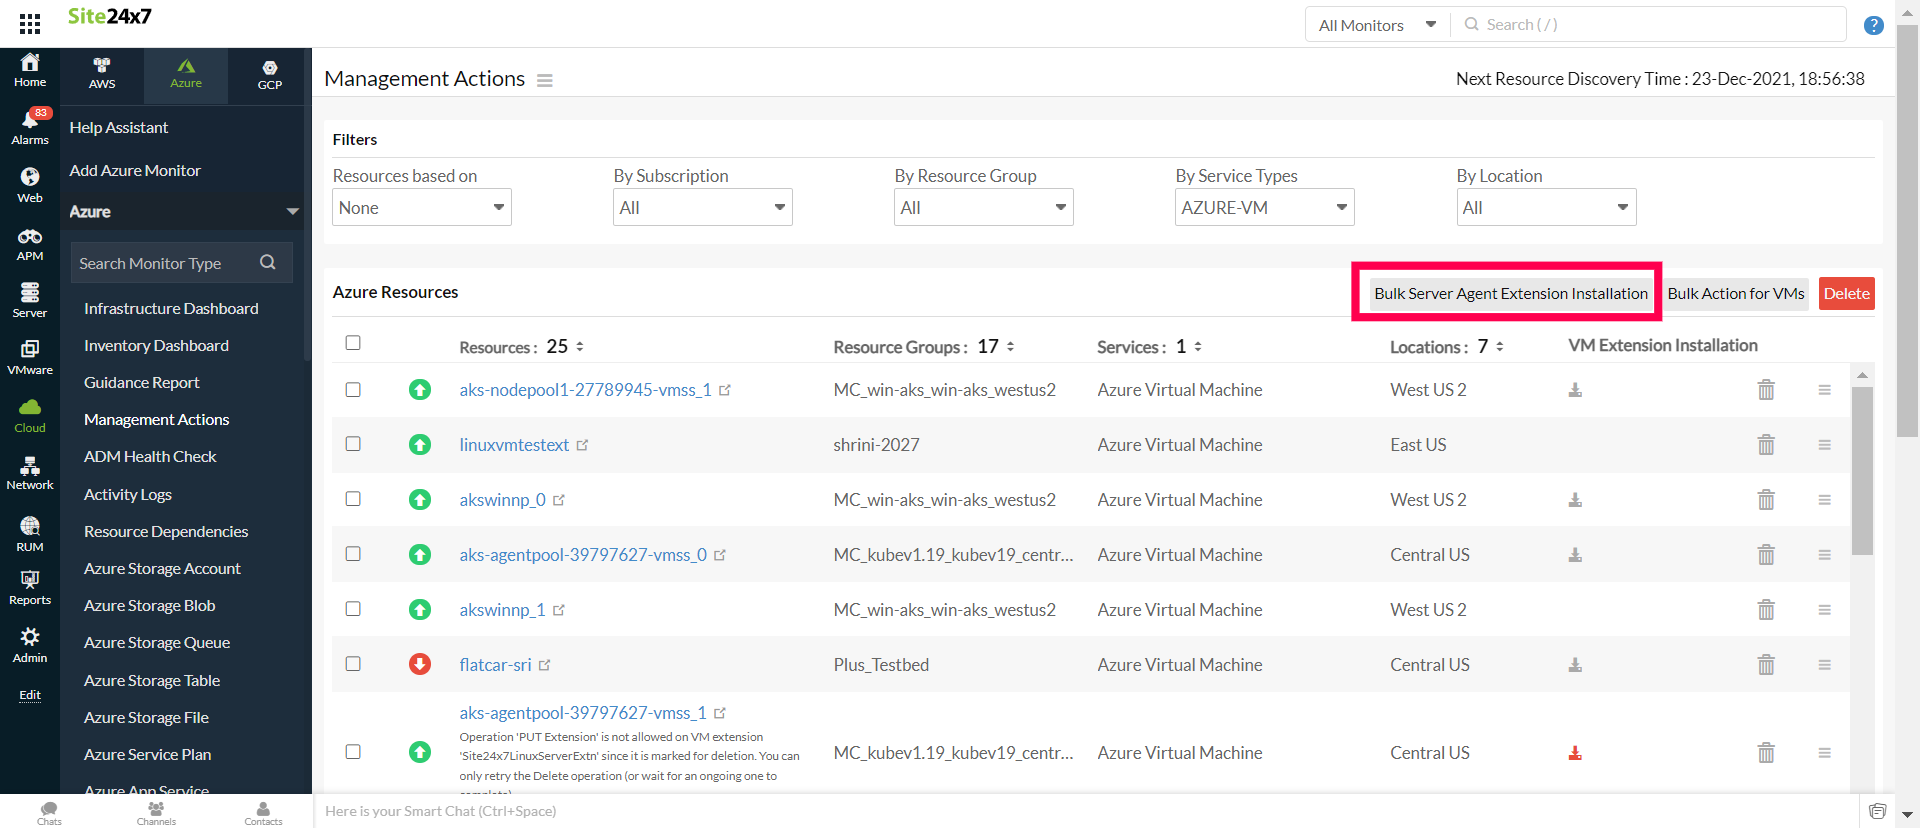
For bulk installation, click Bulk Server Agent Extension Installation.
Method 3
- Go to Cloud > Azure.
- Navigate to the Infrastructure Dashboard, Inventory Dashboard, or Management Actions from the left navigation pane of the Azure monitor.
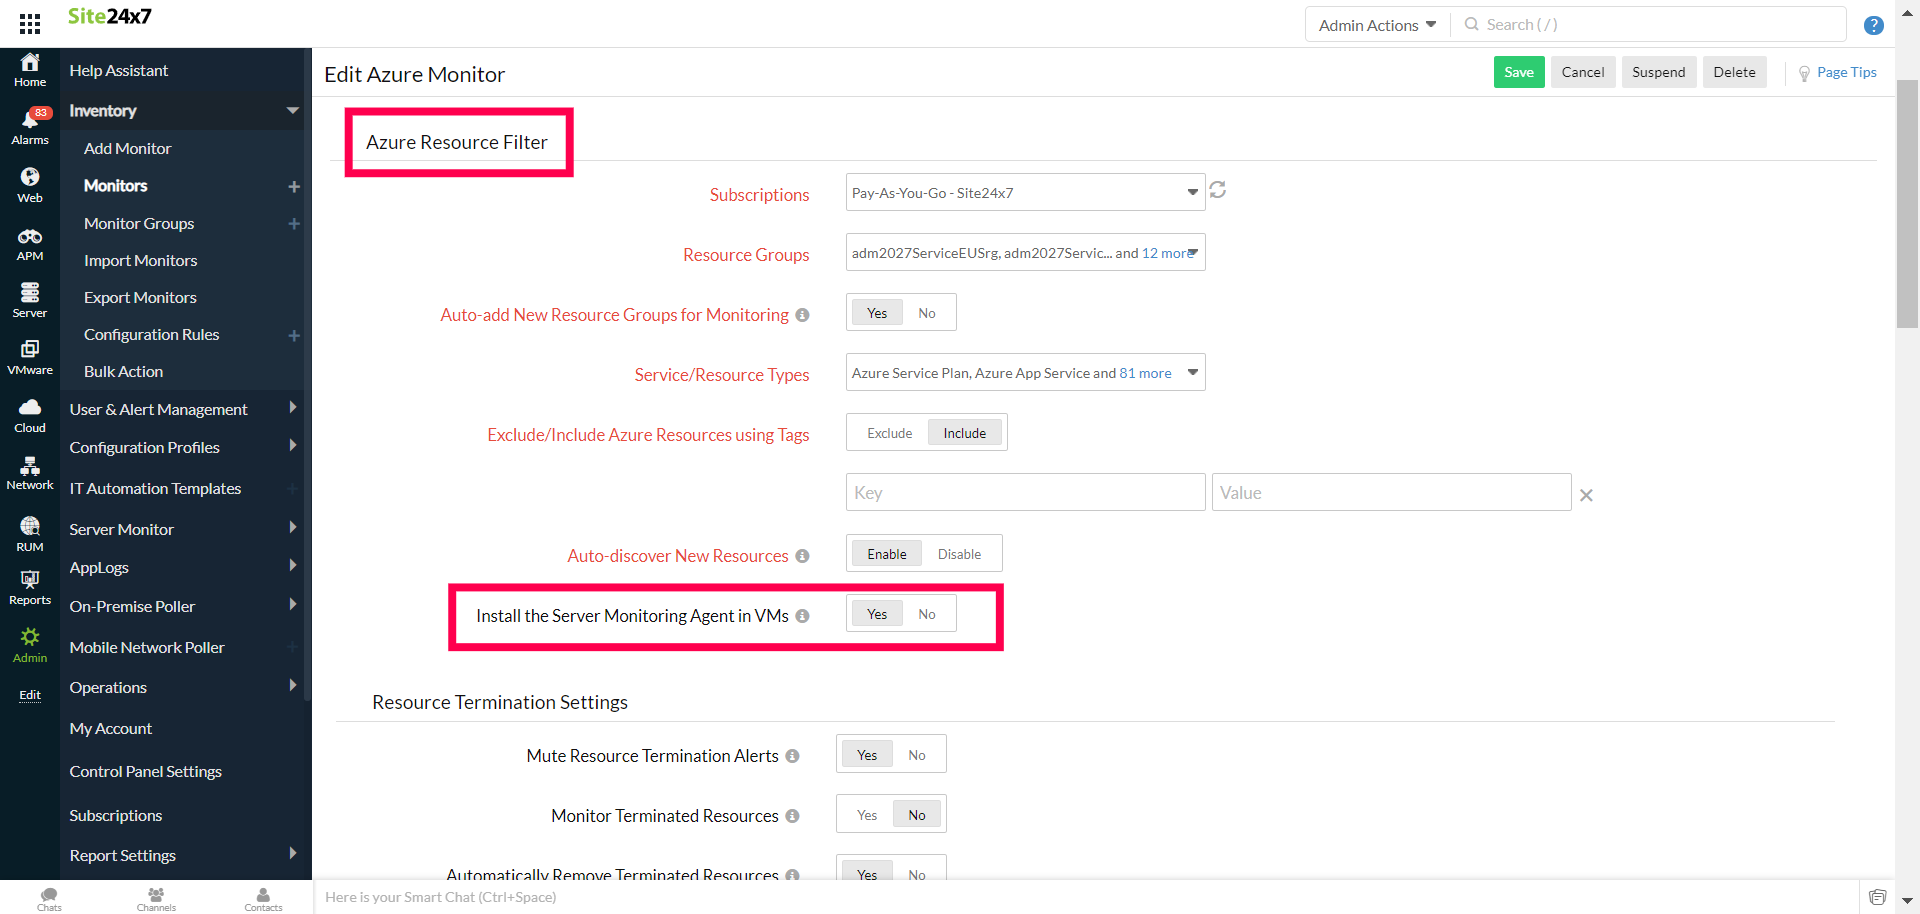
- Click the ham icon and then the Edit option, which will bring you to the Edit Azure Monitor page.
- Select Yes next to Install the Server Monitoring Agent in VMs under the Azure Resource Filter section.
- Click Save to save your settings. By doing this, the VM extension will be installed automatically during resource discovery.
You can also install the Server Monitor Agent Extension for Windows or Linux from the Azure portal.
After successful installation, you can view the server agent metrics from Azure VMs.
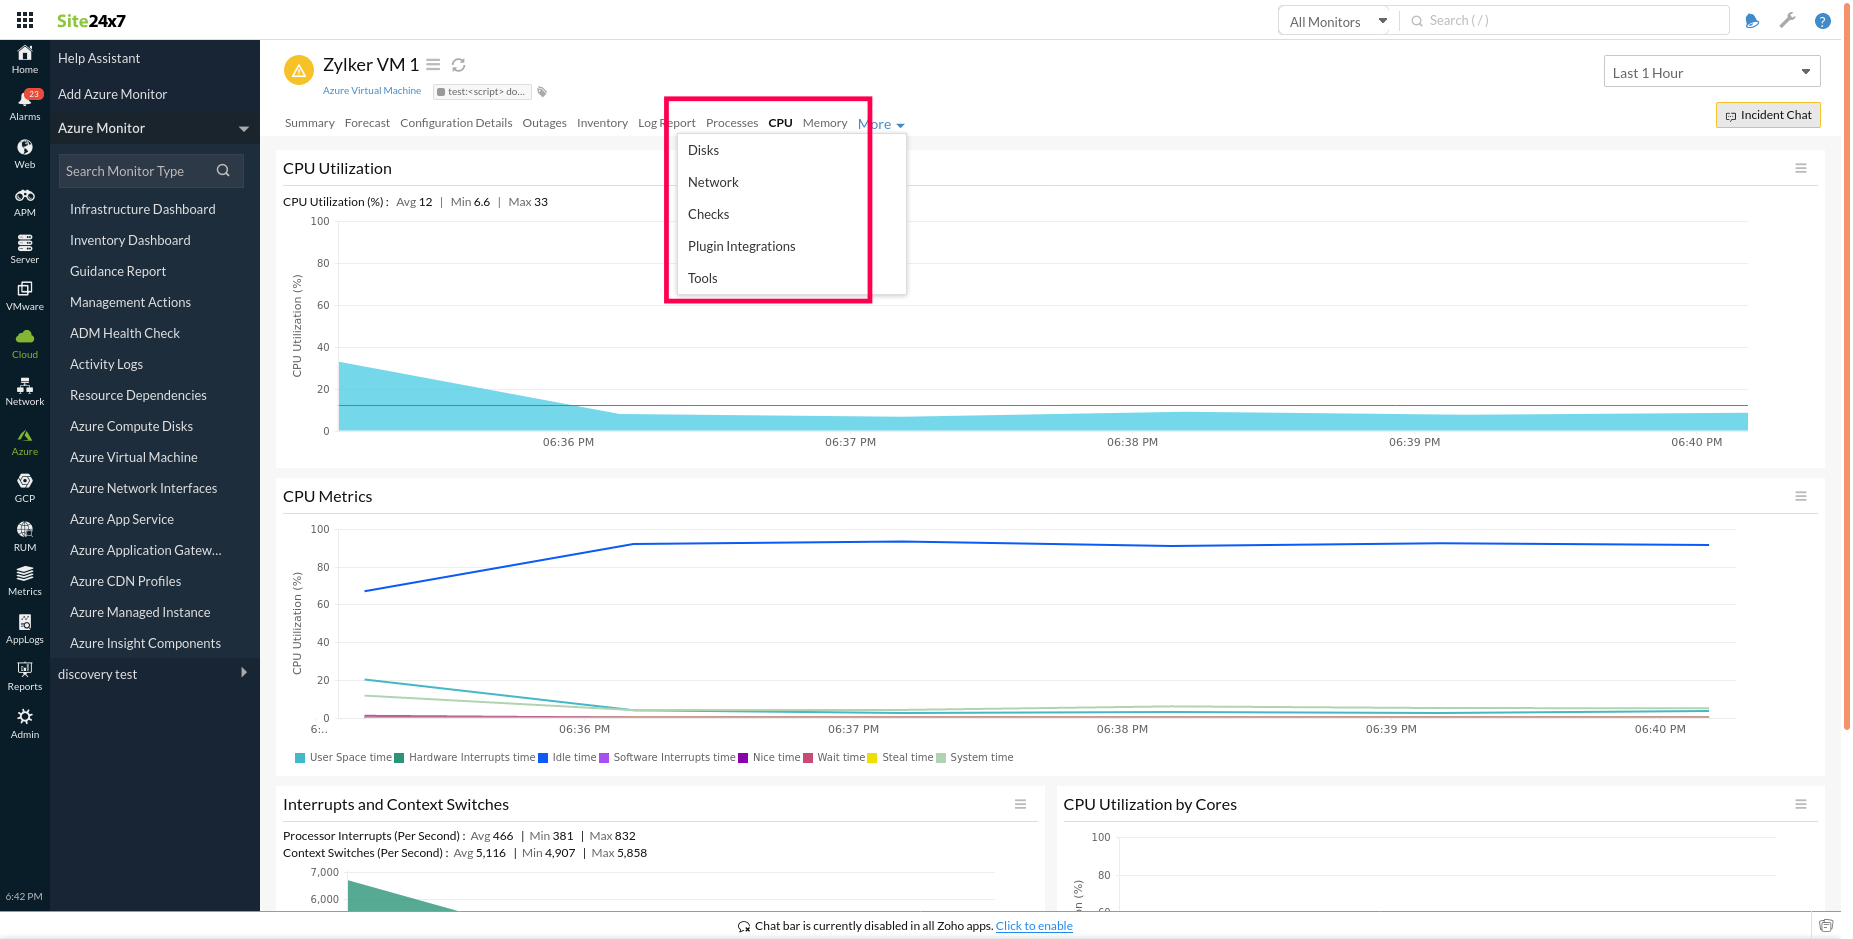
Here is an exhaustive list of metrics collected by the Site24x7 server monitoring agent.
If the Upgrade Policy of the VM scale set in the Azure portal is set to Automatic, the VM extension will be applied to all instances under the scale set, irrespective of the instance chosen in Site24x7.
Azure Uptime monitoring
Site24x7’s Azure Uptime monitoring enables proactive tracking of your Azure resources’ availability and uptime, along with their configuration and inventory details. Note that uptime monitoring will disable performance metric data collection.
Threshold configuration
Global configuration
- Go to the Admin section on the left navigation pane.
- Select Configuration Profiles from the left pane and choose the Threshold and Availability (+) tab from the drop-down menu.
- Choose the monitor type as Azure Virtual Machine.
You can also set the threshold values for all the metrics mentioned above.
Monitor-level configuration
- Go to Cloud > Azure and select Azure Virtual Machine from the drop-down menu.
- Choose a resource for which you would like to set a threshold and then click the ham icon on the top.
- Choose the Edit option, which directs you to the Edit Azure Virtual Machine page.
You can set the threshold values for the metrics by selecting the Threshold and Availability option. You can also configure IT Automation at the attribute level.
Alert Suppression Configuration
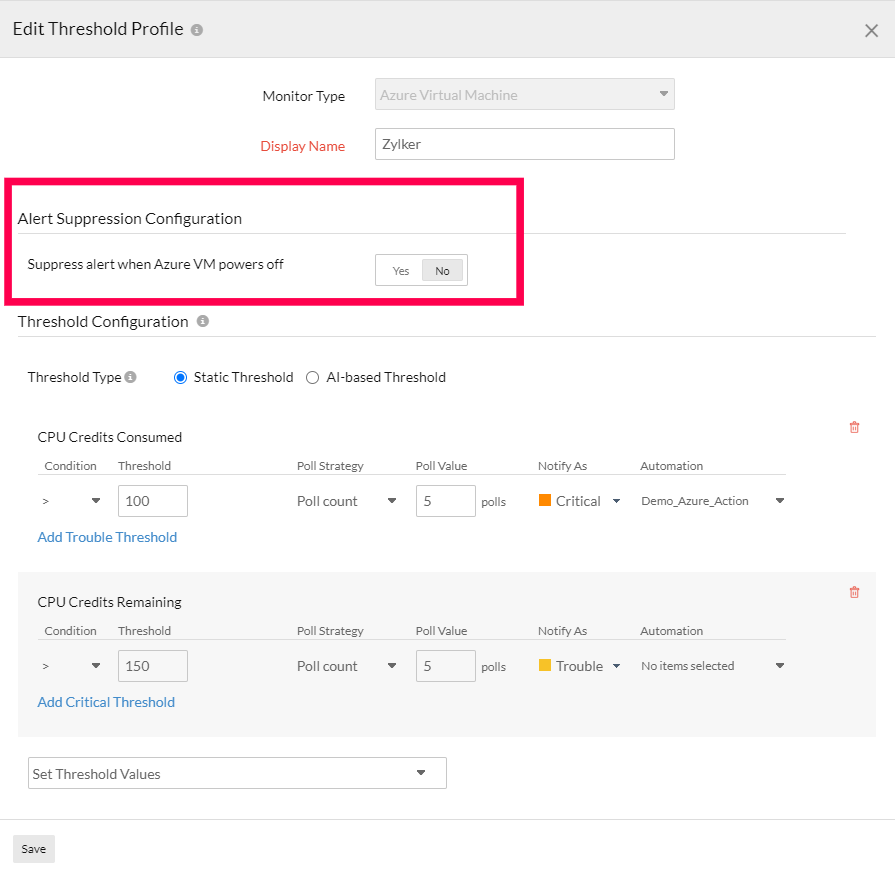
You can suppress the alerts when you don't want to receive the alert emails during manual power off or during maintenance situations. In this case, you can set the Suppress alert when the VM power offs option from the Add/Edit Threshold Profile page. This will only suppress the alerts and VM availability will still remain affected.
IT Automation
You can add automations for Azure VMs. VMs have exclusive automation types, like starting a VM, stopping a VM, or installing an agent in the VM.
- Log in to your Site24x7 account.
- Go to Admin > IT Automation Templates (+) > Add Automation Templates. Once automations are added, you can schedule them to be executed one after the other.
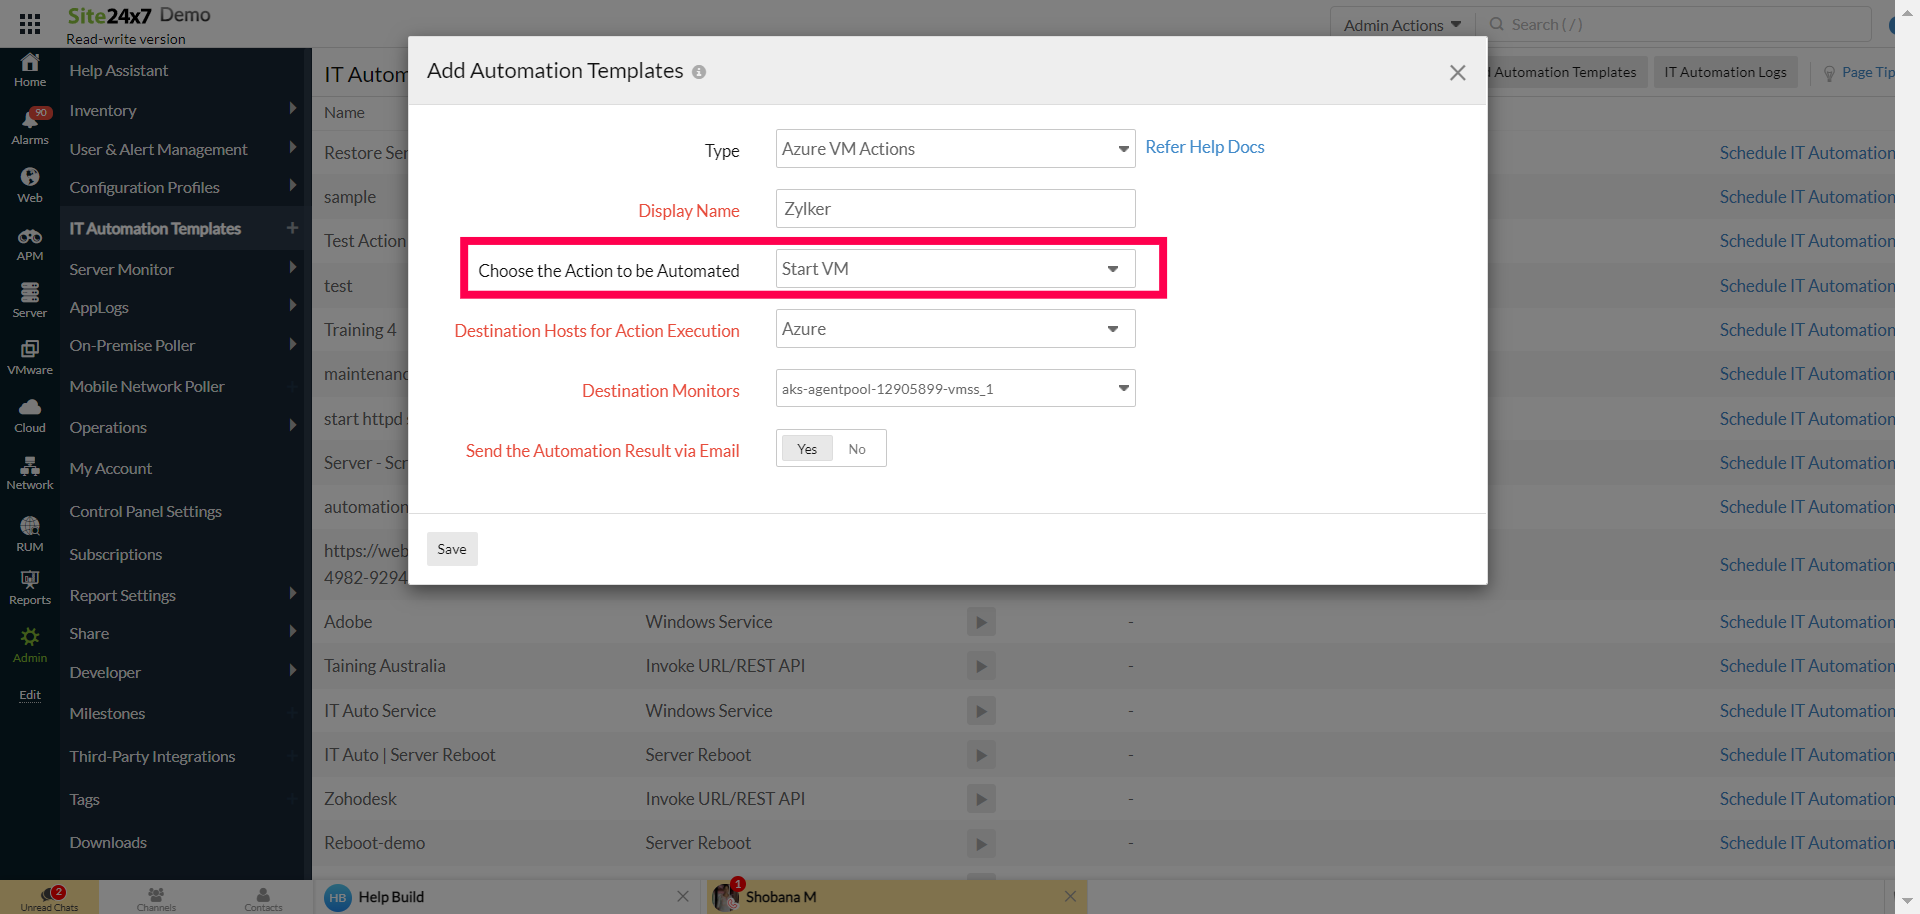
How to configure IT automations for a monitor.
Configuration Rules
It can be time-consuming to configure Threshold Profile, Notification Profile, Tags, Monitor Group, and other parameters for multiple monitors. You can automate the configuration settings of your monitoring resources using Configuration Rules. You can run a scan and associate any of the previously generated rules that suit the monitor configurations while adding new monitors.
How to add a configuration rule.
Summary
You can get performance data organized by time for the above-mentioned metrics using the Summary Tab.
- To view the summary, go to Cloud > Azure, click the Azure monitor > Azure Virtual Machine.
- Click a resource and select the Summary tab.
By doing so, you can view the Availability, Downtime, Inbound and Outbound Billable Network, and much more.
Configuration Details
The Configuration Details tab provides details of the VM. Here, you will find the Hardware Profile, Storage Profile, OS Profile, Network Profile, and so on.
- To get the configuration details, go to Cloud > Azure and click the Azure monitor > Azure Virtual Machine.
- Click a resource and select the Configuration Details tab.
Forecast
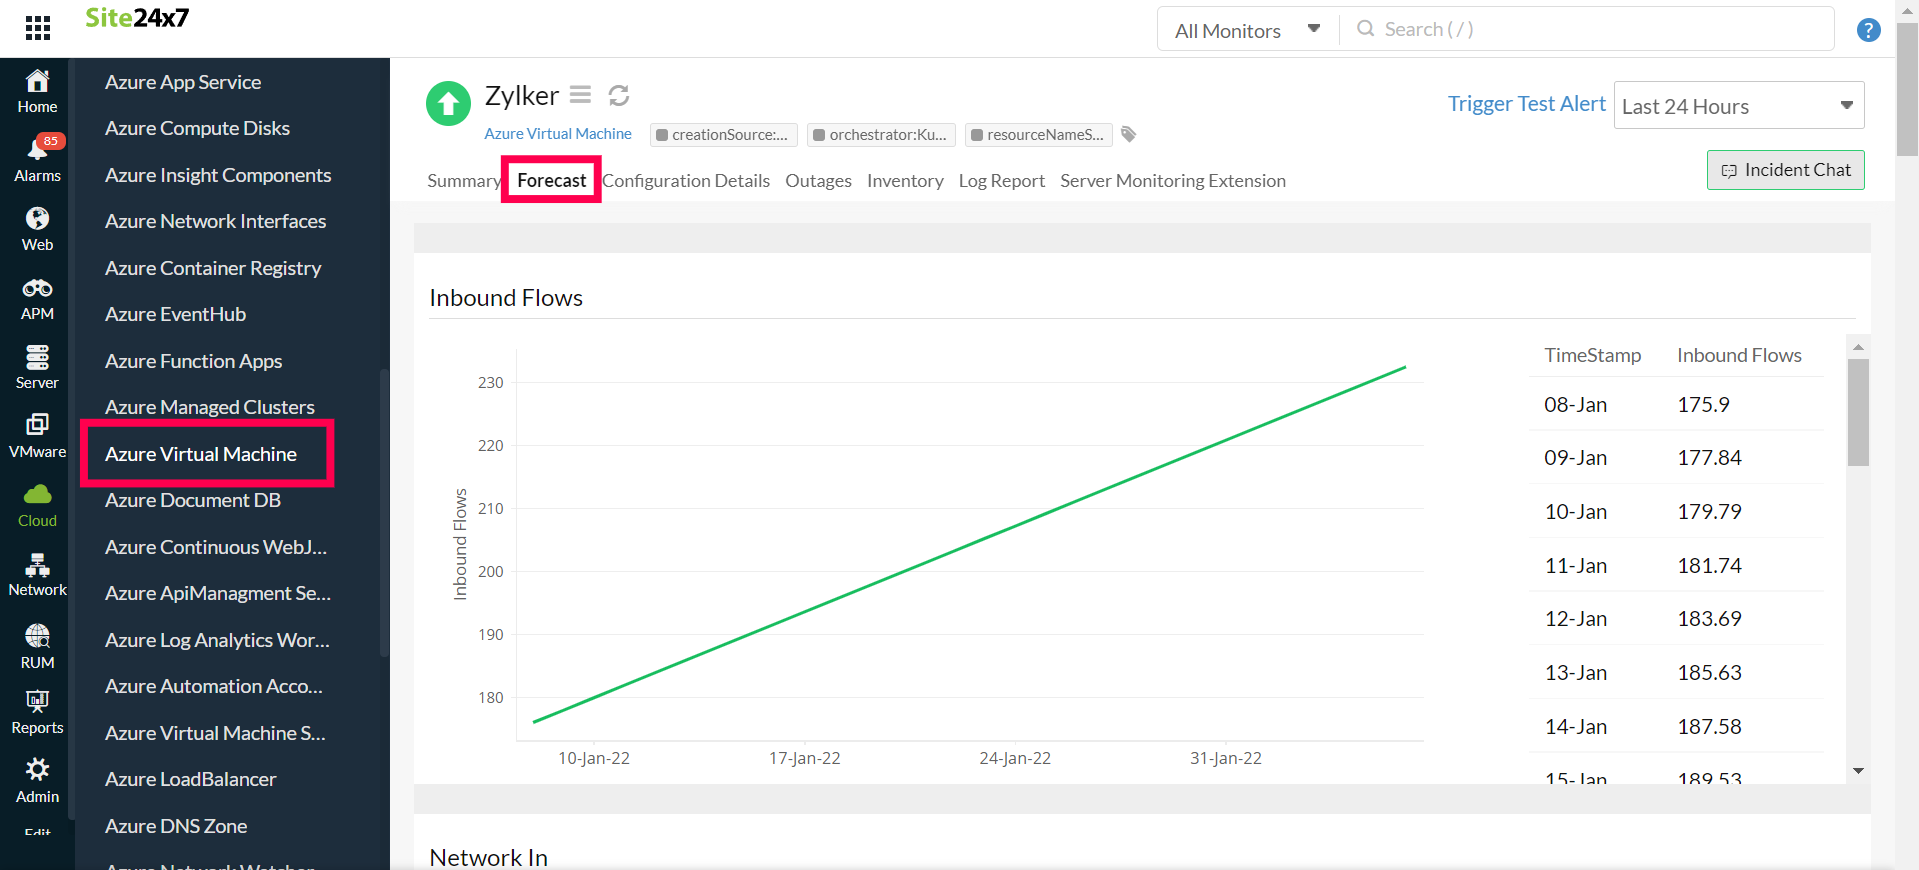
With Site24x7's Forecasting Engine, you can predict the future points of an Azure VM performance metric based on historical observations. To predict what your metric usage will be over the next seven days, the VM monitor uses between fifteen and thirty days of historical data.
You can view the forecast charts from Cloud > Azure, navigate to the Azure monitor, select Azure Virtual Machine from the drop-down, and select the Forecast tab.
Reports
Gain in-depth data about the various parameters of your monitored resources and accentuate your service performance using our insightful reports.
To view reports for Azure VMs:
- Navigate to the Reports section on the left navigation pane.
- Select Azure Virtual Machine from the menu on the left.
You can find the Availability Summary Report and the Performance Report for the selected monitor. You can also get the Inventory Report, Summary Report, Availability Summary Report, Health Trend Report, and the Performance Report for all the Azure VM monitors.
Azure Virtual Machines monitoring also provides a Server Integration Report that lets you know if the VM Instance has an integrated Server monitor with it.
You can also get reports from the Summary tab of the VM monitor.
- Go to the Summary tab of a resource, and get the Availability Summary Report of the monitor by clicking on Availability or Downtime. Similarly, you can view the Performance Report of the monitor by clicking on any chart title.
Check out the list of reports offered by Site24x7 for your individual monitor types.
Related links
How to add an Azure monitor
How to configure IT automations for a monitor
How to integrate an Azure App Service monitor
How to add a configuration rule
