Introduction to AWS infrastructure dashboard.
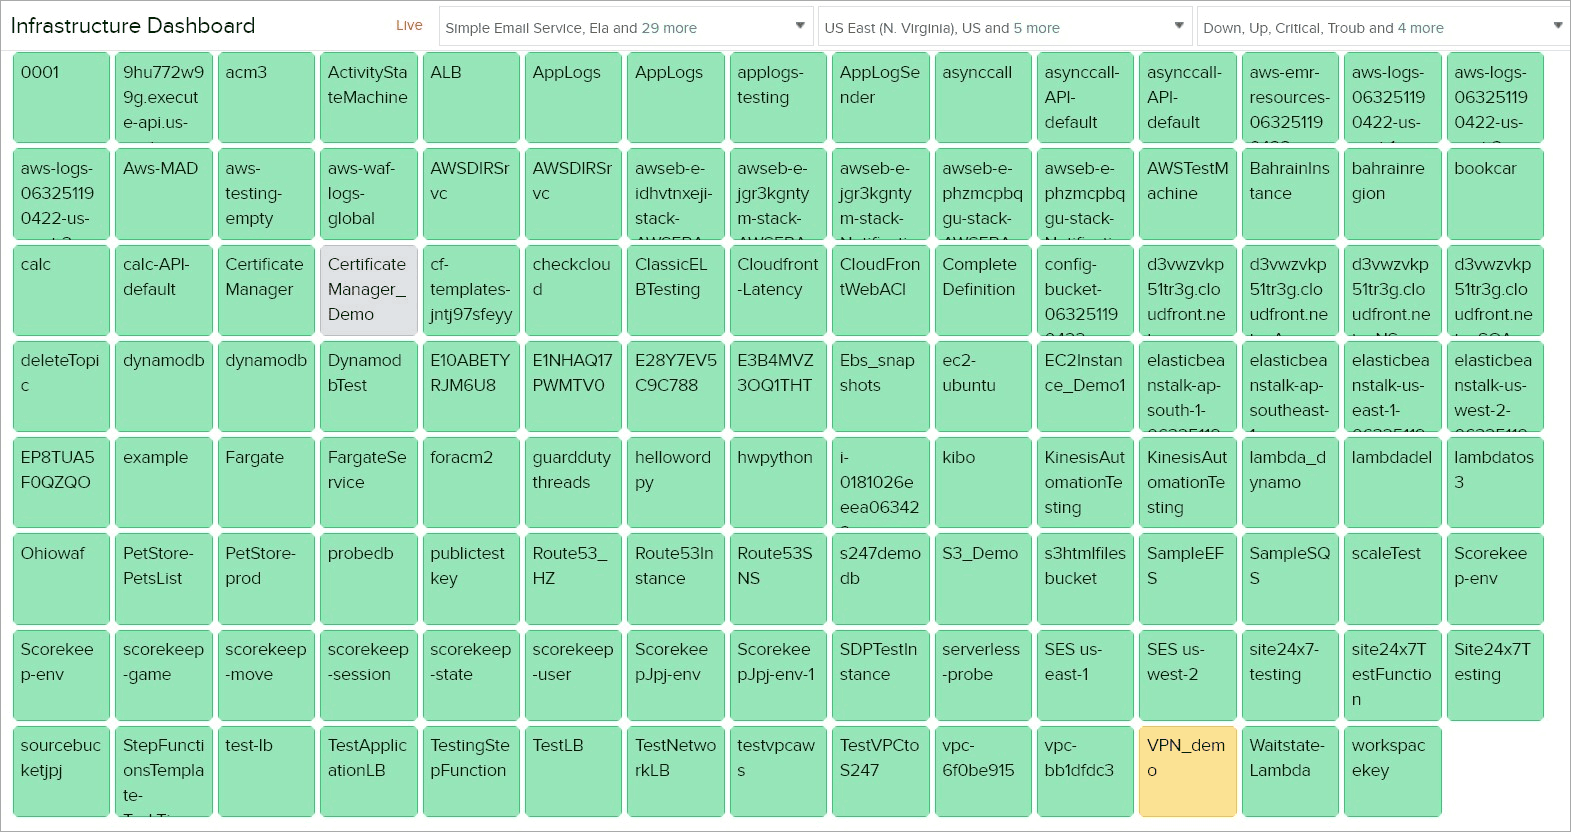
The AWS infrastructure dashboard provides a NOC view of high-level health and performance overview of every supported cloud resource monitored in your AWS platform. In a single unified view, a near-real-time status of each AWS infrastructure component, powering your application in the AWS Cloud is displayed.
Requirement
At a minimum you must have the below-mentioned requirements, to access and use the AWS inventory dashboard.
- You must have an Eval or Paid Site24x7 subscription account
- You must have an Amazon Web Service(AWS) monitor.
To create an AWS monitor, enable access to your AWS account via IAM user creation or cross-account IAM role and connect your AWS account with Site24x7. Learn more.
Features

Based on the underlying AWS service, the infrastucture dashboard organizes the UI into NOC view for each account. Each of the resource box contains all the monitored individual instances, displayed as color-coded tiles.
Data sources
The health status of a resource tile is determined from data obtained from a number of sources.
- Performance metrics obtained from our native CloudWatch integration and the value of the various parameters, relative to the threshold set for a given time period.
- OS level and application metrics pushed by our server agent running on your EC2 infrastructure hosts and the corresponding threshold breaches for the metrics supported.
- EC2 instance and system status check results.
- User-driven actions – For example, intentional instance stoppage.
Dashboard UI behavior
During a threshold violation, the respective resource tile will start to blink heralding a status change and accompanied by a sound notification, the color code of the tile will change accordingly.
Mouse over any color coded tile to get additional metadata information about the resource – Name, AWS region where it is deployed, Type of the resource and the reason for threshold violation. If a resource tile becomes critical and changes state from Up to Trouble, Critical or Down, then you can quickly mouse over the said resource tile to gather information about the nature of the threshold violation.
You can also click on the resource tile, to navigate to the respective UI page, to get more additional performance data for your resource.
Filters
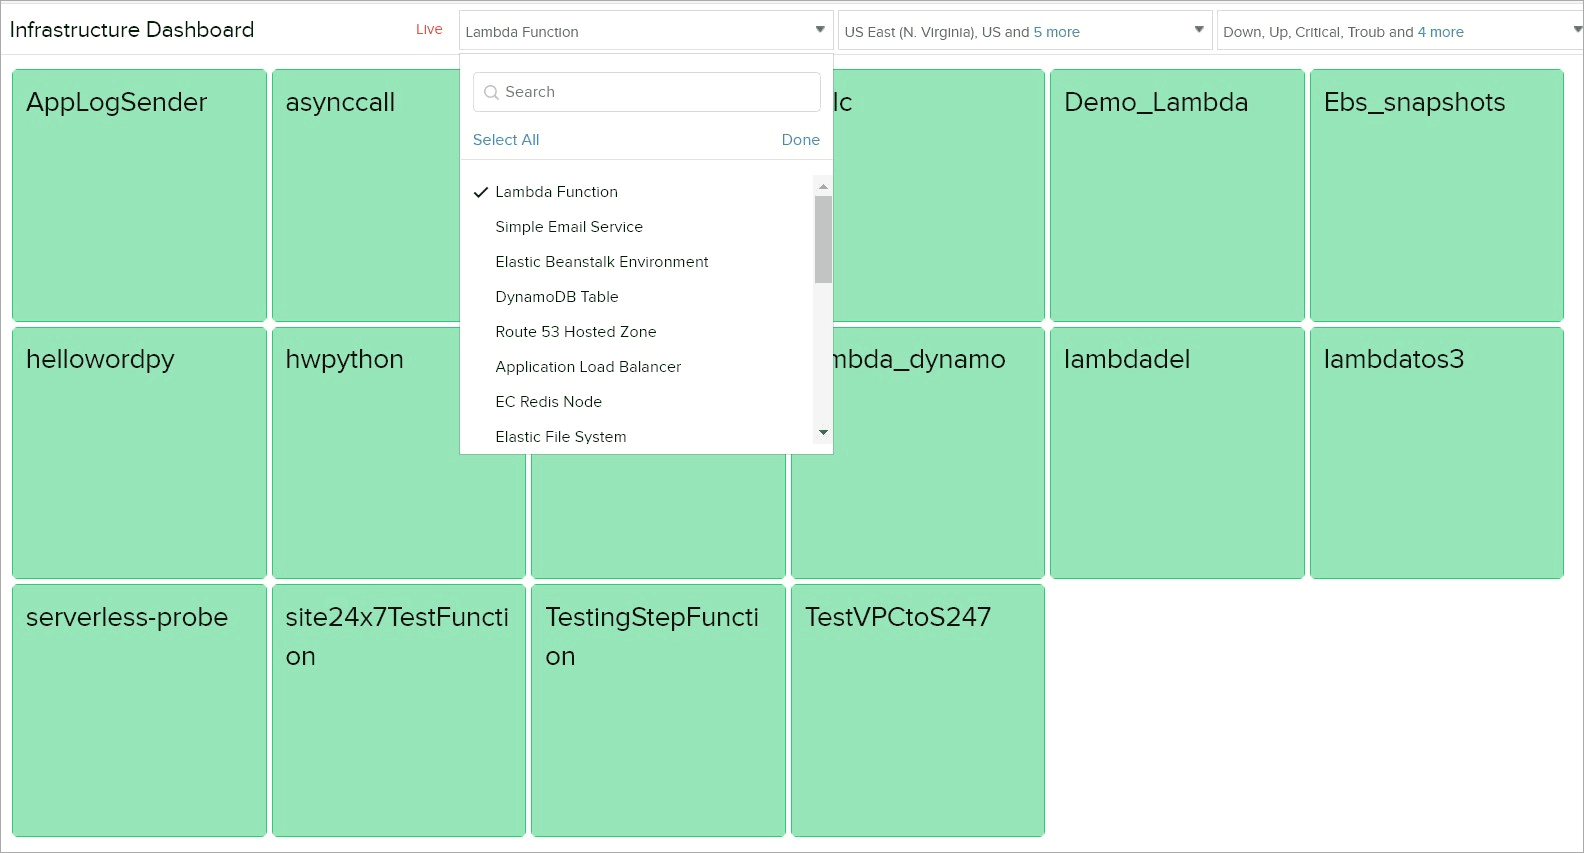
You can also customize the infrastructure view, by making use of the selected service, region and monitor state filters. For example, you can use our Region based filters to display AWS resources attached to a particular geographic region which could be of interest to your Cloud Ops team or you can also combine both filters together to organize and display the monitored AWS resources to match the perspective of the NOC or Operation teams viewing them.
- Based on service
From the dropdown select a service to filter, based on which the monitors can be grouped and displayed as follows.

- Based on region
From the dropdown select a region to filter, based on which the monitors can be grouped and displayed as follows.

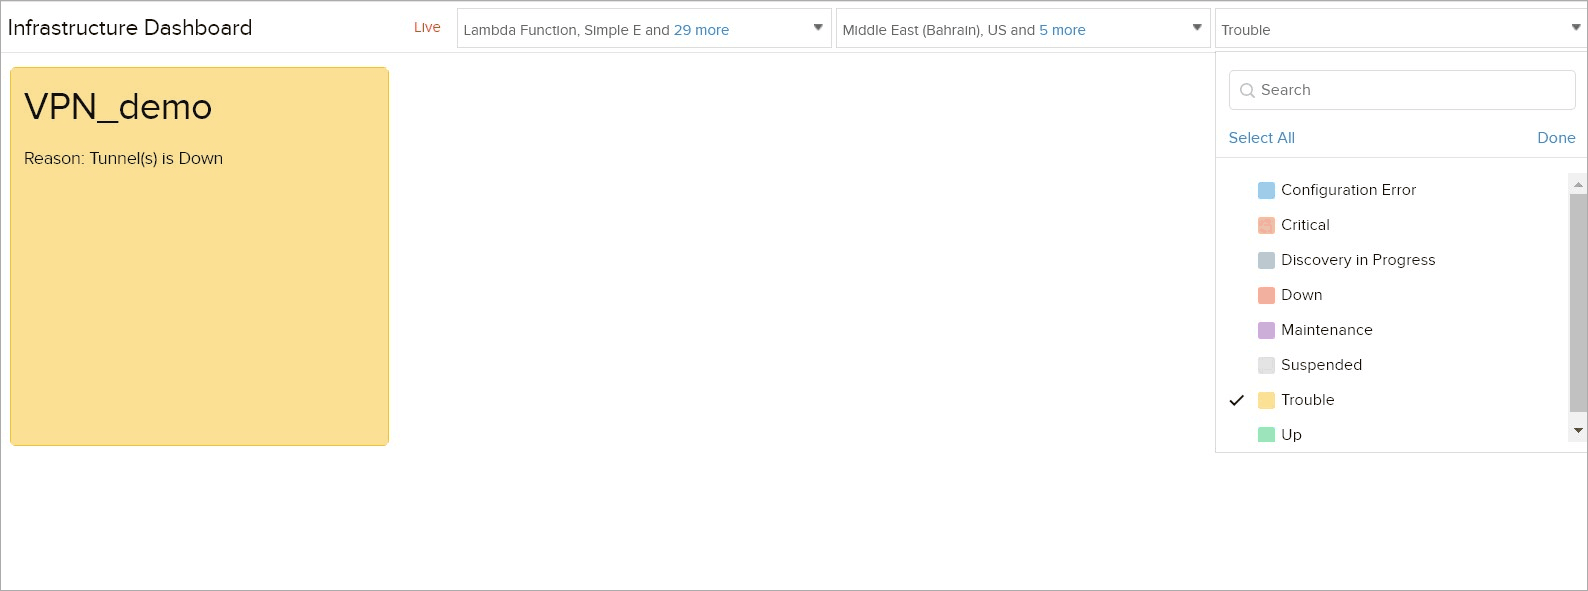
- Based on monitor status
From the dropdown select a monitor status to filter and display the monitors accordingly.

Best practices
For a robust and powerful Infrastructure dashboard, Site24x7 recommends you to use the following features sets in addition to our native CloudWatch integration.
- Agent-based Monitoring: Here you can deploy an agent on your EC2 instance and monitor OS level metrics, process data and custom metrics of various open source application components running on top of your instance.
- Also when you create and attach a threshold profile to a monitored AWS resource, it is recommended that your assign multiple alert conditions and configure Advanced alerting strategies for each supported performance counter.
All Accounts view
You can activate the All Accounts tab by monitoring more than one AWS account with Site24x7. The AWS infrastructure dashboard listed under the All Accounts tab, provides a consolidated, color coded, health and performance view for the resources monitored across your multiple AWS accounts.
