JavaScript errors
The complexity of modern applications coupled with the prevalence of cryptic minified code makes it difficult to accurately identify the exact location of the error.
With Site24x7's JavaScript Errors feature, you can consistently monitor the JavaScript errors that are being collected. You can also debug the errors and find the exact line of error using the stack trace.
View JavaScript errors
- Log in to your Site24x7 account.
- Navigate to RUM > your application > JavaScript Errors > Errors.
In the top-right corner, you can also specify the time frame for which you need error metrics.
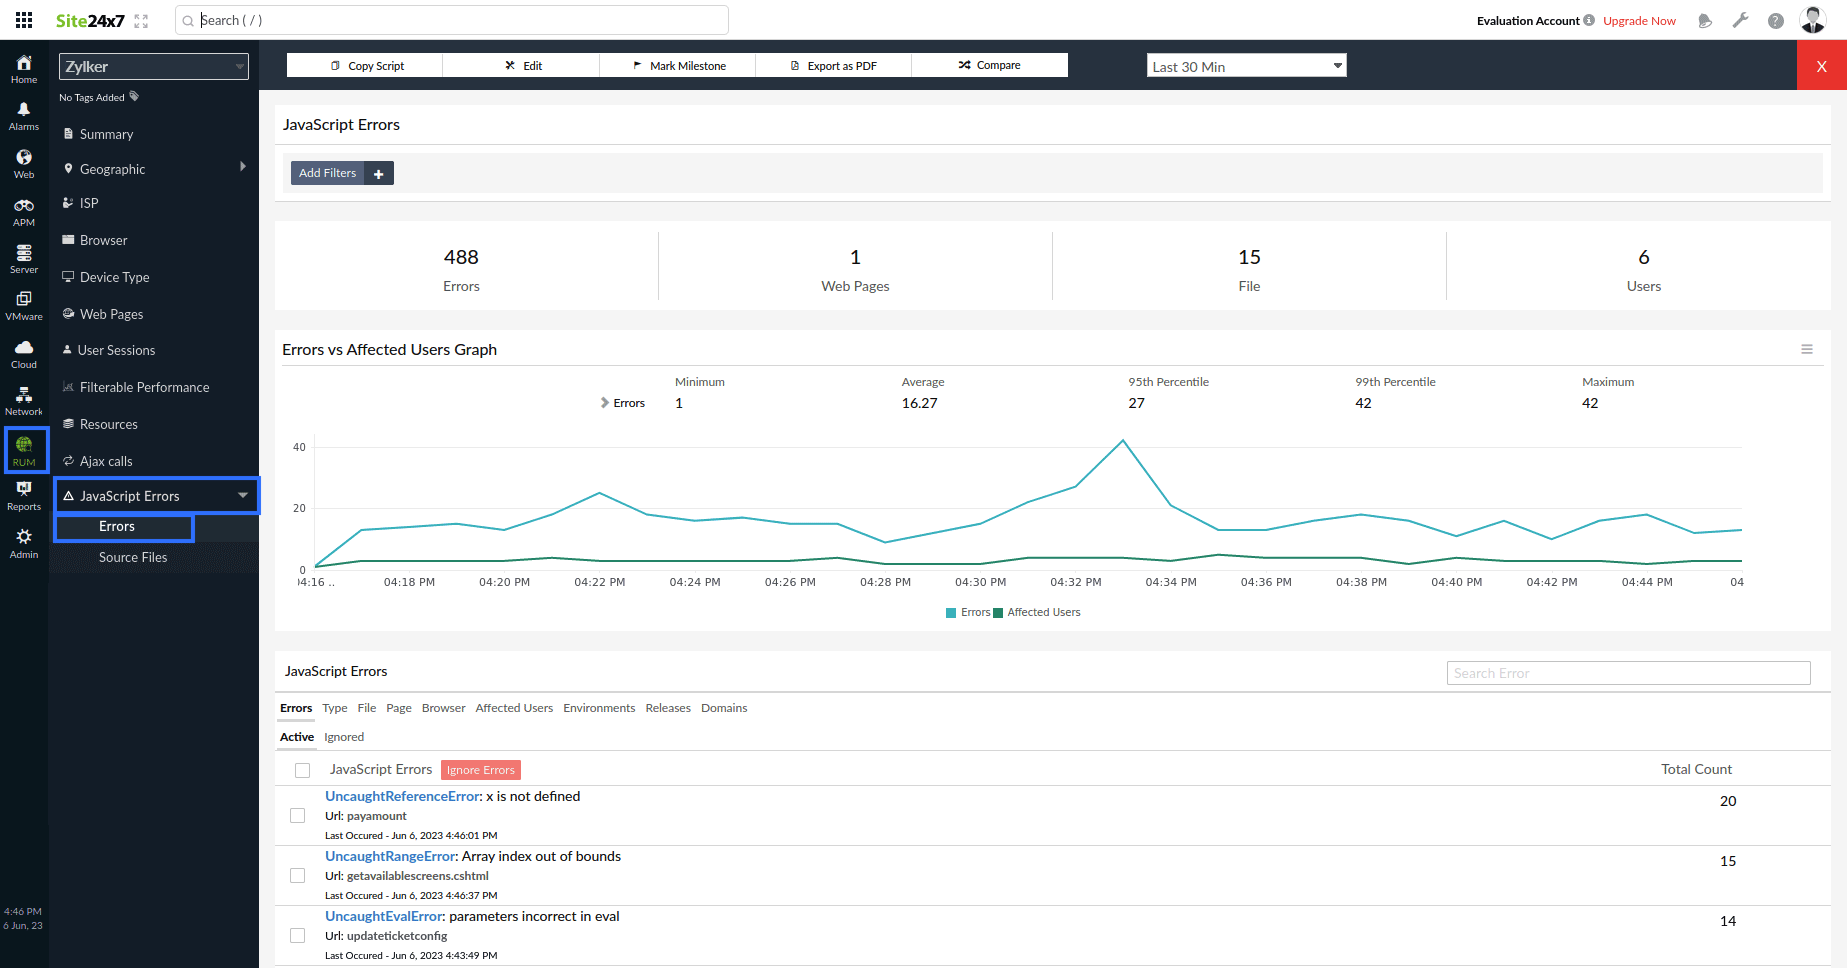
- The top band displays the total number of errors, the total number of web pages where errors occurred, the total number of files with errors, and the total number of users.
Click the Add Filters button to narrow down the errors based on the error type, file type, webpage, browser, user, environment, release, and domain.
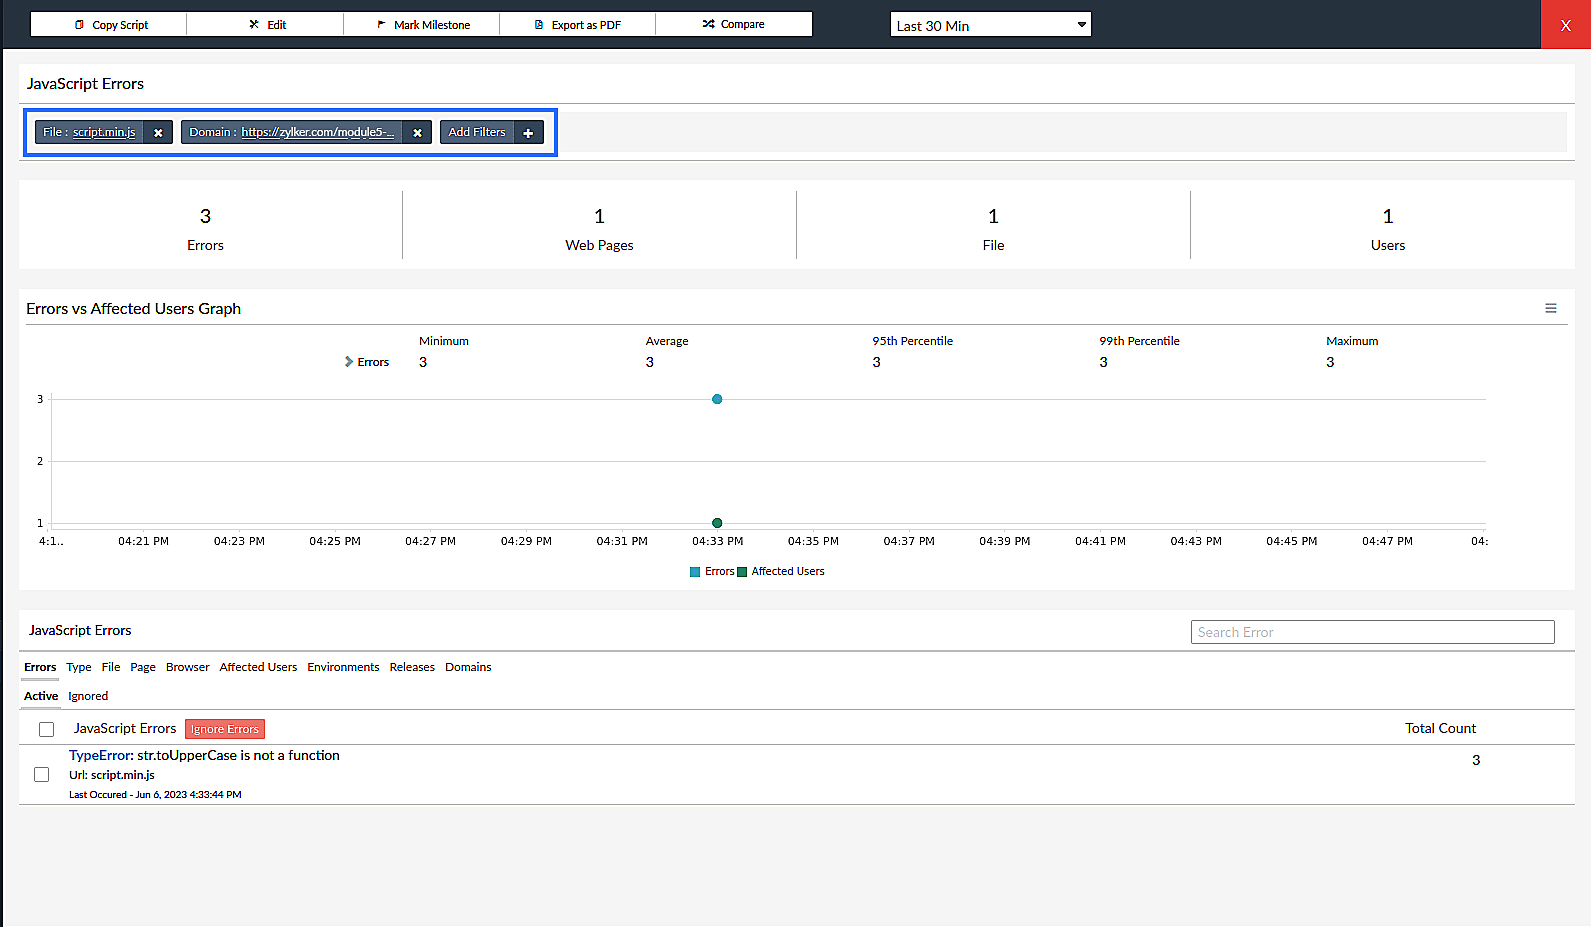
- The graph below the top band depicts the Errors vs. Affected Users. You can also get a summary of the errors that occurred and the users affected for the minimum, average, maximum, 95th percentile, and 99th percentile values.
- The section below the graph lists the errors. You can click on the specific errors to inspect them further.
You can also view the errors based on the error type, file type, webpage, browser, user, environment, release, and domain by clicking on the respective tab.
View error details
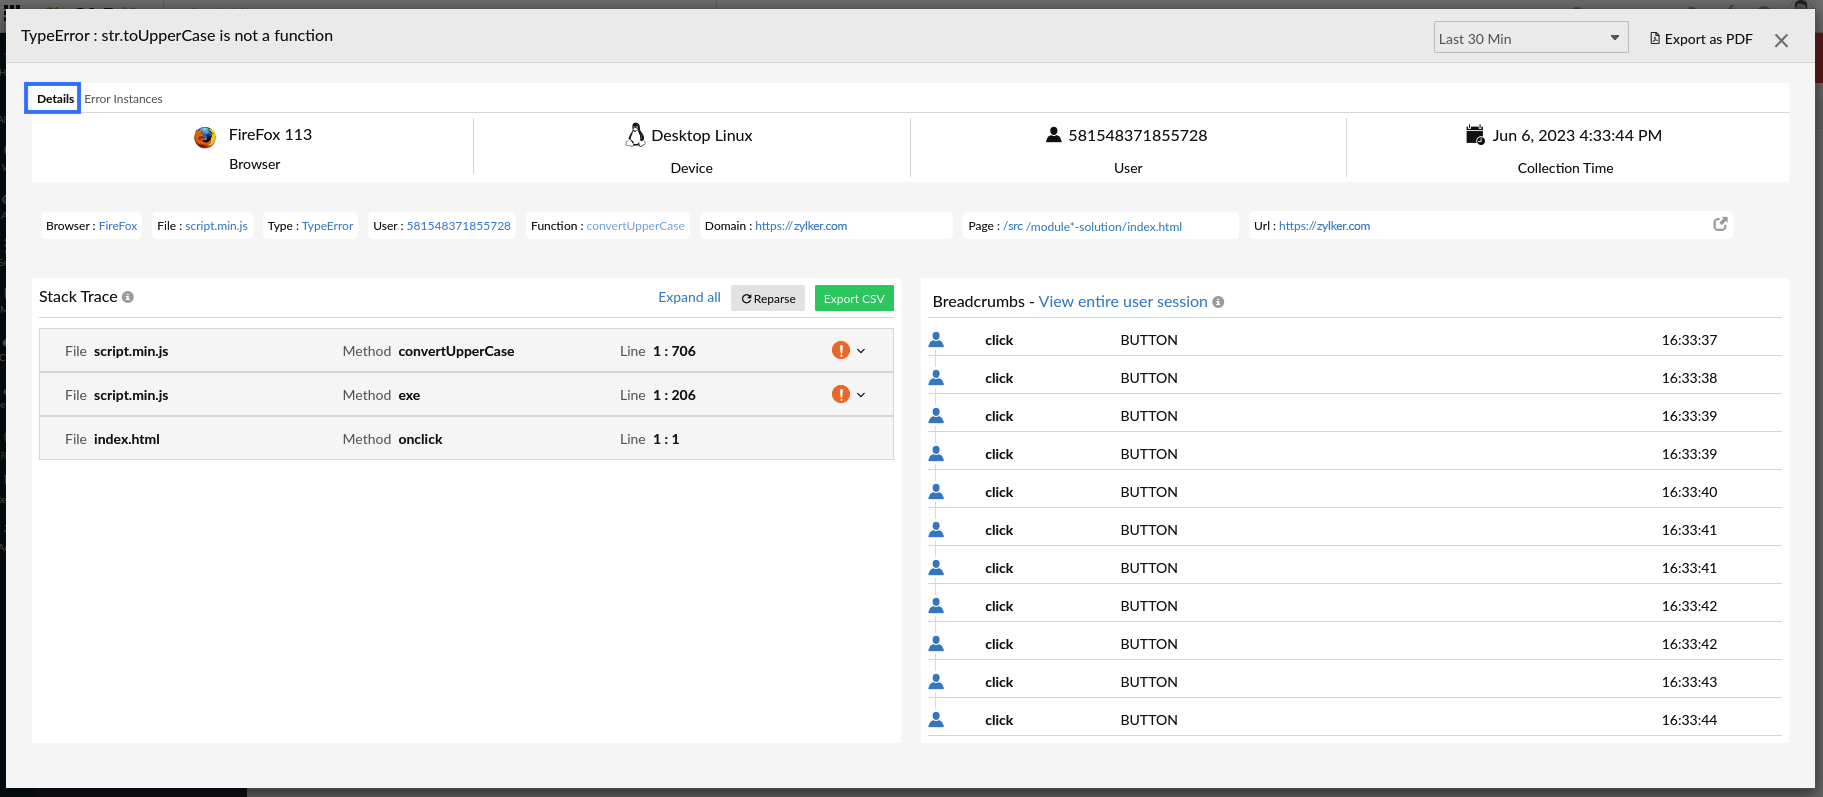
Clicking on a JavaScript error will open the details page.
Details tab
The top band displays the respective error details, such as the device and browser in which the issue occurred, the user ID of the affected user, and the time at which the error details were collected.
Below the top band, you can see metadata such as browser, file name, error type, user ID, and so on. Clicking on any of these will open a new tab with this applied as a filter.
Stack Trace
The Stack Trace shows the file name, method name, and line number of the error. You can de-obfuscate the minified error file to find the exact line of code containing an error.
- If the source map and JS Source files are uploaded (a green tick indicator appears), the exact line of error code will be shown.
- If the source map and JS source files are not uploaded (an orange exclamatory mark appears), you need to upload them in order to get the exact line of error code.
You can click on Export CSV to download your stack trace as a CSV file.
Automatic detection of the source map
In some cases, the RUM agent will automatically detect the source map if it is hosted on your website.
Case 1: The source map path is specified
If you have mentioned the file name, relative path, or absolute path of the source map in the minified file, the RUM agent will automatically search for the source map in the same directory as the minified file.
Syntax:
- sourceMappingURL= (file name)
- sourceMappingURL= (relative path)
- sourceMappingURL= (absolute path)
Examples:
- sourceMappingURL= (script.js.map)
- sourceMappingURL= (dummy_dir/script.js.map)
- sourceMappingURL= (https://<Some domain name>/src/map/script.js.map)
Case 2: No source map path is specified
If you haven't made any mention of the source map in the minified file:
- The RUM agent will automatically look for the source map path in the response header of the minified file.
Syntax:
x-sourcemap-url: (source map path)
Example:
- If it is not specified in the header, the agent will look for it in the directory with the same name as your minified file.
Example:
If your minified file has the name script.min.js, the RUM agent will look for the source map with the name script.min.js.map.
- If a source map is automatically detected, the exact line of error code will be displayed. For example, in the screenshot below, Line 90:8 in the method convertUpperCase and Line 32:19 in the method exe are the exact lines of error code in the script.min.js file.
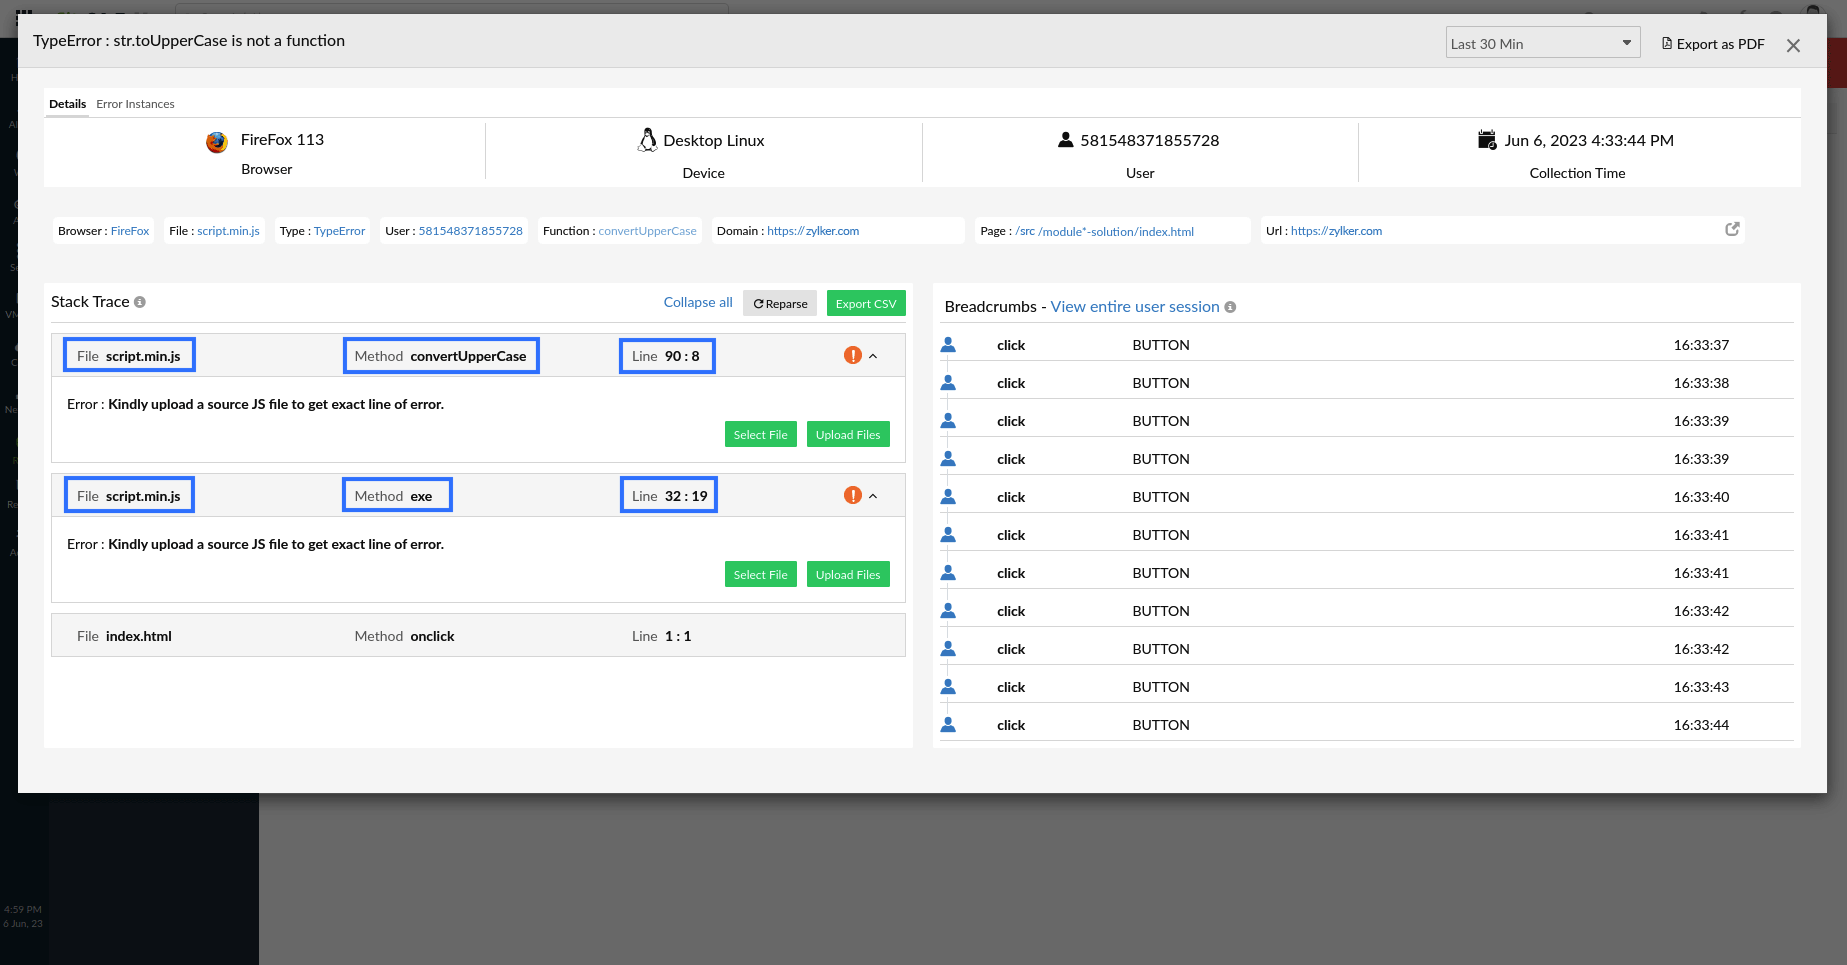
However, if you want to see the code snippets for the same, you must manually upload the JS Source file.
- If the source map fails to be detected for some reason, the system will prompt the user to manually upload both the source map and the JS Source file.

Upload files
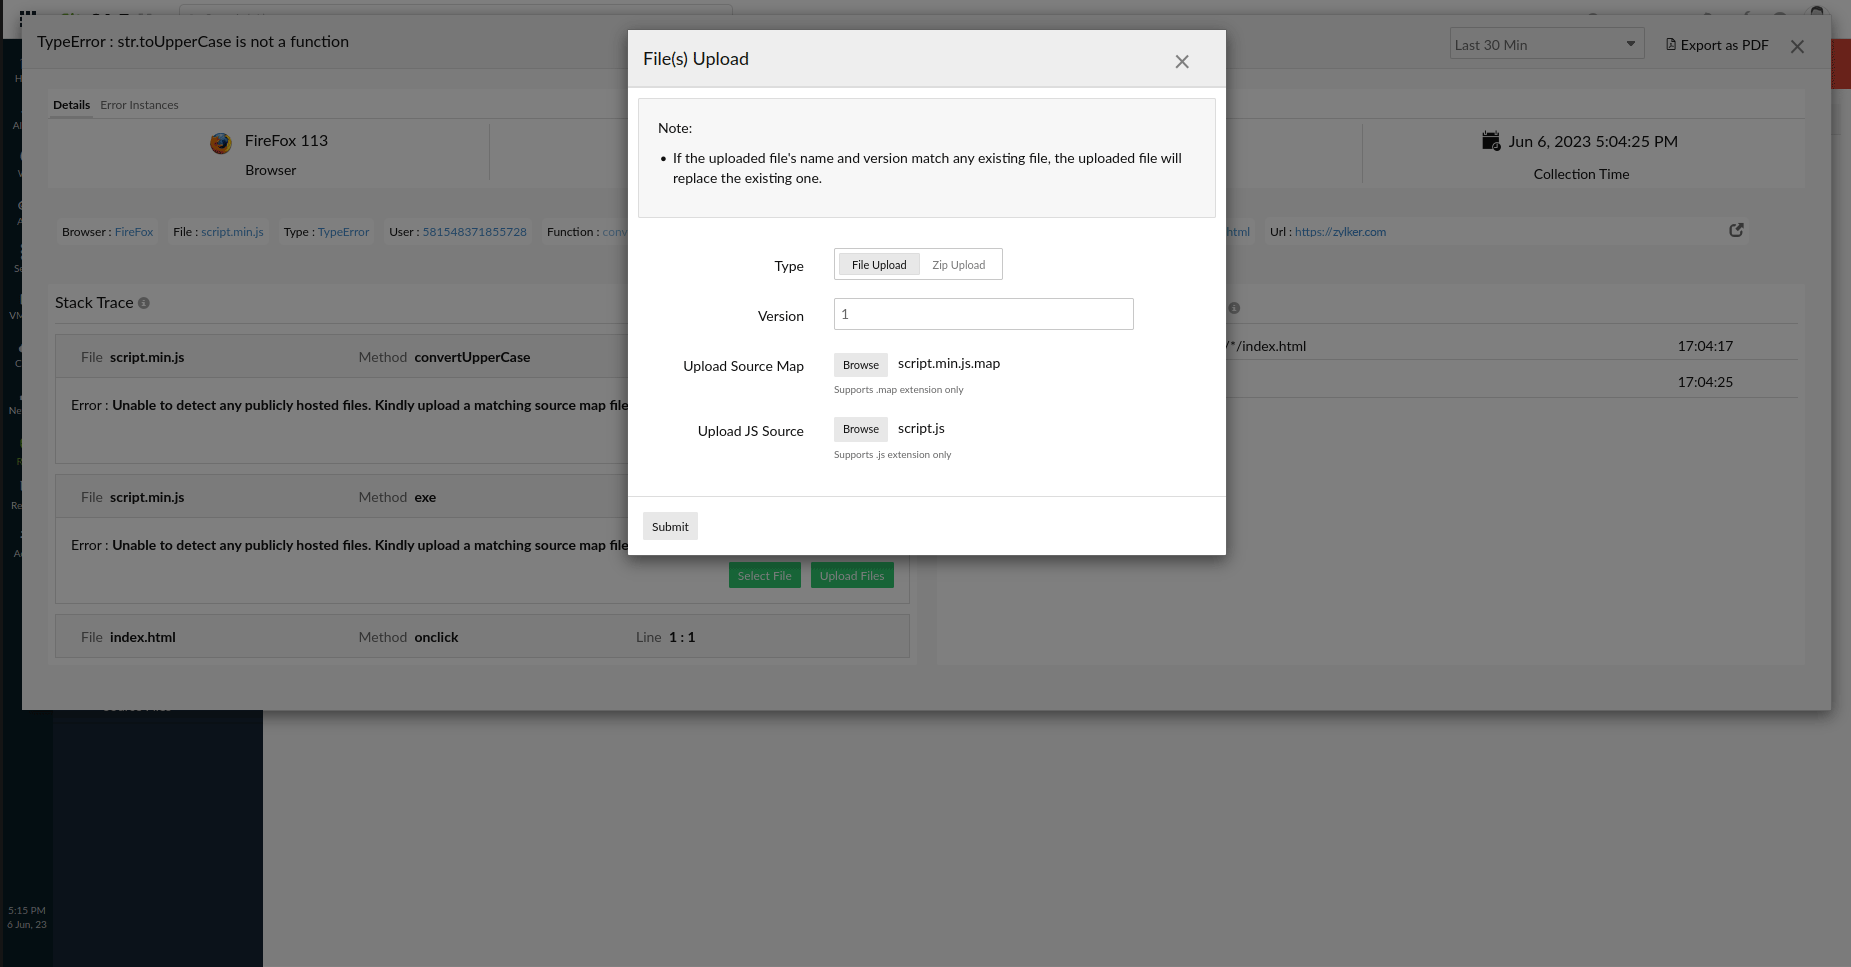
- Click on the Upload Files option.
- If it is a File Upload:
- Mention the version (for your reference).
- Browse and upload the source map.
- Browse and upload the JS Source file.
- If it is a Zip Upload:
- Mention the version (for your reference).
- Browse and upload the ZIP file containing all of the required files.
- Click Submit.
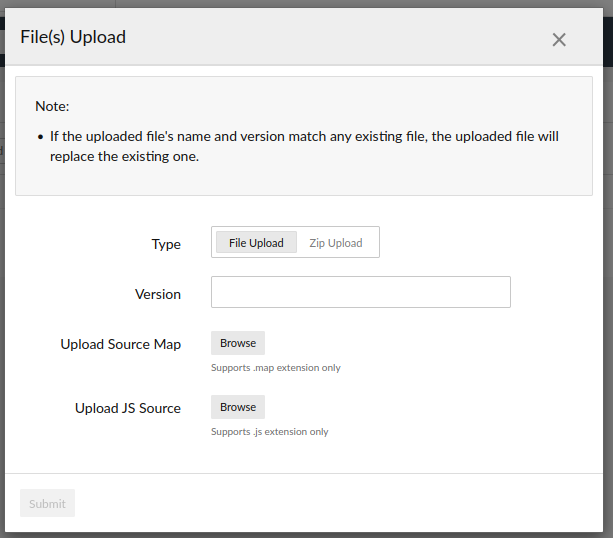
- If you upload the same file (same file name) with a different version, it will be considered a different file.
- If you upload the same file (same file name) with the same version, the new file will replace the existing one.
- If you want to map a different file, choose it from the drop-down menu and click Reparse.
Breadcrumbs
This section displays all of your most recent actions. You can use this to determine which action resulted in the error.
For example, if you click Login > Submit email > Begin play, the RUM agent records each action as a breadcrumb. You can also see when each activity takes place. This shows how long you stay on a page before hitting the next button.
When you click the View entire user session link, you will be taken to the summary page for the corresponding User Session.
Error Instances tab
The Error Instances tab gives a detailed error report of the selected error for the chosen time period.
When you click on an individual instance, you will be taken to the respective error's Details tab.
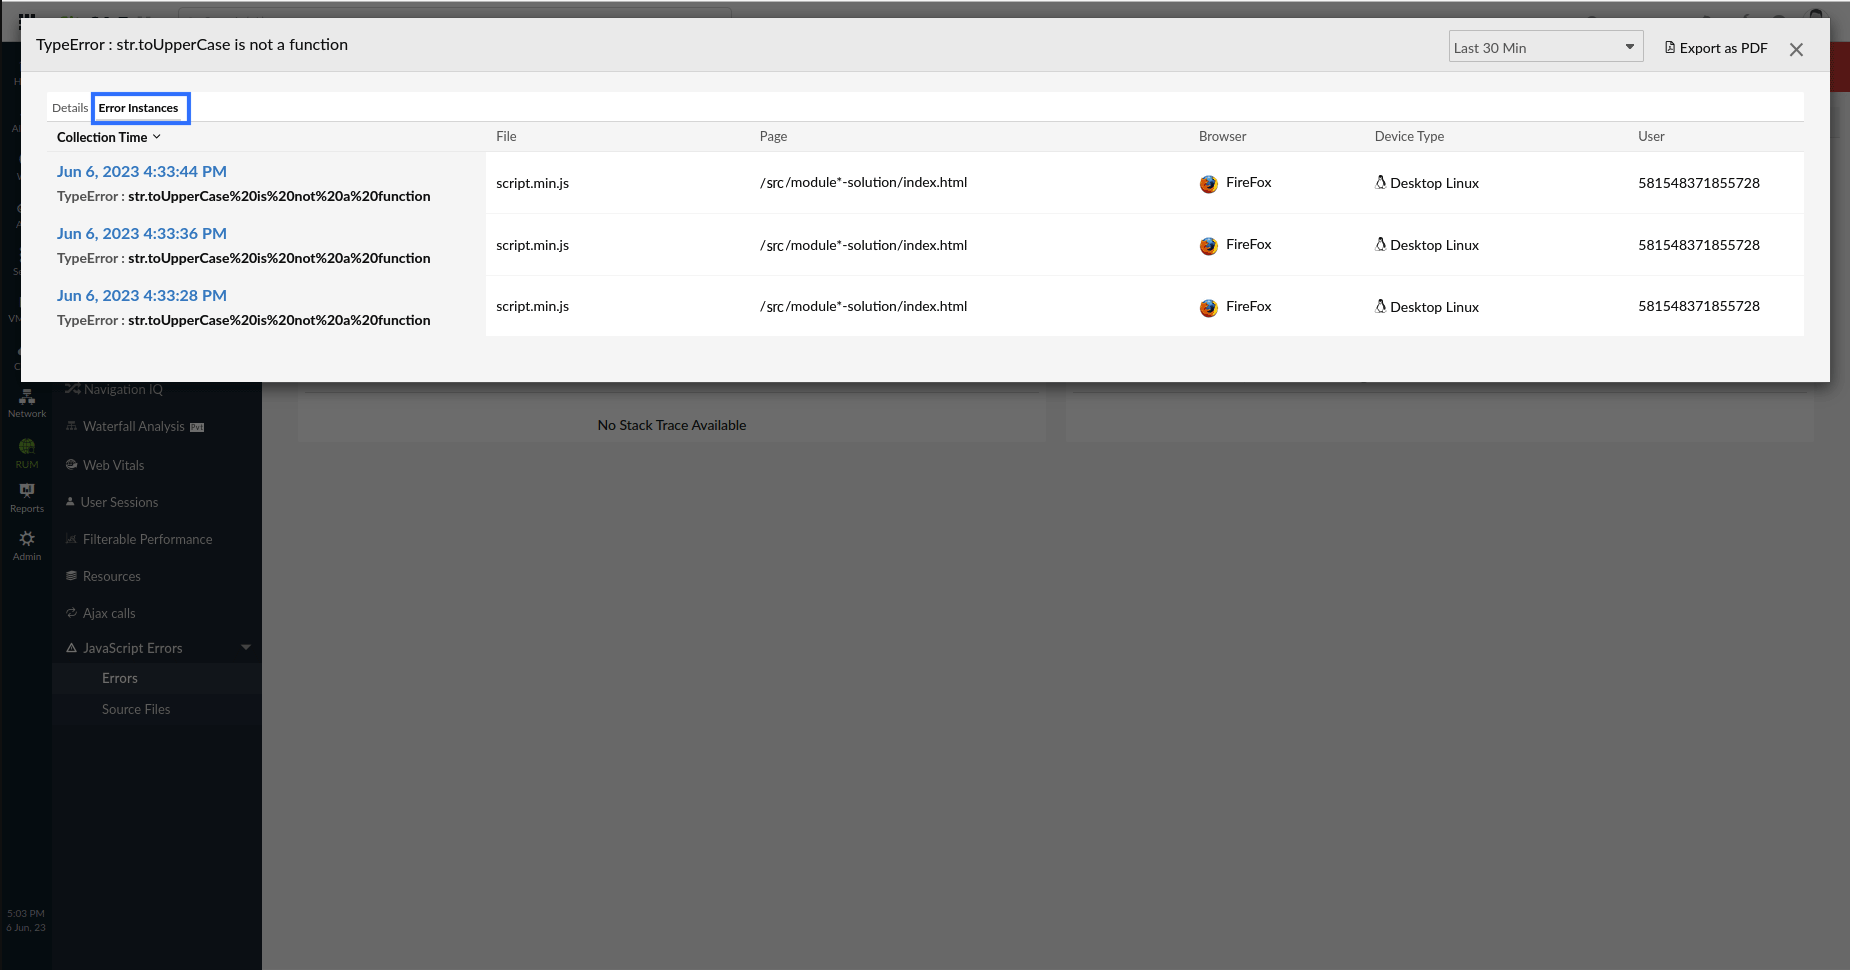
| Parameters | Description |
| Collection Time | The time when the error was discovered |
| File | The name of the file where the error occurred |
| Page | The URL of the web page where the error occurred |
| Browser | The browser in which the error occurred |
| Device Type | The device in which the error occurred |
| User | The user for whom the problem occurred |
You can also export this information as a PDF file.
View uploaded files
- Navigate to RUM > your application > JavaScript Errors.
- Select Source Files to view all of the files that have been uploaded.
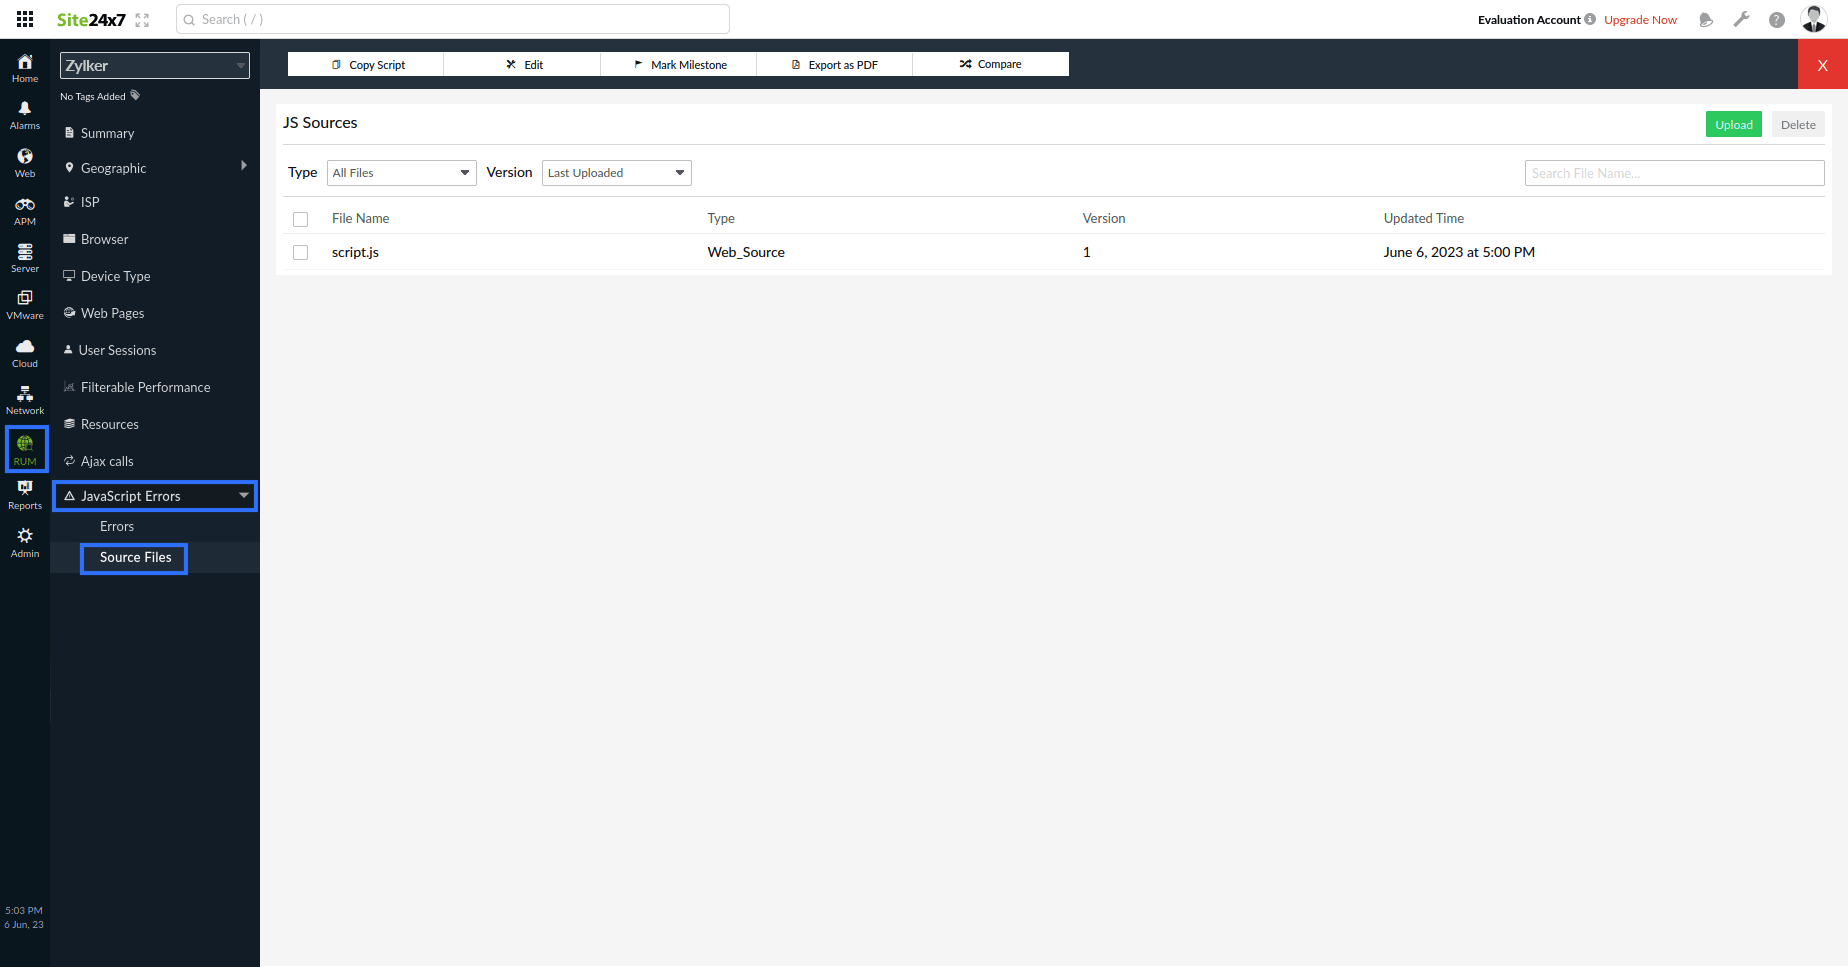
You can perform a quick search based on the file type and version by selecting them from the appropriate drop-down menu. You can also search for a file by its name using the Search by File Name box.
Upload and delete files
- You can also upload the source map and JS source file by clicking Upload.
- You can delete files by selecting them and clicking Delete.
Use case
In this example:
- You can see that an error occurred in the application's Minified JS file.

- However, as shown in the screenshot below, the debugging process is quite difficult because files are minified to a single line, making it extremely difficult to interpret and diagnose the code causing the error.

- To view the error in RUM's JavaScript Errorssection and inspect it further, follow these steps:
- From the Site24x7 web client, navigate to the RUM section.
- Go to the JavaScript Errors section.
- Set the time frame to Last 30 Min to filter only the recent occurrences.
- Browse through the list of errors and click on the specific error you want to inspect further.

- Since no map files have been hosted on the website, the system prompts to upload the required source map and original JS file.
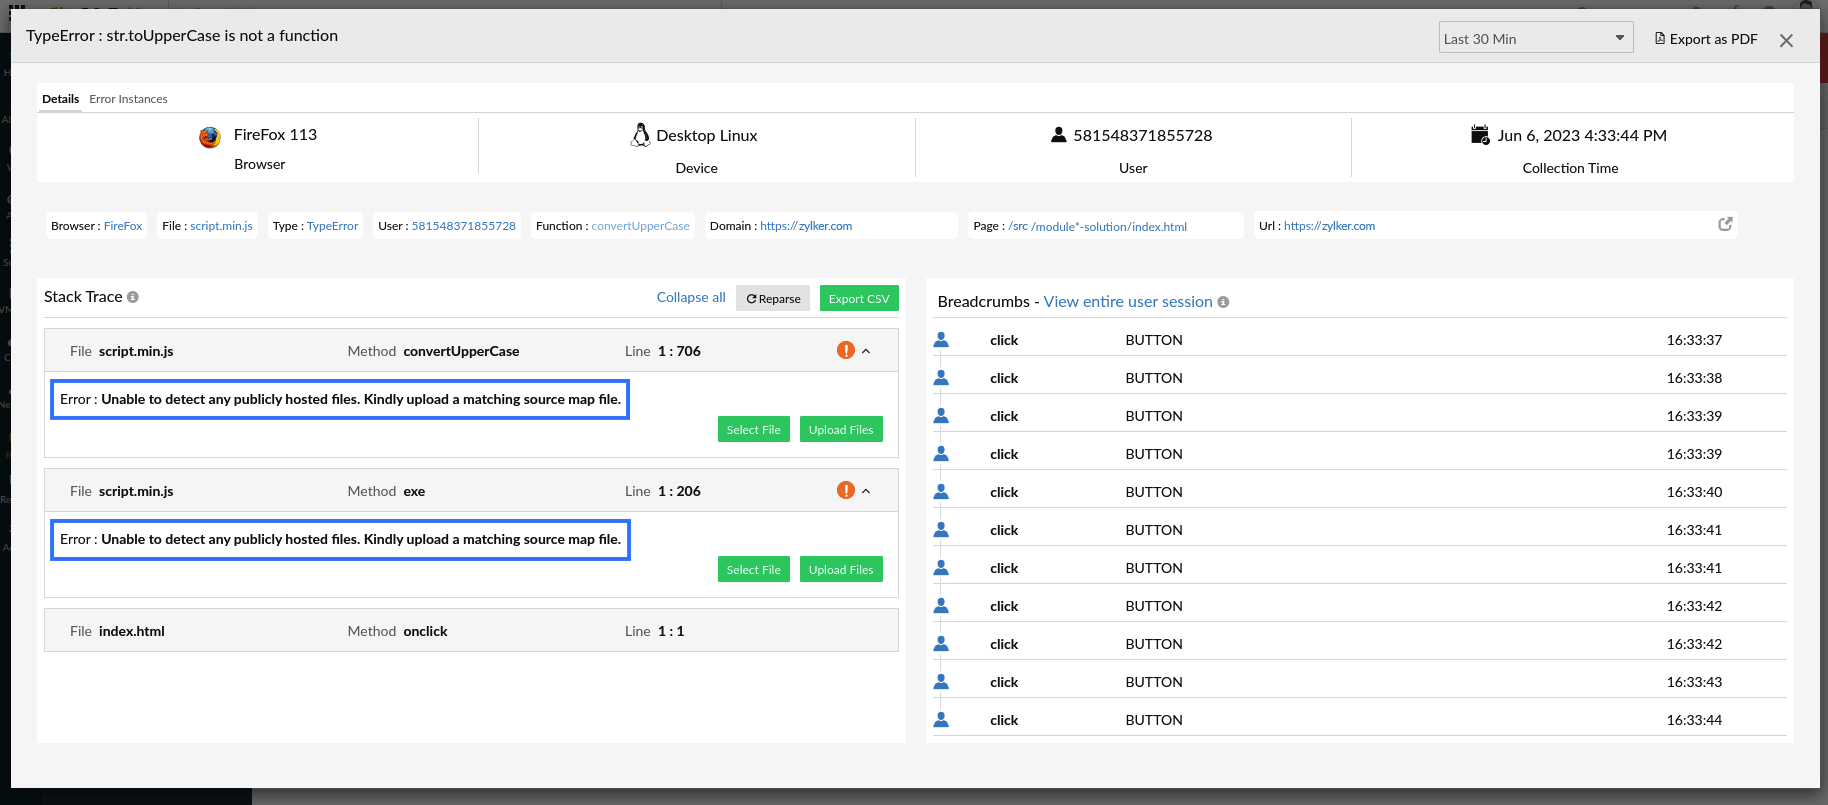
- Click the Upload Files option and upload the required files. Finally, click Submit.
As a result, the exact line of error code is shown in the below screenshot.
