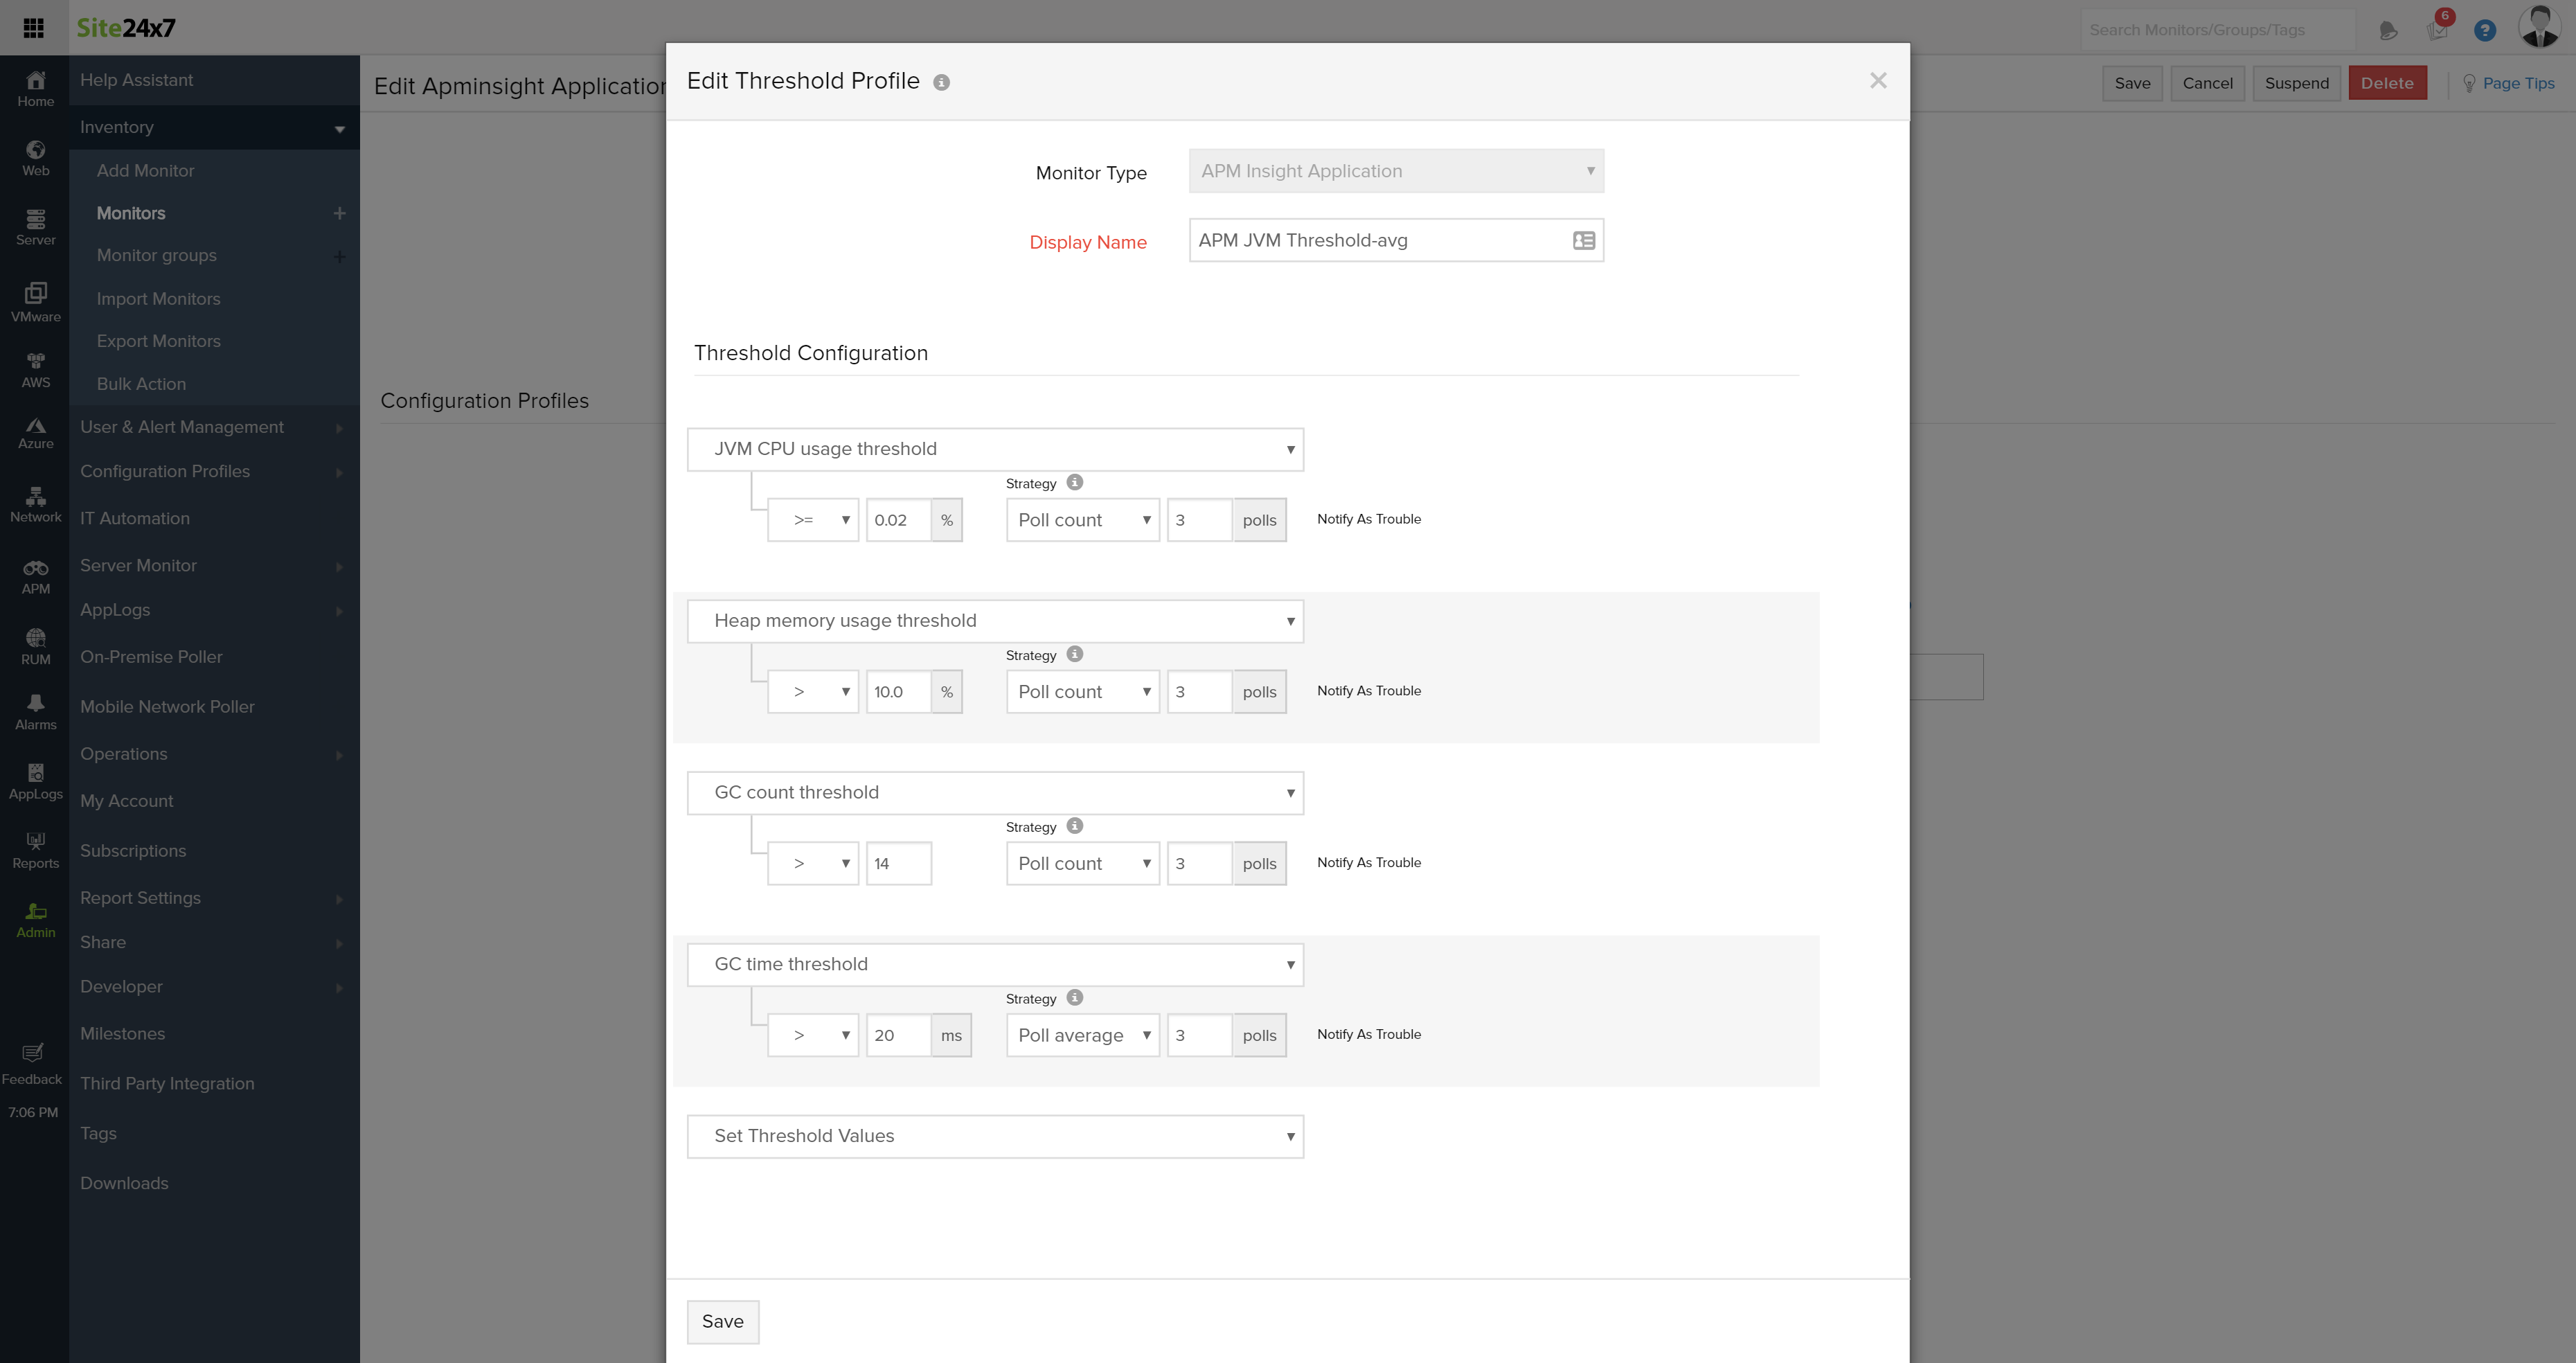
Alerts for JVM metrics
For Java applications, alerts can be configured for key JVM metrics like JVM CPU usage, Heap memory usage, Garbage Collection count and Garbage Collection time.
How it works
JVM metrics is polled every five minutes. You can set threshold values for the above mentioned parameters and choose to get alerted based on poll frequency or poll average.
Let's look at a few examples to understand this in detail.
Example 1:
Alerting criteria : JVM CPU usage threshold count > 2%; Poll count is 5 polls.
In this scenario, you will receive an alert only when your JVM CPU usage count is greater than 2% for 5 continuous polls.
Example 2:
Alerting criteria : JVM CPU usage threshold count > 2% ; Poll average is 3 polls.
In this scenario, you will receive an alert only if the average value of 3 polls is greater than 2%.
To configure alerts for JVM metrics
- Log into your Site24x7 account
- Your application > Edit Alert configuration
- Configuration profiles > Edit threshold profile > Edit threshold configuration

-
On this page
- How it works
- To configure alerts for JVM metrics
